Abstract
Rangeland plant communities of the Intermountain West dif- fer in their ecology and management requirements. Successful management of extensive areas at plant community-level resolu- tion first requires an efficient, cost-effective means of plant com- munity classification and mapping. We evaluated the influence of image acquisition date and satellite imaging system on the accu- racy of plant community maps created from multispectral satel- lite imagery of Reynolds Creek Experimental Watershed (RCEW) (234 km2) in southwestern Idaho. Maps delineating 6 native and 2 non-native Intermountain plant communities were created from Landsat 5 TM and SPOT 3 HRV data using a max- imum likelihood classification procedure. Map accuracy was assessed using ground reference points. Maps created from satel- lite data acquired during dry-down (early August) had higher overall accuracy (x– = 70.5%) than from data acquired during peak growth (early June) (x– = 54.4%). Overall accuracy of maps generated by Landsat (x– = 60.1%) and SPOT (x– = 65.5%) were statistically similar. Given their broad spatial coverages (3,600 to 31,450 km2scene-1, respectively), moderate resolutions (20 to 30 m pixels, respectively), and potential to provide high classifica- tion accuracies, the SPOT 3 HRV and Landsat 5 TM satellite sys- tems were well-suited for classifying plant communities in the Reynolds Creek Watershed and similar areas of the Intermountain West. Practical procedures for plant community classification and map accuracy assessment are presented for use by natural resource managers.
Key Words: Cover type, maximum likelihood, multispectral, rangeland, remote sensing, satellite imagery, supervised classifi- cation, vegetation.
The Intermountain region of the western United States is domi- nated by extensive rangelands containing a diverse assemblage of plant communities differing in their ecology and management needs. Classification and mapping plant communities across extensive areas by conventional methods, such as aerial photo- graph interpretation and ground survey, can often be cost prohibi- tive. Consequently, managers of these rangelands commonly lack the appropriate spatial information needed to properly manage these plant communities.
Multispectral satellite imagery can be efficiently used for vege- tation classification and mapping on extensive rangelands (Tueller 1989, Pickup et al. 1994). Although satellite-based clas- sification and mapping techniques for rangeland vegetation have been developed, tested and refined for nearly 3 decades (e.g., Tueller et al. 1975, Graetz and Gentle 1982, Kremer and Running 1993, Jakubauskas et al. 1998), range managers have not yet embraced this technology. Inadequate computer hardware/soft- ware and high imagery costs no longer constrain rangeland appli- cation of satellite technology. A lack of remote sensing training in range managers seems to be the only critical limitation to adoption of satellite-based rangeland management tools.
To address the need for accurate, up-to-date plant community maps and to facilitate in-service training in remote sensing, range J. Range Manage.
54:152–160 March 2001
Intermountain plant community classification using Landsat TM and SPOT HRV Data
PATRICK E. CLARK, MARK S. SEYFRIED, AND BOB HARRIS
Authors are range scientist and soil scientist, USDA Agricultural Research Service, 800 Park Blvd., Plaza IV, Suite 105, Boise, Ida. 83712 and remote sens- ing/GIS analyst, University of Idaho, 800 Park Blvd., Plaza IV, Suite 105, Boise, Ida. 83712.
This research was funded by USDA Agricultural Research Service and the NSF/EPA Water and Watersheds Grant Program (NSF 95-24405). Authors wish to thank S. Hardegree, K. Havstad, G. Pickup, P. Tueller, and 3 anonymous reviewers for their critical review and comments on drafts of this manuscript.
Manuscript accepted 22 May 2000.
Resumen
Las comunidades de plantas del los pastizales intermontanos del oeste difieren en su ecología y requerimientos de manejo. El manejo exitoso de áreas extensivas a nivel de resolución de comunidad de plantas, primero, requiere un medio eficiente y efectivo en términos de costos para el mapeo y clasificación de las comunidades de plantas. Evaluamos la influencia de la fecha de adquisición de imagenes y del sistema de imagen de satélite en la certeza de los mapas de comunidades de plantas creados a partir de imágenes multiespectrales de satélite de la Cuenca Hidrológica Experimental "Reynolds Creek" (RCEW) (234 km2) del suroeste de Idaho. Se crearon mapas delineando 6 comu- nidades de plantas intermontanas nativas y 2 comunidades no nativas a partir de datos de Landsat 5 TM y SPOT 3 HRV uti- lizando el procedimiento de clasificación de máxima probabili- dad. La certeza del mapa se evaluó utilizando puntos de referen- cia terrestres. La certeza de los mapas creados de datos de satélite adquiridos durante época seca ( inicios de Agosto) tuvieron una certeza general más alta (x– = 70.5%) que los datos adquiridos durante el pico de crecimiento de las plantas (inicios de Junio) (x– = 54.4%). La certeza general de los mapas genera- dos por Landsat (x– = 60.1%) y SPOT (x– = 65.5%) fueron estadís- ticamente similares. Dada su amplia cobertura espacial (3,600 a 31,450 km2 escena-1, respectivamente), resoluciones moderadas (20 a 30 m por pixel respectivamente) y el potencial para proveer certezas de clasificación altas, los sistemas de satélites SPOT 3 HRV y Lansat 5 TM fueron apropiados para clasificar las comu- nidades de plantas en la Cuenca Hidrológica "Reynolds Creek"
y áreas similares de la región intermontana del oeste. Se presen- tan procedimientos prácticos para evaluar la certeza de la clasifi- cación y mapeo de las comunidades de plantas para el uso por manejadores de recursos naturales.
managers in the Intermountain region need a set of practical procedures for plant com- munity classification and mapping using multispectral satellite imagery. Objectives of this study were to: (1) compare the accuracy of 2 satellite remote sensing sys- tems, Landsat 5 TM and SPOT 3 HRV, for Intermountain plant community classi- fication, 2) evaluate the effects of imagery acquisition date on Intermountain plant community classification accuracy, and 3) present a set of practical procedures and recommendations for use by range man- agers to classify and map Intermountain plant communities using satellite imagery.
Materials and Methods
Study Area
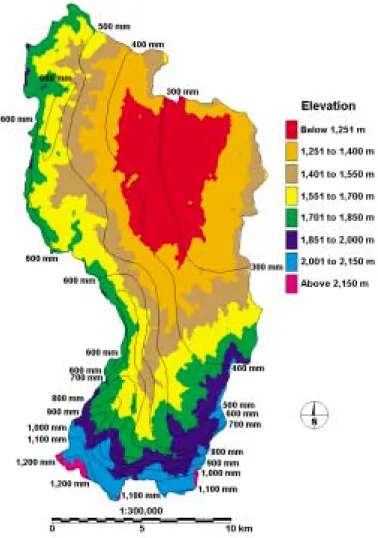
The study was conducted in the Reynolds Creek Experimental Watershed (RCEW) located 80 km south of Boise in southwestern Idaho (43° 11' N, 116° 46' W). The RCEW is 234 km2in extent and ranges in elevation from 1,097 m to 2,252 m (Fig. 1). The area is typical of the shrub steppe and subalpine rangelands occurring throughout the Intermountain region. Mean annual precipitation at the Watershed ranges from 250 mm at lower elevations to 1,270 mm at higher elevations but is also affected by position relative to incoming storms. Locations on the western side of the Watershed receive about 1.5 times more precipitation than those on the east- ern side at the same elevation. About 75%
of the precipitation in the higher elevations falls as snow. Summers are very dry throughout the Watershed.
Soils in the Reynolds Creek Watershed are derived primarily from basalt (63% of the Watershed), granite (18%), alluvi- um/lacustrine sediments (12%) and weld- ed tuff (6%) (Stephenson 1977). Aridisols dominate the lowest elevations and Mollisols are most common elsewhere.
Soils derived from granite are generally in coarse-loamy families and the others are generally in fine loamy families. Except in valley bottoms and snow drift areas, soils are shallow, rocky and steep.
Wyoming big sagebrush (Artemisia tri- dentata Nutt. ssp. wyomingensis Beetle and Young) and salt desert shrub are the dominant native plant communities in the lower elevations (< 1,400 m) of the Watershed. Principal species in the Wyoming big sagebrush community are Wyoming big sagebrush, bluebunch wheatgrass (Pseudoroegneria spicata [Pursh] A. Löve), and Sandberg bluegrass (Poa secunda J. Presl.) (Spaeth et al.
2000). Greasewood (Sarcobatus vermicu- latus [Hook.] Torr.), bud sagebrush (Picrothamnus desertorum Nutt.), spiny hopsage (Grayia spinosa [Hook.] Moq.), and squirreltail (Elymus elymoides [Raf.]
Swezey) dominate the salt desert shrub community. Cultivated hay fields and Siberian wheatgrass (Agropyron fragile [Roth] P. Candargy) seedings also occur in the lower elevations of the Watershed. The hay fields are primarily flood-irrigated fields of orchardgrass (Dactylis glomerata L.). The Siberian wheatgrass seedings were degraded stands from the Wyoming big sagebrush and salt desert shrub com- munities which were prescribed burned and seeded to Siberian wheatgrass in 1984.
Low sagebrush and big sagebrush/bitter- brush plant communities are the dominant vegetation in the mid elevations (1,400 m to 1,600 m). Low sagebrush (Artemisia arbuscula Nutt.), Sandberg bluegrass, and arcane milkvetch (Astragalus obscurus S.
Wats.) are the principal species of the low sagebrush community (Spaeth et al. 2000).
Wyoming big sagebrush, antelope bitter-
brush (Purshia tridentata [Pursh] DC.), bluebunch wheatgrass, and Idaho fescue (Festuca idahoensis Elmer) dominate the big sagebrush/bitterbrush community.
Mountain big sagebrush, aspen, and mixed-conifer are the dominant plant com- munities in the higher elevations (> 1,600 m). The principal species in the mountain big sagebrush community are mountain big sagebrush (Artemisia tridentata Nutt.
ssp. vaseyana [Rydb.] Beetle), mountain snowberry (Symphoricarpos oreophilus Gray), mountain brome (Bromus margina- tus Nees ex Steud.), elk sedge (Carex gar- beri Fern.), lupine (Lupinus L.), and sticky cinquefoil (Potentilla glandulosa Lindl.) (Spaeth et al. 2000). The aspen communi- ty is characterized by a tree overstory of quaking aspen (Populus tremuloides Michx.) and an herbaceous understory of mountain brome, western needlegrass (Achnatherum occidentale [Thurb. ex S.
Wats.] Barkworth), Kentucky bluegrass (Poa pratensis L.), veiny meadowrue (Thalictrum venulosum Trel.), and moun- tain sweetroot (Osmorhiza chilensis H. &
Fig. 1. Elevation (shaded polygons) and annual precipitation (line contours) of Reynolds Creek Experimental Watershed in southwestern Idaho.
A.). Douglas- fir (Pseudotsuga menziesii [Mirbel] Franco) and subalpine fir (Abies lasiocarpa [Hook.] Nutt.) form the tree overstory of the mixed-conifer communi- ty. Western needlegrass, elk sedge, veiny meadowrue, and mountain sweetroot occur as a sparse understory.
Satellite Data and Preprocessing Levels
Landsat 5 TM scenes acquired 6 June 1996 and 1 August 1993 were purchased from Space Imaging1 (formerly EOSAT Corp., Thornton, Colo.). The SPOT 3 HRV scenes acquired 17 June 1993 and 16 August 1994 were purchased from SPOT Image Corp.1 (Reston, Virg.). Landsat 5 TM acquires data in 3 visible bands, blue (0.45 to 0.52 m), green (0.52 to 0.60 m), and red (0.63 to 0.69 m), 1 near-infrared band (0.76 to 0.90 m), 2 mid-infrared bands (1.55 to1.75 and 2.08 to 2.35 m), and 1 thermal infrared band (10.4 to 12.5 m) of the electromagnetic spectrum.
Landsat 5 TM stores data from the visible, near-infrared and mid-infrared bands as 30-m pixels with 8-bit radiometric resolu- tion (256 brightness levels). Landsat 5 TM stores thermal infrared data as 120-m pix- els. Landsat 5 has a sun-synchronous, near-polar orbit with a 16-day repeat cycle. The ground swath width of the Landsat 5 TM is 185 km and Landsat scenes are 185 km by 170 km (31,450 km2) in size.
The SPOT 3 HRV acquires data in 2 visible bands, green (0.50 to 0.59 m) and red (0.61 to 0.68 m) and 1 near-infrared band (0.79 to 0.89 m) of the spectrum. The SPOT 3 HRV color and near-infrared imagery are stored as 20-m pixels with 8- bit radiometric resolution. The SPOT 3 HRV also has a panchromatic band with a 10-m pixel size. The SPOT 3 has a sun- synchronous, near-polar orbit with a 26- day orbit cycle. Pointable optics on SPOT 3 permit off-nadir viewing which can decrease the time intervals between view- ing opportunities. The SPOT 3 HRV scenes are 60 km by 60 km (3,600 km2) in size. The Landsat and SPOT scenes used in this study were cloud-free and had been radiometrically- and geometrically-cor- rected (Level 1B data) by the vendor. A subscene representing the areal coverage of the Reynolds Creek Watershed (RCEW) was extracted from each scene using an image processing software pack-
age (PCI, Richmond Hill, Ontario, Canada). These subscenes were precision- corrected (georectified) using ground con- trol points located with a GPS but were not terrain-corrected.
Plant Community Classification The primary objective of image classifi- cation is to place all pixels in an image into discrete vegetation cover classes.
Vegetation cover classification is based on recognition of spatial, temporal, or spec- tral patterns in multispectral imagery.
Spectral pattern recognition is the most commonly used form. Different vegetation cover types have different combinations of spectral reflectance and emittance proper- ties. These spectral patterns are captured on multispectral imagery and manifested as different combinations of digital num- bers (DN), thus, providing a numerical basis for vegetation cover type classifica- tion (Lillesand and Kiefer 1994).
There are 2 spectral pattern-based meth- ods, supervised and unsupervised classifi- cation, commonly used for vegetation cover type classification (Lillesand and Kiefer 1994). In the supervised approach, the vegetation cover types to be mapped as classes are specified initially. Spectral sig- natures for each of these classes are gener- ated from spectral information acquired from imagery pixels corresponding to field sites representative of each class. These sites are called training areas. Classifier algorithms then statistically compare each image pixel to these spectral signatures and assign the pixel to the cover class it most closely resembles. In the unsupervised approach, clustering algorithms are used to aggregate image pixels into spectrally sep- arable classes. The vegetation cover type associated with each class is determined a posteriori by comparing the classified image data to ground reference data.
Although rangeland vegetation can be successfully classified using either super- vised or unsupervised classification (Tueller 1989), both involve a certain amount of trial and error before a satisfac- tory result is obtained. An approach which combines both classification methods can often be more efficient. Range managers are typically aware of the dominant vege- tation cover types on a landscape of inter- est and would include these as classes in a supervised classification. Failure to recog- nize and include other spectrally-separable cover classes will, however, inflate the number of unclassified or misclassified pixels resulting from a supervised classifi- cation. By initially applying an unsuper- vised classification to the imagery data set,
these other cover classes can be identified and included in a subsequent supervised classification.
In this study, an unsupervised classifica- tion (K-means clustering) was initially applied to the Landsat and SPOT sub- scenes. Although the spectral classes gen- erated by the initial run of K-means clus- tering procedure did not exhibit an obvi- ous spatial relationship with the native plant communities or cultivated grass hay fields known to be present in the Reynolds Creek Watershed, application of this unsu- pervised classification identified the need to include the burned and seeded area as a separate class in the supervised classifica- tion described below.
Classifier training areas were estab- lished in the 9 dominant plant communi- ties, including 7 native communities (salt desert shrub, Wyoming big sagebrush, big sagebrush/bitterbrush, low sagebrush, mountain big sagebrush, aspen, and mixed-conifer) and 2 non-native commu- nities (cultivated grass hay and Siberian wheatgrass), occurring in the Watershed.
Selection of these 9 communities was based on information gathered from field survey, existing vegetation maps of the Reynolds Creek Watershed, and rangeland cover type descriptions published in Shiflet (1994). Riparian, mountain mead- ow and other plant communities of small spatial extent were not included in order to simplify the analysis and reduce classifica- tion errors associated with mixed pixels (see discussion below). To ensure the training areas were representative of the vegetation on the Watershed, 4 to 5 train- ing areas were established in each plant community. These training areas were located on relatively flat terrain to mini- mize topography-induced effects on the reflectance values of the imagery.
Training areas were established within large patches of relatively homogenous vegetation from each respective plant community. Inclusion of non-target cover types within the training areas was avoid- ed. A Global Positioning System (GPS) with a horizontal accuracy of ± 2 m was used to establish the training area perime- ter ≥ 30 m (i.e., a Landsat pixel width) interior to the edge of the patch. This 30-m buffer zone around each training area helped minimize inclusion of mixed pixels (pixels which span more than 1 plant com- munity). Each training area was at least 5.4 ha in size or large enough to contain at least sixty, 30-m pixels. This minimum size criteria for training areas is based on the following equation:
P = (5(n2 + n)) (1)
1Mention of manufactures or trade names is for the convenience of the reader only and implies no endorsement on the part of the authors, USDA, or University of Idaho.
where P is the minimum number of image pixels required per training area and n is the number of spectral bands to be used in the classification (PCI 1998). In this case, 3 spectral bands were used (see below). A training area of adequate size could not be established in the salt desert shrub com- munity, however, without obtaining some inclusions of the Wyoming big sagebrush community. Impure salt desert shrub train- ing areas probably contributed to classifi- cation errors between this community and the Wyoming big sagebrush community.
A bitmap image mask of each training area was generated with an image-process- ing software package (PCI, Richmond Hill, Ontario, Canada) using the perimeter coordinates obtained from the GPS sur- vey. Four sets of spectral signatures for each training area were developed (1 for each satellite system/date combination) using green, red, and near-infrared reflectance data from image pixels located under the corresponding image masks.
The green, red, and near-infrared combi- nation was used because preliminary experimentation with different band com- binations indicated this combination would provide the best image classifica- tion for these data sets. To ensure good statistical representation of the spectral characteristics of each plant community, spectral signatures from 2 to 3 training areas per community were merged to form a single signature per community.
Selection of the spectral signatures to be merged was based on their separability from signatures of other plant communi- ties. Signature separability was analyzed using a transformed divergence procedure (Swain and Davis 1978). Transformed divergence values theoretically range from 0 to 2. A value of 0 indicates the spectral signatures from a pair of classes are com- pletely inseparable and a value of 2 indi- cates complete separability. Transformed divergence values below 1.9 tend to be poorly separable. The signature separabili- ty between the salt desert shrub and Wyoming big sagebrush plant communi- ties was very poor for all training areas.
Transformed divergence values comparing the spectral signatures of these 2 commu- nities ranged from 1.09 to 1.76 depending on which of the 4 date/system image com- binations was used. Consequently, the salt desert shrub community was not treated as a separate class in successive analyses.
Merged signatures were generated from all 4 satellite images using the same training area combinations for the 8 remaining plant communities.
The Gaussian maximum likelihood clas- sifier was used to classify the pixels from each subscene into 8 plant community classes based on their spectral signatures.
The maximum likelihood classifier typi- cally provides higher classification accura- cy than the other 2 commonly used super- vised classification techniques; minimum- distance-to-means and parallelepiped.
Although the maximum likelihood classi- fier is much more computationally com- plex than the other 2 classifiers, recent advances in computer hardware have essentially nullified this disadvantage.
Initial evaluation of the 4 resultant clas- sification maps revealed that some high elevation pixels had been classified as cul- tivated land. Cultivated land in the study area was actually localized around the lower reaches of Reynolds Creek and its larger tributaries. The classifier appeared to be confusing aspen stands and mountain meadows at high elevations with cultivat- ed land. A simple correction model was applied to the maps, reassigning cultivated land pixels of greater than a threshold ele- vation to the aspen class. Mountain mead- ows were not mapped as a separate class because they occupied only an extremely small fraction of the study area.
Accuracy Assessment
There are several measures commonly used to assess vegetation cover type clas- sification accuracy. Overall accuracy is a percentage of reference pixels from all cover types which were correctly classi- fied. Overall accuracy is essentially a weighted mean of all individual cover type accuracies. Producer accuracy is a per- centage of reference pixels representing a specific cover type which were correctly classified to that cover type. Errors of omission (exclusion) decrease producer accuracy. Producer accuracy is commonly used as an indicator of training area quali- ty during map product development (Lillesand and Kiefer 1994). User accura- cy indicates the percentage of pixels clas- sified to a specific cover type when they truly represent that cover type. Errors of commission (inclusion) decrease user accuracy. When a range manager identi- fies a feature mapped as a specific cover type, the user accuracy indicates the likeli- hood that feature truly has the same cover type in the field. Consequently, user accu- racy is commonly used to express the accuracy of cover type map products.
Accuracy comparisons in this study were based on user accuracy values.
Two ground truth data sets were collect- ed to assess the accuracy of the 4 vegeta- tion maps (Fig. 2 to 5). An initial map accuracy assessment was performed using a 1 by 2-km grid of reference points estab- lished across the Watershed by field visits with a GPS. This grid contained a total of 146 points. Of those, 46 points were dis- carded either because they were located on small patches (< 3 by 3 pixels) of a target plant community or on a plant community we were not evaluating (e.g., Juniper Woodland). The remaining 100 points provided data representative of the areal extent of those plant communities found in the Watershed. This data set was used to evaluate acquisition date and satellite sys- tem effects on vegetation map accuracy.
Because of small sample sizes in some plant communities, this initial accuracy comparison between maps was limited to the 4 plant communities having the great- est land cover in the Watershed: (1) Wyoming big sagebrush, (2) low sage- brush, (3) big sagebrush/bitterbrush, and (4) mountain big sagebrush.
The second ground truth data set was developed so that the classification accura- cy for all 8 plant communities investigated in the Watershed could be assessed. Thirty sample points from each of the 8 commu- nities were randomly selected from the map exhibiting the highest initial accura- cy. Each of these 240 sample points was classified to a reference plant community by interpretation of 1:12,000 scale color-
Table 1. Main effects and interactions, with their respective p-values, for user accuracy of plant community maps created using Landsat 5 TM and SPOT 3 HRV multispec- tral data acquired during peak vegetation growth (June) and late summer dry-down (August) in the Reynolds Creek Experimental Watershed in southwestern Idaho.
Main Effects Degrees of
and Interactions Freedom P-Values
S1,2 1 0.4816
D2 1 0.04503
C 3 0.3545
S*D2 1 0.1672
S*C 3 0.1750
D*C 3 0.3123
1S = Satellite system, D = Acquisition date, and C = Plant community (Wyoming big sagebrush, big sage- brush/bitterbrush, low sagebrush, and mountain big sage- brush).
2Effects of satellite system, acquisition date and their interaction were calculated based on means which were weighted by sample size while plant community effects and interactions were calculated based on unweighted means.
3P-values < 0.05 are printed in bold face
infrared aerial photography acquired 1 August 1987. Accuracy of the aerial pho- tograph interpretation was assumed to be 100%. Field visits to a 10% sample of ref- erence points from each class confirmed this assumption. This type of intensive accuracy assessment was only applied to the map with the highest initial accuracy because it was not logistically feasible to establish a new set of 240 reference points for each of the other 3 maps.
Statistical Analysis
The effects of acquisition date, satellite system, and their interaction were exam- ined using a weighted General Linear Model (GLM) procedure (SAS 1988) (Table 1). Weighting allowed calculation of mean overall accuracies for the acquisi- tion date and satellite system comparisons.
Weighting was based on the number of reference points located in each plant community class. The effect of plant com- munity and its interactions with acquisi- tion date and/or satellite system were ana-
lyzed using an unweighted GLM proce- dure. Where significant effects were detected, Fisher’s Least Significant Difference (LSD) procedure was used for mean separations at a 5% level of signifi- cance. The scope of inference for this study is limited to the Reynolds Creek Experimental Watershed.
Results and Discussion
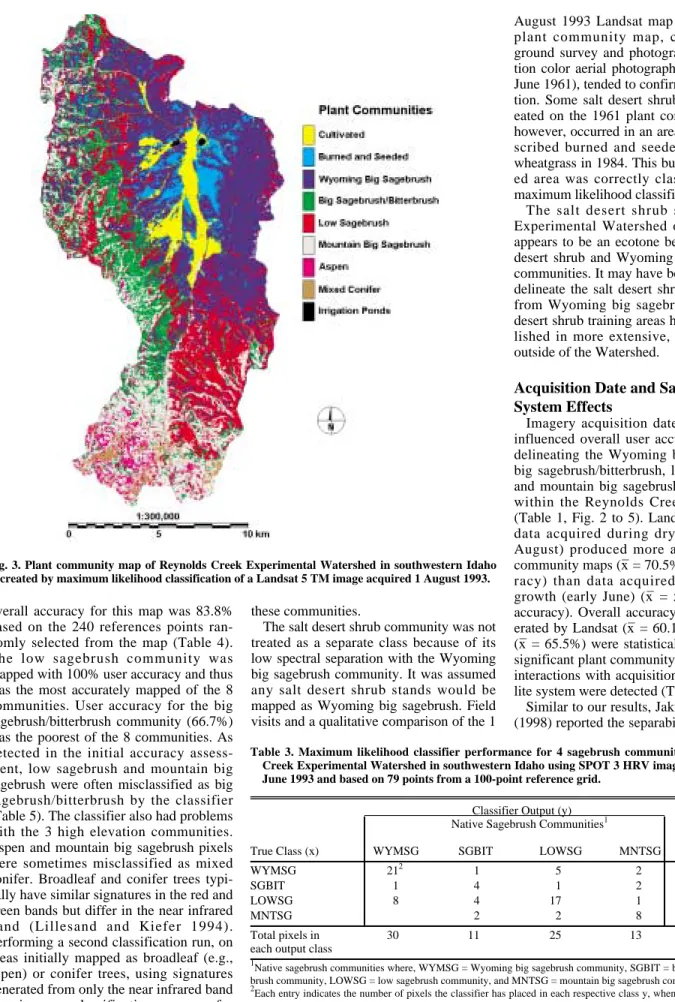
Plant Community Map Accuracy Maximum likelihood classification of Landsat data acquired during dry-down (1 August 1993) produced a highly accurate map (73.6% overall accuracy) of the Wyoming big sagebrush, big sagebrush/bit- terbrush, low sagebrush, and mountain big sagebrush communities in the Watershed (Fig. 3, Table 2). The low sage community (82.6% user accuracy) tended to be the most accurately mapped while the big sage- brush/bitterbrush community (64.3% user accuracy) tended to be the least accurately mapped of these 4 plant communities.
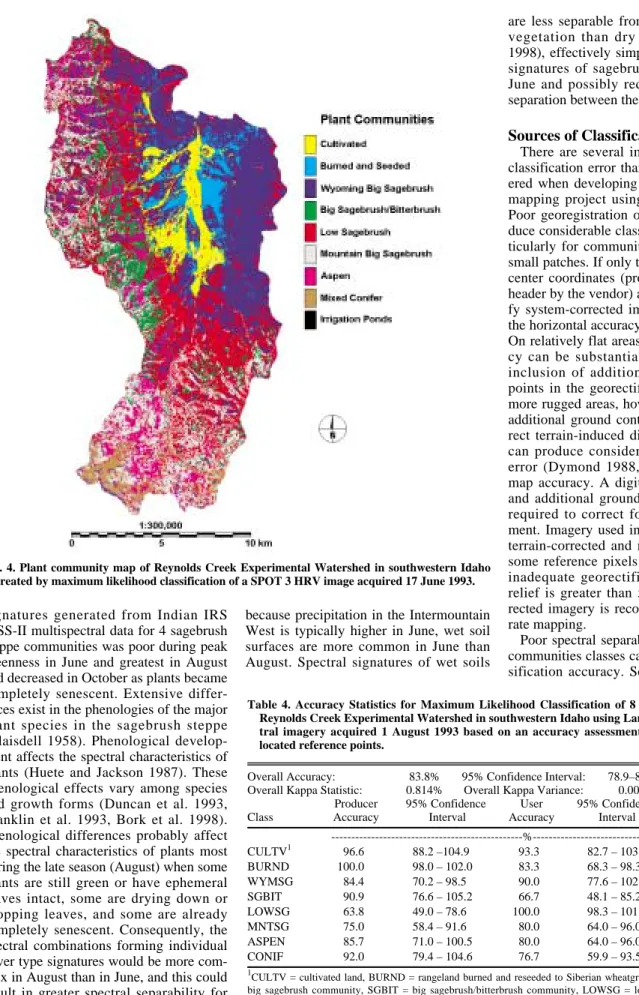
Low sagebrush and mountain big sage- brush communities were often misclassi- fied as the big sagebrush/bitterbrush com- munity in maps from all 4 date/system combinations, particularly in the SPOT 17 June 1993 map (Fig. 4, Table 3). The spectral separability between low sage- brush and big sagebrush/bitterbrush was poor to very poor. Transformed diver- gence values comparing the spectral signa- tures of these 2 communities ranged from 1.38 to 1.89 depending on which of the 4 date/system image combinations was used.
Mountain big sagebrush and big sage- brush/bitterbrush exhibited poor separabil- ity (TD value = 1.83) when the 1 August 1993 Landsat data were used. In the Watershed, bitterbrush can occur as wide- ly-scattered plants within low sagebrush and mountain sagebrush communities, particularly on ecotone sites. Bitterbrush may have a dominate spectral signature which confuses the classifier even when bitterbrush cover is very low.
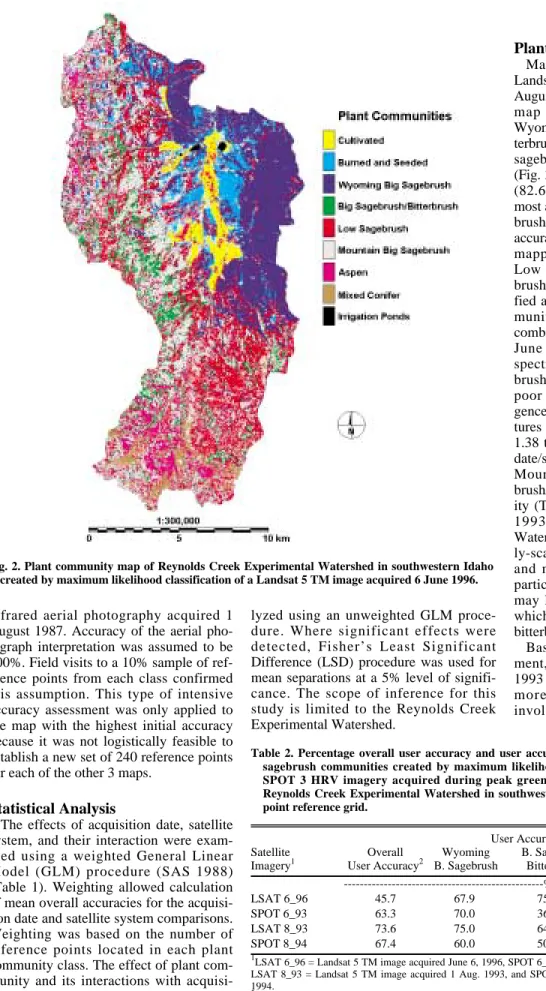
Based on this initial accuracy assess- ment, the most accurate map (1 August 1993 Landsat map) was selected for the more intensive accuracy assessment involving all 8 plant communities. The Fig. 2. Plant community map of Reynolds Creek Experimental Watershed in southwestern Idaho
created by maximum likelihood classification of a Landsat 5 TM image acquired 6 June 1996.
Table 2. Percentage overall user accuracy and user accuracy by plant community for maps of 4 sagebrush communities created by maximum likelihood classification of Landsat 5 TM and SPOT 3 HRV imagery acquired during peak greenness (June) and dry down (August) at Reynolds Creek Experimental Watershed in southwestern Idaho based on 79 points from 100- point reference grid.
User Accuracy by Plant Community
Satellite Overall Wyoming B. Sagebrush Low Mountain
Imagery1 User Accuracy2 B. Sagebrush Bitterbrush Sagebrush B. Sagebrush ---%---
LSAT 6_96 45.7 67.9 75.0 48.0 12.5
SPOT 6_93 63.3 70.0 36.4 68.0 61.5
LSAT 8_93 73.6 75.0 64.3 82.6 66.7
SPOT 8_94 67.4 60.0 50.0 85.7 76.9
1LSAT 6_96 = Landsat 5 TM image acquired June 6, 1996, SPOT 6_93 = SPOT 3 HRV image acquired 17 June 1993, LSAT 8_93 = Landsat 5 TM image acquired 1 Aug. 1993, and SPOT 8_94 = SPOT 3 HRV image acquired16 Aug.
1994.
2Weighted mean user accuracy
overall accuracy for this map was 83.8%
based on the 240 references points ran- domly selected from the map (Table 4).
The low sagebrush community was mapped with 100% user accuracy and thus was the most accurately mapped of the 8 communities. User accuracy for the big sagebrush/bitterbrush community (66.7%) was the poorest of the 8 communities. As detected in the initial accuracy assess- ment, low sagebrush and mountain big sagebrush were often misclassified as big sagebrush/bitterbrush by the classifier (Table 5). The classifier also had problems with the 3 high elevation communities.
Aspen and mountain big sagebrush pixels were sometimes misclassified as mixed conifer. Broadleaf and conifer trees typi- cally have similar signatures in the red and green bands but differ in the near infrared band (Lillesand and Kiefer 1994).
Performing a second classification run, on areas initially mapped as broadleaf (e.g., aspen) or conifer trees, using signatures generated from only the near infrared band may improve classification accuracy for
these communities.
The salt desert shrub community was not treated as a separate class because of its low spectral separation with the Wyoming big sagebrush community. It was assumed any salt desert shrub stands would be mapped as Wyoming big sagebrush. Field visits and a qualitative comparison of the 1
August 1993 Landsat map with an older plant community map, created using ground survey and photograph interpreta- tion color aerial photographs (acquired 11 June 1961), tended to confirm this assump- tion. Some salt desert shrub stands delin- eated on the 1961 plant community map, however, occurred in an area that was pre- scribed burned and seeded to Siberian wheatgrass in 1984. This burned and seed- ed area was correctly classified by the maximum likelihood classifier.
The salt desert shrub stands in the Experimental Watershed occur in what appears to be an ecotone between the salt desert shrub and Wyoming big sagebrush communities. It may have been possible to delineate the salt desert shrub community from Wyoming big sagebrush if the salt desert shrub training areas had been estab- lished in more extensive, “pure” stands outside of the Watershed.
Acquisition Date and Satellite System Effects
Imagery acquisition date significantly influenced overall user accuracy of maps delineating the Wyoming big sagebrush, big sagebrush/bitterbrush, low sagebrush, and mountain big sagebrush communities within the Reynolds Creek Watershed (Table 1, Fig. 2 to 5). Landsat and SPOT data acquired during dry-down (early August) produced more accurate plant community maps (x– = 70.5% overall accu- racy) than data acquired during peak growth (early June) (x– = 54.4% overall accuracy). Overall accuracy of maps gen- erated by Landsat (x– = 60.1%) and SPOT (x– = 65.5%) were statistically similar. No significant plant community main effect or interactions with acquisition date or satel- lite system were detected (Table 1).
Similar to our results, Jakubauskas et al.
(1998) reported the separability of spectral Fig. 3. Plant community map of Reynolds Creek Experimental Watershed in southwestern Idaho
created by maximum likelihood classification of a Landsat 5 TM image acquired 1 August 1993.
Table 3. Maximum likelihood classifier performance for 4 sagebrush communities in Reynolds Creek Experimental Watershed in southwestern Idaho using SPOT 3 HRV imagery acquired 17 June 1993 and based on 79 points from a 100-point reference grid.
Classifier Output (y) Native Sagebrush Communities1
Total pixels in
True Class (x) WYMSG SGBIT LOWSG MNTSG each true class
WYMSG 212 1 5 2 29
SGBIT 1 4 1 2 8
LOWSG 8 4 17 1 30
MNTSG 2 2 8 12
Total pixels in 30 11 25 13 79
each output class
1Native sagebrush communities where, WYMSG = Wyoming big sagebrush community, SGBIT = big sagebrush/bitter- brush community, LOWSG = low sagebrush community, and MNTSG = mountain big sagebrush community 2Each entry indicates the number of pixels the classifier has placed in each respective class y, when in fact they belong to true class x.
signatures generated from Indian IRS LISS-II multispectral data for 4 sagebrush steppe communities was poor during peak greenness in June and greatest in August and decreased in October as plants became completely senescent. Extensive differ- ences exist in the phenologies of the major plant species in the sagebrush steppe (Blaisdell 1958). Phenological develop- ment affects the spectral characteristics of plants (Huete and Jackson 1987). These phenological effects vary among species and growth forms (Duncan et al. 1993, Franklin et al. 1993, Bork et al. 1998).
Phenological differences probably affect the spectral characteristics of plants most during the late season (August) when some plants are still green or have ephemeral leaves intact, some are drying down or dropping leaves, and some are already completely senescent. Consequently, the spectral combinations forming individual cover type signatures would be more com- plex in August than in June, and this could result in greater spectral separability for some cover types in August. Additionally,
because precipitation in the Intermountain West is typically higher in June, wet soil surfaces are more common in June than August. Spectral signatures of wet soils
are less separable from sagebrush steppe vegetation than dry soils (Bork et al.
1998), effectively simplifying the spectral signatures of sagebrush communities in June and possibly reducing the spectral separation between these communities.
Sources of Classification Error There are several important sources of classification error than should be consid- ered when developing a plant community mapping project using satellite imagery.
Poor georegistration of imagery can pro- duce considerable classification error, par- ticularly for communities which occur as small patches. If only the scene corner and center coordinates (provided in the scene header by the vendor) are used to georecti- fy system-corrected imagery (Level 1-B), the horizontal accuracy would be ± 250 m.
On relatively flat areas, horizontal accura- cy can be substantially increased with inclusion of additional ground control points in the georectification process. In more rugged areas, however, it is unlikely additional ground control points will cor- rect terrain-induced displacements which can produce considerable classification error (Dymond 1988, 1992) and reduce map accuracy. A digital elevation model and additional ground control points are required to correct for terrain displace- ment. Imagery used in this study was not terrain-corrected and misclassification of some reference pixels was clearly due to inadequate georectification. Where the relief is greater than 500 m, terrain-cor- rected imagery is recommended for accu- rate mapping.
Poor spectral separability between plant communities classes can lead to poor clas- sification accuracy. Selection of training
Table 4. Accuracy Statistics for Maximum Likelihood Classification of 8 plant communities in Reynolds Creek Experimental Watershed in southwestern Idaho using Landsat 5 TM multispec- tral imagery acquired 1 August 1993 based on an accuracy assessment using 240 randomly located reference points.
Overall Accuracy: 83.8% 95% Confidence Interval: 78.9–88.6%
Overall Kappa Statistic: 0.814% Overall Kappa Variance: 0.001%
Producer 95% Confidence User 95% Confidence Kappa
Class Accuracy Interval Accuracy Interval Statistic
---%---
CULTV1 96.6 88.2 –104.9 93.3 82.7 – 103.9 0.92
BURND 100.0 98.0 – 102.0 83.3 68.3 – 98.3 0.81
WYMSG 84.4 70.2 – 98.5 90.0 77.6 – 102.4 0.88
SGBIT 90.9 76.6 – 105.2 66.7 48.1 – 85.2 0.63
LOWSG 63.8 49.0 – 78.6 100.0 98.3 – 101.7 1.00
MNTSG 75.0 58.4 – 91.6 80.0 64.0 – 96.0 0.77
ASPEN 85.7 71.0 – 100.5 80.0 64.0 – 96.0 0.77
CONIF 92.0 79.4 – 104.6 76.7 59.9 – 93.5 0.74
1CULTV = cultivated land, BURND = rangeland burned and reseeded to Siberian wheatgrass, WYMSG = Wyoming big sagebrush community, SGBIT = big sagebrush/bitterbrush community, LOWSG = low sagebrush community, MNTSG = mountain sagebrush community, ASPEN = aspen community, and CONIF = mixed conifer community.
Fig. 4. Plant community map of Reynolds Creek Experimental Watershed in southwestern Idaho created by maximum likelihood classification of a SPOT 3 HRV image acquired 17 June 1993.
areas with more homogenous cover may improve class separability. Improvement of classification accuracy, however, may require combining of poorly separable classes into a single class as was done with the Wyoming big sagebrush and salt desert shrub communities.
Mixed pixels can also contribute to clas- sification error. Mixed pixels are common along distinct patch boundaries. Riparian areas are good examples of where classifi- cation errors due to mixed pixels may occur. In arid and semi-arid rangeland there is typically a distinct boundary
between low productivity vegetation in the uplands and higher productivity vegetation in the riparian areas. Riparian areas of rangeland streams are typically narrow, often narrower than a Landsat or SPOT image pixel. Imagery of the riparian areas, consequently, will nearly always have pix- els which contain spectral information from a combination of both riparian and adjacent upland vegetation. Because of this mixture of spectral information, the classifier may misclassify these pixels to a third class which may be completely out of place both, spatially or ecologically.
The presence of spatially-broad ecotones and unclassified intermediate cover types can also result in mapping errors. As in conventional mapping techniques, cover types which grade into each other across a broad area make it difficult to delineate boundary lines.
Practical Considerations
Landsat TM and SPOT HRV scenes acquired in August proved useful for accu- rately mapping Intermountain plant com- munities within the Reynold Creek Watershed. Although the probability of obtaining a cloud-free image of Intermountain rangeland is likely better during August than any other month of the year, it still may be difficult to obtain a cloud-free Landsat image during that time period because the 16-day orbit cycle of the Landsat system limits opportunities. If a current-year scene is desired (e.g., to map plant communities following a wild- fire), the pointable optics of the SPOT sys- tem provide more opportunities to obtain a cloud-free August scene than Landsat. For example, a point at 45° latitude can have as many as 11 viewing opportunities with- in the 26-day SPOT orbit cycle via off- nadir viewing (Lillesand and Kiefer 1994).
Use of SPOT imagery acquired through
Table 5. Maximum Likelihood classifier performance for 8 plant communities in Reynolds Creek Experimental Watershed in southwestern Idaho using Landsat 5 TM multispectral imagery acquired 1 August 1993 based on an accuracy assessment using 240 randomly located reference points.
Classifier Output (y)
Total pixels in
True Class (x) CULTV BURND WYMSG SGBIT LOWSG MNTSG ASPEN CONIF each true class
CULTV1 282 1 29
BURND 25 25
WYMSG 2 3 27 32
SGBIT 1 20 1 22
LOWSG 1 3 6 30 2 4 1 47
MNTSG 4 24 1 3 32
ASPEN 1 24 3 28
CONIF 1 1 23 25
Total pixels in 30 30 30 30 30 30 30 30 240
each output class
1CULTV = cultivated land, BURND = rangeland burned and reseeded to Siberian wheatgrass, WYMSG = Wyoming big sagebrush community, SGBIT = big sagebrush/bitterbrush community, LOWSG = low sagebrush community, MNTSG = mountain big sagebrush community, ASPEN = aspen community, and CONIF = mixed conifer community.
2Each entry indicates the number of pixels the classifier has placed in each respective class y, when in fact they belong to true class x.
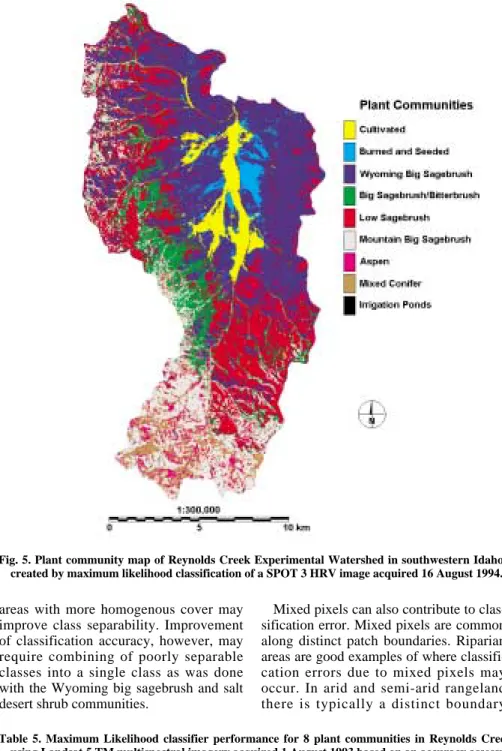
Fig. 5. Plant community map of Reynolds Creek Experimental Watershed in southwestern Idaho created by maximum likelihood classification of a SPOT 3 HRV image acquired 16 August 1994.
off-nadir viewing, however, increases the complexity and potential for problems in image correction and calibration (Royer et al. 1985, Gerstl and Simmer 1986, Moran et al. 1990, Franklin and Giles 1995) and may decrease classification accuracy (Foody 1988).
Landsat data may be more economical than SPOT for resource management applications, particularly for U.S. federal agencies. Landsat scenes are much larger than SPOT scenes (31,450 km2compared 3,600 km2, respectively), thus, an area of interest is more likely to be completely covered on a single Landsat scene than on a single SPOT scene. At the time of this writing, systematic-, precision-, and ter- rain-corrected SPOT scenes were available from SPOT Image Corp. (Reston, Virg.).
System-, precision-, and terrain-corrected Landsat scenes were commercially avail- able from Space Imaging Corp. (Thornton, Colorado) and cost less per km2than com- parable SPOT scenes. System-corrected Landsat scenes acquired prior to or on 28 October 1992 could be purchased by the public from USGS Earth Resources Observation Systems (EROS) Data Center (Sioux Falls, S.D,) at substantially lower cost than from the commercial vendor. For U.S. federal agencies only, the USGS EROS Data Center also provided preci- sion- and terrain-corrected Landsat scenes for much lower than the commercial cost.
Landsat 7 ETM+ was launched 15 April 1999 to continue the missions of the high- ly successful Landsat 4 and 5 TM sensors.
Landsat 7 ETM+ samples essentially the same 7 bandwidths as Landsat 4 and 5, however, a panchromatic band product (15 m) was also provided. Landsat 7 ETM+
systematic-, precision-, and terrain-cor- rected scenes were available to the public from the USGS EROS Data Center in Sioux Fall, S.D. A principle objective of the Landsat 7 project was to provide satel- lite data products to users at cost, a consid- erable savings over the commercial price for other current Landsat products.
Conclusions
Although the scope of inference for this study was limited to the Reynolds Creek Experimental Watershed, these results suggest both Landsat 5 TM and SPOT 3 HRV provide multispectral data range managers can use to accurately classify and map plant communities on Intermountain rangelands similar to the Reynolds Creek Watershed. Imagery data acquired during dry-down (early August) will likely pro-
duce more accurate plant community maps than data acquired during peak growth (early June). Classification of Landsat or SPOT imagery can be a practical and eco- nomic means of mapping extensive areas (e.g., grazing allotments, large ranches, watersheds, parks and preserves, and other resource management units) common to the Intermountain West.
Literature Cited
Blaisdell, J.P. 1958. Seasonal development and yield of native plants on the Upper Snake River Plains and their relation to certain cli- matic factors. USDA Tech. Bull. 1190.
Washington, D.C..
Bork, E.W., N.E. West, K.P. Price. 1998. In situ narrow-band reflectance characteristics of cover components in sagebrush-steppe.
Geocarto Int. 13:5–15.
Duncan, J., D. Stow, J. Franklin, and A.
Hope. 1993. Assessing the relationship between spectral vegetation indices and shrub cover in the Jornada Basin, New Mexico. Int. J. Remote Sensing 14:3395–3416.
Dymond, J.R. 1988. Nonparametric modelling of radiance in hill country. Remote Sensing Environ. 25:3–21.
Dymond, J.R. 1992. Nonparametric modelling of radiance in hill country for digital classifi- cation of aerial photographs. Remote Sensing Environ. 39:95–102.
Foody, G.M. 1988. The effects of viewing geometry on image classification. Int. J.
Remote Sensing 9:1909–1915.
Franklin, J., J. Duncan, and D.L. Turner.
1993. Reflectance of vegetation and soil in Chihuahuan Desert plant communities from ground radiometry using SPOT wavebands.
Remote Sensing Environ. 46:291–304.
Franklin, S.E. and P.T. Giles. 1995.
Radiometric processing of aerial and satellite remote sensing imagery. Computer and Geosci. 21:413–423.
Gerstl, S.A.W. and C. Simmer. 1986.
Radiation physics and modelling for off- nadir satellite sensing of non-Lambertain sur- faces. Remote Sensing Environ. 20:1–29.
Graetz, R.D. and M.R. Gentle. 1982. The relationships between reflectance in the Landsat wavebands and the composition of an Australian semi-arid shrub rangeland.
Photogrammetric Eng. and Remote Sensing 48:1721–1730.
Huete, A.R. and R.D. Jackson. 1987.
Suitability of spectral indices for evaluating vegetation characteristics on arid rangelands.
Remote Sensing Environ. 23:213–232.
Jakubauskas, M., K. Kindscher, and D.
Debinski. 1998. Multitemporal characteriza- tion and mapping of montane sagebrush communities using Indian IRS LISS-II imagery. Geocarto Int. 13:65–74.
Kremer, R.G. and S.W. Running. 1993.
Community type differentiation using
NOAA/AVHRR data within a sagebrush- steppe ecosystem. Remote Sensing Environ.
46:311–318.
Lillesand, T.M. and R.W. Kiefer. 1994.
Remote sensing and image interpretation. 3rd ed. John Wiley & Sons, Inc. New York, N.Y..
Moran, M.S., R.D. Jackson, G.F. Hart, P.N.
Slater, R.J. Bartell, S.F. Biggar, D.I.
Gellman, and R.P Santer. 1990. Obtaining surface reflectance factors from atmospheric and view angle corrected SPOT-1 HRV data.
Remote Sensing Environ. 32:203–214.
PCI. 1998. Using PCI software, ver. 6.3. PCI, Ontario, Canada.
Pickup, G., G.N. Bastin, and V.H. Chewings.
1994. Remote sensing-based condition assessment for non-equilibrium rangelands under large-scale commercial grazing. Ecol.
Appl. 4:497–517.
Royer, A., P. Vincent, and F. Bonn. 1985.
Evaluation and correction of viewing angle effects on satellite measurements of bidirec- tional reflectance. Photogrammetric. Eng.
and Remote Sensing 51:1899–1914.
SAS. 1988. SAS/STAT user's guide. Version 6.03 ed. SAS Institute Inc. Cary, N.C.
Shiflet, T.N. 1994. Rangeland cover types of the United States. Society for Range Management, Denver, Colo.
Spaeth, K.E., J. Duft, and F.B. Pierson. 2000.
Flora of the Reynolds Creek Experimental Watershed. USDA-ARS, NWRC 00-1, February 2000. Northwest Watershed Research Center, Boise, Ida..
Stephenson, G.R. 1977. Soil-geology-vegeta- tion inventories for Reynolds Creek Watershed. Univ. Idaho Agr. Exp. Sta. Misc.
Series No. 42. Moscow, Ida..
Swain, P.H. and S.M. Davis. 1978. Remote Sensing: the quantitative approach. McGraw- Hill, New York, N.Y..
Tueller, P.T. 1989. Remote sensing technology for rangeland management applications. J.
Range Manage. 42:442–453.
Tueller, P.T, G. Lorain, R. Halvorson, and J.M. Ratliff. 1975. Mapping vegetation in the Great Basin from ERTS-1 imagery, pp 338–370 In: Proc. Amer. Society Photogrammetry 41stAnnual Meeting.
March, 1975. Washington D.C..