warwick.ac.uk/lib-publications
Manuscript version: Author’s Accepted Manuscript
The version presented in WRAP is the author’s accepted manuscript and may differ from the
published version or Version of Record.
Persistent WRAP URL:
http://wrap.warwick.ac.uk/125824
How to cite:
Please refer to published version for the most recent bibliographic citation information.
If a published version is known of, the repository item page linked to above, will contain
details on accessing it.
Copyright and reuse:
The Warwick Research Archive Portal (WRAP) makes this work by researchers of the
University of Warwick available open access under the following conditions.
Copyright © and all moral rights to the version of the paper presented here belong to the
individual author(s) and/or other copyright owners. To the extent reasonable and
practicable the material made available in WRAP has been checked for eligibility before
being made available.
Copies of full items can be used for personal research or study, educational, or not-for-profit
purposes without prior permission or charge. Provided that the authors, title and full
bibliographic details are credited, a hyperlink and/or URL is given for the original metadata
page and the content is not changed in any way.
Publisher’s statement:
Please refer to the repository item page, publisher’s statement section, for further
information.
Abstract— We propose a genetic algorithm (GA) based method to
improve the sampling efficiency in THz time domain spectroscopy (THz-TDS). For a typical time domain THz signal, most information are contained in a short region of the pulse which needs to be densely sampled, while the other regions fluctuating around zero can be represented by fewer points. Based on this clustering feature of the THz signal, we can use much fewer sampling points and optimize the distribution by using a GA to achieve an accurate scanning in less time. Both reflection and transmission measurements were conducted to experimentally verify the performance. The measurement results show that the sampling time can be greatly reduced while maintain very high accuracy both in time-domain and frequency-domain compared with a high-resolution step scan. This method significantly improves the measurement efficiency. It can be easily adapted to most THz-TDS systems equipped with a mechanical delay stage for fast detection and THz imaging.
Index Terms—sampling method, genetic algorithm, terahertz
I. INTRODUCTION
erahertz time-domain spectroscopy (THz-TDS) has been widely applied as an important tool to investigate material properties [1], molecular vibrations [2] and medical diagnosis [3]. In many THz-TDS systems, a femtosecond laser pulse is divided into a pump and a probe beam with one of them being delayed by an optical stage to sample a THz signal in the time-domain [4]. A numerical Fourier transform of the time-domain signal gives the frequency spectrum with both magnitude and phase information. The maximum frequency and the frequency resolution are determined by the time interval and time length, respectively. In a practical setup, usually two scanning modes, rapid scan and step scan, are implemented. The rapid scan shakes the delay stage backwards and forwards quickly and constantly in a scanning range. The actual scanning speed (i.e. number of time-domain waveforms achieved in a unit time) varies widely from different setups from several hertz to hundreds of hertz [5]. However, a very short time-constant is available for every sampled data in the rapid mode, hence resulting in a poor signal-to-noise ratio (SNR). On the contrary, the step scan mode distributes the
This work was partially supported by the Research Grants of Hong Kong (project numbers 14206717 and 14201415), the Hong Kong Innovation and Technology Fund (project number ITS/371/16). (Corresponding author: Emma Pickwell-MacPherson.)
K. Li, X. Chen are with the Department of Electronic Engineering, The Chinese University of Hong Kong, Hong Kong (e-mail: [email protected]; [email protected])
S.S, is with the Department of Systems Engineering and Engineering Management, The Chinese University of Hong Kong, Hong Kong (e-mail: [email protected])
scanning range into equal intervals according to the time-resolution. The stage stops at every sampling point for data acquisition. This allows an arbitrary long integration time to provide a favorable SNR. However, the scanning speed is greatly reduced and the efficiency is sacrificed in every acceleration and deceleration process [6].
To improve the sampling speed, several methods have been proposed. For example, asynchronous optical sampling (AOS) requires no mechanical time delay stages and avoids the compromise between the data acquisition rate and frequency resolution [7-8]. However, two expensive femtosecond lasers are needed and the mode-locked frequencies of these two lasers should be very stable, which will significantly increase the total cost of the whole system. Another technique implements a rotary optical delay line or circular involute [9-10] to replace the conventional linear stage. An updated version called fast rotary linear optical delay line (FRLODL) [11] is also possible. The repetition rate can be significantly increased but a complicated calibration is required to adapt the nonlinear rotational angles to the linear time-step. Furthermore, the reflecting blades need to be polished frequently to stay smooth [11]. Previous work from our group by He et al. introduced an adaptive sampling method [12]. It calculates the points distribution based on the clustering feature of the THz pulse and can be easily implemented in a wide range of THz-TDS systems. The speed improvement of this method is highly dependent on the clustering feature of the signal. When the scanning signal has a highly clustered distribution, the amplitudes outside the main pulse are weak, and the speed can be significantly improved. On the contrary, when the signal contains long ringing oscillations, the speed is less improved due to the larger amount of data points needed. Nevertheless, the speed improvements for different cases are mostly by a factor of 2-3. There are two further limiting factors remaining. Firstly the sectional distribution only considers the amplitude and the amplitude variation of its nearest neighbors, which does not comprehensively represent the sampling density needed. Secondly, in each section, the sampling points are still equally distributed. The scanning efficiency can be further improved by adaptively distributing according to the waveform. To do this, a
R. Zhang is with the Shenzhen Institutes of Advanced Technology, Chinese Academy of Sciences, Shenzhen, China(e-mail: [email protected]).
E. Pickwell-MacPherson is with the Department of Electronic Engineering, The Chinese University of Hong Kong, Sha Tin, Hong Kong, and the Department of Physics, University of Warwick, Gibbet Hill Road, Coventry CV4 7AL, U.K. ([email protected]).
Genetic Algorithm Based Optimization for
Terahertz Time-Domain Adaptive Sampling
Kaidi Li, Xuequan Chen, Shuaiqi Shen, Rui Zhang and Emma Pickwell-MacPherson
huge computation will be required, which may further increase the time cost.
Calculating the optimized distribution of the sampling point is a high-dimensional optimization problem, which can be well solved by a genetic algorithm (GA). A GA is a type of metaheuristic approach inspired by the process of natural selection to generate high-quality solutions for global optimization problems, introduced by John Holland [13]. GAs are sufficiently powerful to solve problems with a large number of parameters and a non-smooth objective function, to which traditional derivative-based methods cannot be applied. When a GA searches parallel to a population of points, it is able to avoid stagnation in local optimal solutions and always guarantees a global sub-optimal solution, providing a reliable and fast convergence. In this work, we apply the GA approach to adaptively sample THz signals in the time-domain without any extra hardware cost. The GA quickly determined the optimized distribution of the sampling points from a coarse rapid scan. The number of points was significantly less than that required in a normal step scan, reducing that scanning time. The system adaptively sampled the signal according to the optimized distribution using a long integration time to achieve a good SNR with much lower time cost. Water and lactose were measured to verify the accuracy and efficiency of the GA in different geometries, with water being measured in reflection and lactose being measured in transmission.
II. EXPERIMENT SETUPS
The fiber-based THz-TDS system employed in our study is the Menlo K15 equipped with a built-in PI (type: LMS-80 PI) delay stage. The stage has a 39-nm step resolution and programmable moving positions and speed.
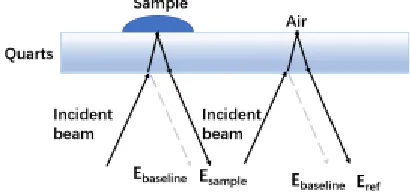
To measure a solid material such as a lactose pellet, the emitter and detector are aligned in a straight line to establish a transmission setup. To measure liquid samples, a reflection geometry is used. The schematic diagram of the reflection module is shown in Fig.1. A quartz window is placed above the THz optics. Liquids are placed on the top of the quartz window. The incident angle of the THz beam is set to be 30o to the
[image:3.612.60.265.602.698.2]bottom surface of the quartz and both reflections from the lower air-quartz and upper quartz-sample/air interfaces are detected. The upper sample and air reflections can be extracted by subtracting the lower reflection (defined as the baseline) from the detected signal and used for further sample characterization. Details about the measurement and data processing are given in our previous work [14-15].
Fig. 1. Diagram showing the reflected signal paths for the sample, reference and baseline measurements.
III. GENETIC ALGORITHM BASED ADAPTIVE SAMPLING A. Features of THz-TDS signals
The broadband and coherent THz light emitted from a photoconductive antenna or an electro-optic crystal has an ultra-short pulse width. This results in the clustering feature that most of the information is compressed in a short main pulse, while the other regions only weakly oscillate around zero. In case that the THz light interacts with an object having absorption peaks or resonances to break this coherence, such as water-vapor, lactose or resonant structures, sample-induced echoes will be generated. These echoes appear as gradually weakening oscillations after the main pulse and vanish to zero after a certain length [16-18]. Therefore, in most cases, a THz signal can be efficiently sampled because only a relatively short region needs to be scanned. However, according to the Fourier transform, the frequency resolution is decided by the signal length in the time-domain. For example, a 20ps signal without zero padding is required to provide a 50 GHz (1/20ps) spectrum resolution, while the major pulse of a typical THz signal only lasts for 3 ps. In a general step scan, as the sampling time intervals are equally distributed, most of the time is spent on the regions having weak amplitudes. A more efficient sampling can be realized by adaptively distributing denser points at the main pulse region whilst giving a sparse distribution at the other regions. In particular, the optimizing distribution should be calculated based on the actual signal profile to achieve the minimum error under a given number of sampling points. This was realized by our genetic algorithm as detailed in the following sections.
B. Pre-processing and GA-based optimization
The whole process can be separated into three parts; a. rapid scan of a coarse signal and pre-processing, b. GA optimization, and c. adaptive sampling with a long integration time.
In part a, a signal Erapid was obtained by a rapid scan which
typically takes around 1 s. We first separate the signal into sections with identical length and distribute certain number of sampling points to each section by evaluating the section significance. The ‘section’ was set to initially allocate a different number of sampling points in different regions. The length of the section is selected to be slightly shorter than the pulse length so that it can better locate the pulse region. The significance of each point p is the weighted sum of the amplitudes, the first and second:
1 1 1 1
1 2 2
+ ( ) ( )
2
p p p p p p p p
p p
E E E E E E E E
Sig E w w
t t
(1) where 𝑆𝑖𝑔 is the defined significance. 𝐸 is the time-domain electric field amplitude. Δ𝑡 is the time step. The subscript p, p-1 and p+1 are the indices of the points. The weights w1 and w2 are
practical measurement, our rapid scan signal is usually acquired in 1s, which is slower than the highest rate of 4 Hz and can normally provide SNR>45dB. The SNR of a 1s rapid scan signal is about 10dB lower than that by a step scan with time constant 30ms, which does not significantly affect the GA optimization. In case the signal is weak, a slower version of rapid scan (e.g. taking 5s) can be used to improve the SNR with little sacrifice on the overall speed.
1 1 1 1
1 2 2
( ) ( )
2
p p p p p p
p
p p p
E E E E E E
E w w
t t
(2) In the main-pulse region, most points have high amplitudes to contribute to the first term of Eq. (1). There are also points with a small amplitude but a large gradient in the main pulse region. These points contribute to the first-order derivative. The remaining cases are those with a small amplitude and located at the turning point of the waveform. They make a large second-order derivative. The three parts can clearly distinguish pulse and non-pulse regions by giving different Sig values. Let sectioni denote the set of sampling points contained in the i-th
section, the significance of sectioni can be calculated by
summing up the Sig values in the section, as expressed by Eq.(3). The number of sampling points assigned to each section is given by the proportion compared to the overall significance, as shown in Eq. (4)
sec i
i p tion p
sig
sig
(3)i i
p p
sig
NumSam
Integer
ASNum
sig
(4)
where ASNum is the total number of sampling points pre-determined for the adaptive sampling, NumSami is the
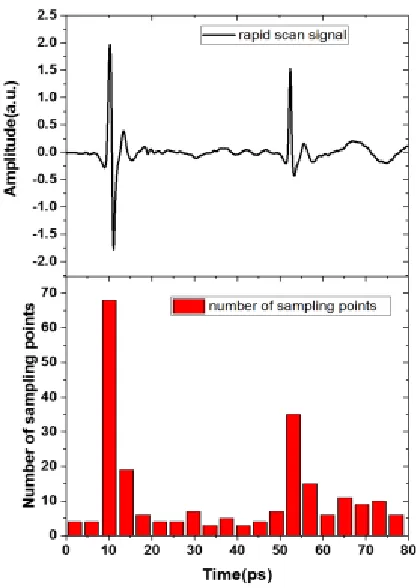
[image:4.612.325.533.64.358.2]number of sampling points in the i-th section decided by the proportion of the sig value and is rounded to an integer. Figure 2 shows an example of a rapid scan signal acquired by the reflection system and the point distributions decided by the above method. The number of sampling points assigned to the sections is proportional to the amount of information included in the corresponding section, which is quantitatively represented by sig.
Fig. 2. The signal is divided into 20 identical sections on time domain, the histogram shows the sampling numbers for each section with the total number
of 200 points
In part b, the GA tries different sampling distributions to find the optimization that gives the minimum error to the scanned signal. A GA solves a problem by firstly initializing a population of randomly generated chromosomes (i.e. solutions), with the population size specified by NumPop. An objective function fobj is defined to evaluate the quality of these
chromosomes and give a score to rank them accordingly. The top-half of the population is kept as parents and a process called crossover is applied to generate new chromosomes. The crossover is usually done by randomly exchanging part of the genes (i.e. parameters) of two chromosomes to make the newly generated chromosome maintain some of the profile from its parents. The remaining NumPop/2 parent chromosomes and the new-born NumPop/2 offspring form the population of the next generation. This above process iterates until the specified maximum iteration number NumItp. Another process called mutation is also applied in every iteration to randomly change some of the genes of the solutions to ensure the divergence of the searching. The final optimized solution is given by the top chromosome in the last generation.
a way of sampling the THz signal. For example, C1=[2ps ,6ps, 12ps ,16ps…..], C2=[1ps, 3ps, 7ps, 11ps…].
To evaluate the quality of the chromosome in Step 3, we need to simulate the sampled waveform E(Ci) by the adaptively distributed positions. This is achieved by interpolating the sampling positions to the pre-acquired rapid-scan signal, represented by
( )
iinterp(
rapid,
rapid,
i, '
')
E C
T
E
C spline
(5)where Trapid and Erapid are the time axis and E-field amplitude of
the rapid-scan signal. ‘spline’ is the interpolation method. This simulates the sampled THz signal using the point distribution given by the chromosome. Interpolating E(Ci) to the same time
axis of the rapid scan signal allows us to evaluate the accuracy. This can be expressed by:
_
(
)
interp( , ( ),
, '
')
recons i rapid i i rapid
E
T
C E C T
spline
(6) where Erecons_i(Trapid) is the reconstructed signal corresponding
to the equally distributed rapid scan time axis from the adaptively sampled signal. The evaluation can thus be realized by using the objective function comparing the difference between the reconstructed signal and the rapid scan signal, recorded as Fitnessi and given by:
2 _
(
(
)
)
i recons i rapid rapid t T
Fitness
E
T
E
(7)The Fitness sums up the square of the E-field difference in time-domain. All the chromosomes are scored by their Fitness values and ranked accordingly from low to high. The latter half is regarded as a bad fit and is redundant. Only the top half is kept. This mimics the natural selection rule to keep only those populations that have adapted well to their living conditions as they may contain genes more suitable for survival. In this way, the remaining chromosomes have a higher probability of containing good parameters to accurately sample the signal.
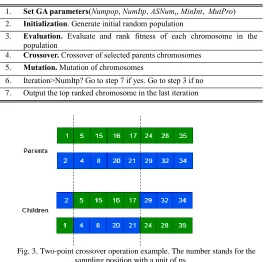
In Step 4, the two-point crossover was applied to the remaining population so that they can pass their genes to successive generation. This is illustrated schematically in Fig.3. Every two neighbor chromosomes reproduce their offspring by exchanging part of their genes (a sampling position in a chromosome is a gene). The crossover sections on chromosomes are chosen randomly.
As crossover does not bring new genes into the population, the mutation process is applied to maintain diversity of the searching procedure and avoid premature convergence in Step 5. In this problem, the GA starts with a MutPro of 10% to mutate the 10% of the offspring chromosomes. Higher mutation rate of 25% and 50% will be applied when the fitness values does not improve for a certain amount of iterations. To avoid missing the best solution, the top ranked chromosome in the last generation will not be mutated. So far, the half chromosomes from the last generation, and the same number of new-born chromosomes, with some random mutations, form the new generation to be evaluated in the next iteration. The above process repeats until the GA reaches the maximum iteration number NumItp. Finally, the best solution is picked from the top ranked chromosome in the last generation in Step 7.
TABLEⅠ ALGORITHM STEPS
1. Set GA parameters(Numpop, NumItp, ASNum,, MinInt, MutPro) 2. Initialization. Generate initial random population
3. Evaluation. Evaluate and rank fitness of each chromosome in the population
4. Crossover. Crossover of selected parents chromosomes 5. Mutation. Mutation of chromosomes
6. Iteration>NumItp? Go to step 7 if yes. Go to step 3 if no
[image:5.612.308.573.46.308.2]7. Output the top ranked chromosome in the last iteration
Fig. 3. Two-point crossover operation example. The number stands for the sampling position with a unit of ps.
For the final solution obtained from GA, post-processing is conducted to remove neighbor points having a time step smaller than MinInt. The system bandwidth decides the minimum time step required for a time-domain sampling. For example, a 4 THz bandwidth requires a sampling step smaller than 0.125 ps. The actual minimum step here should be smaller than this critical value because the signal was not equally sampled. To ensure the stability, we only remove neighbor points with a step smaller than 0.02ps
In the final part c, the signal was adaptively sampled again according to the optimized distribution with a long time constant. By doing these, we can efficiently improve the sampling speed by skipping less important points while maintaining a SNR as good as that by a traditional step scan.
TABLEⅡ
PARAMETERS OF PROPOSED APPROACH
Parameter Value
NumPop 1000
Mut.Pro 10%
NumItp 5000
Sec 20
MinInt T.Cons
0.02ps 30ms
IV. EXPERIMENTAL VERIFICATION
[image:5.612.313.574.500.587.2]according to the optimized GA results; a traditional step scan (SS) was performed and used as a reference to be compared with the AS result in the aspects of spectrum accuracy and measurement efficiency. Results are compared to show the accuracy, stability and the improvement in the speed.
A. Reflection measurement
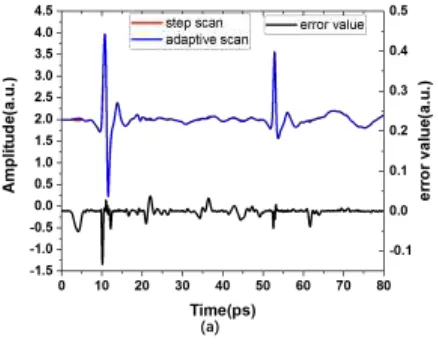
We first measured pure water using the window-based reflection setup. The time length of the signal is 80 ps. The number of the points by the traditional step scan is 1600 (0.05ps step). The sampling points of 80, 120, 160, 200 and 240 were used for the AS and SS to evaluate the improvement by the algorithm. An example of the time-domain signal by AS using 200 points is shown in Fig. 4(a), compared with the SS signal. They are offset for clarity. Their difference is shown as the black curve. The frequency-domain spectrum of the upper reflection (by subtracting the lower baseline reflection) by AS and SS, as well as their ratio, are shown in Fig. 4 (b). The error bars of the AS calculated by the standard deviation of
2 1
1
(
)
ni ave
E
E
n
, where n is the number of themeasurements, 𝐸𝑖 is the amplitude in frequency domain for each measurement, and 𝐸𝑎𝑣𝑒 is the average amplitude for the n
times measurement. The time-domain amplitudes have an average error of 0.0035, which is 0.12% of the peak-to-peak value. The maximum error of the spectrum is 0.364, which is 2% comparing with the SS value at corresponding frequency, providing a reliable accuracy for spectroscopy. These results showed that the AS has very little difference to the SS signal in both time domain and frequency domain. Furthermore, the very small standard deviation of the maximum below 0.5 demonstrates the stability of AS.
Fig. 4. (a)Measured time domain water signal using AS scan(200points) and SS(1600points) with error value. The signals are offset for clarity (b)The corresponding frequency spectrum for the SS and AS signals after subtracting the baseline. The AS curve is the average for ten measurements, the error bars are the standard deviation.
TABLEⅢ
MEASUREMENTS FOR DIFFERENT SAMPLING NUMBERS
Sampling points
Adaptive scan time(s)
Speed
improve-ment factor
Error
RMSE(%) PPOE(%)
AS SS AS SS
80 16.5
(1.5+7+8)
14.5 8 21.3 0.2 7
120 32.5
(1.5+16+15)
7.4 3 5 0.18 2.1
160 46.5
(1.5+25+20)
5.2 2.6 3 0.1 0.3
200 59.5
(1.5+30+28)
4.0 1 1.6 0.051 0.36
240 73.5
(1.5+38+34)
3.3 1.1 1.8 0.045 0.063
To evaluate the performance of the AS using different numbers of sampling points, we compared the results in Table
[image:6.612.79.298.444.617.2]The accuracy was evaluated by the root mean square error (RMSE) and percentage error of Emax (PPOE). RMSE is
calculated by
2
1
(
) /
n adp ref
p p
j
RMSE
E
E
n
(8)where 𝐸𝑝𝑎𝑑𝑝 and 𝐸𝑝𝑟𝑒𝑓are the reconstructed AS signals by
interpolating to the reference time axis and reference signal, respectively. The subscript p denotes the p-th point in the time-domain and n is the total number of data points. PPOE was used to directly evaluate the accuracy of the main pulse. It was defined as:
max max
max adp ref
ref
E
E
PPOE
E
(9)whe
re
𝐸𝑚𝑎𝑥𝑎𝑑𝑝 is the maximum value for AS after interpolationand 𝐸𝑚𝑎𝑥𝑟𝑒𝑓 is the maximum value for reference signal.
Under the same sampling points, the values of RMSE and PPOE for the AS were smaller than the SS, especially when the sampling points were below 160. This clearly indicates that the adaptive distribution of the sampling points by the GA optimization improved the accuracy. From 80 points to 200 points, the RMSE and PPOE for AS decrease while the consumption of time increases. When the sampling points were over 200, the RMSE and PPOE of the AS are almost saturated while time consumption is still going up. Therefore, an optimal tradeoff between the accuracy and the efficiency can be found around 200 points.
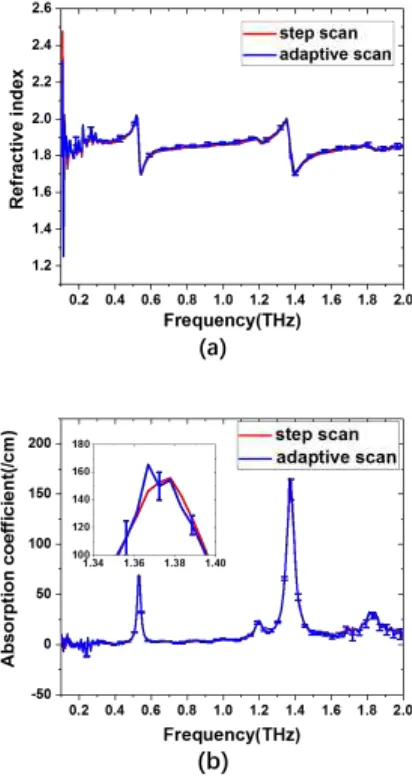
A more straightforward evaluation of the method can be done by comparing the sample characterization results, as shown in Fig.5. The water refractive index and absorption coefficient calculated from the 200 points AS and the reference scan are plotted, and compared with the data from Thrane et al. [19], Bertie and Lan [20], and Hirori et al. [21]. The error bars of the adaptive scan data are also given by the standard deviation of 10 individual AS using the same sampling parameters. The AS results are highly consistent with the reference data, and also match well with the published works, showing the high-degree accuracy and reliability of the proposed method. To quantitatively evaluate the performance, we defined two parameters ΔS and ΔA here as:
ΔS=
𝑆𝑡𝑎𝑛𝑑𝑎𝑟𝑑 𝑑𝑒𝑣𝑖𝑎𝑡𝑖𝑜𝑛 |𝐴𝑆.𝑎𝑣𝑒𝑟𝑎𝑔𝑒 |*100% (10)
ΔA=
|
SS−AS𝑆𝑆| ∗ 100%
(11)
where ΔS stands for the stability of the adaptive scan by comparing the standard deviation of 10 scans to their average. ΔA evaluates the accuracy by comparing the average AS to the step scan. As shown in fig.5, the ΔS values for the refractive index and absorption coefficient are both below 2% from 0.2THz to 1THz, while the ΔA values are below 1% and 3%. The values quantitatively demonstrate the robustness and good accuracy of the AS for sample characterization.
Fig.5. Different methods for water measurement. Water refractive index (a) and absorption coefficient (b) as a function of frequency. The adaptive scan curve is the average of 10 adaptive scan results, with standard deviation at the corresponding frequency as error bar. ΔS and ΔA are also shown in both figures.
B. Transmission measurement
To show the versatility for different geometries and the capability for different pulse shapes, we measured a 460 μm lactose pallet. Lactose exhibits strong absorption peaks in the THz range, which introduce strong echoes in the time-domain after the main pulse, as shown in Fig 6(a). This resulting signal is different from that from a non-resonant medium which has a pulse width typically smaller than 5ps. To precisely capture the absorption peak features, both the main pulse and the echoes should be precisely sampled, hence this gives a good example to evaluate the performance of our sampling method on different pulse shapes.
no difference to the step result from 0.2 THz to 2 THz, while it only requires less than 1/4 of the sampling points. The errors above 1.5 THz are relatively larger because higher frequencies have worse SNR and a higher demand on the sampling density.
The refractive index and absorption coefficient can be extracted from the sample-reference ratio and are shown in Figure 7. The AS curve is the average of ten measurements with their standard deviation plotted as the error bars. For the refractive index, the AS result is highly consistent with the SS and has a standard deviation smaller than 0.015 from 0.2 THz to 2 THz, showing excellent accuracy and stability of our measurement approaches. The absorption coefficient using AS also agrees well with the SS data. The AS absorption peak at 1.377 THz also coincides well with the SS result, except for a single outlier point at 1.367 THz. The error is considered to result from the relatively worse SNR in the AS. The 33dB attenuation is very close to the limit of the system dynamic range at this frequency region and any reduction of the SNR leads to inaccuracies in resolving the peak. However, the small error has very little effect to the peak features and additional modeling of the peaks can still be precisely fitted by using the AS data. The ΔS for the absorption coefficient in peak regions is below 7%, showing the good stability of our measurement. In short, the proposed method is able to use fewer than a quarter of the sampling points to well reconstruct absorption features of a resonant sample.
Fig.6. (a)Time domain signal for lactose measured by SS and AS. (b)Frequency domain signal respectively restored by SS and AS. The magnitude ratio (MR) is calculated by the following equation:MR =
20 log10𝐸𝐸𝑙𝑎𝑐
𝑎𝑖𝑟, where 𝐸𝑙𝑎𝑐 and 𝐸𝑎𝑖𝑟 are electric field of lactose and air in frequency-domain.
[image:8.612.332.531.65.237.2] [image:8.612.338.544.313.701.2] [image:8.612.73.270.370.540.2]V. CONCLUSION
In this paper, we proposed a GA-based optimization approach for adaptively sampling signals in THz-TDS systems. The method utilizes the clustering feature of TDS signals. This feature indicates the possibility of using very few sampling points to accurately reconstruct a signal by interpolation. To realize this, our approach first allocates a different number of sampling points to the distributed regions by considering their zero, first and second derivatives of the signal amplitude. The GA then optimizes the sample distribution according to the fitness between the reconstruct signal and the rapid scan signal. The optimized distribution is finally sent to sample the signal using a sufficiently long integration time to provide a good SNR in the minimum time. Both reflection measurements of pure water and transmission measurements of lactose were performed for evaluating the algorithm performance. The reflection measurements show that the measurement speed can be significantly improved with fewer data points assigned to the adaptive scan, and at the same time provide a significantly higher accuracy than the step scans using the same number of data points. The characterization of the refractive index and absorption coefficient further proves that the 200 points adaptive scan can achieve good accuracy with the measurement four times faster than the traditional step scan. The transmission measurements of lactose also show promising accuracy compared to the step scan result while using less than 1/4 of the data points. The efficient speed improvement without sacrificing the data quality benefits many applications requiring a fast data acquisition. For example, investigations into fast variation processes such as skin occlusion or perovskite degradation [22-23], or in raster-scan imaging to balance the image quality and time cost. The proposed method has no extra hardware requirement, thus it can be retrospectively implemented in various THz-TDS systems. In a practical application, there could be pulse drift in the time-domain between the coarse scan signal and the actual adaptive sampling signal especially in fiber-based TDS systems, which could result from timing jitter error, temperature variation or delay line positional error. The actual drift effect varies among different systems. The algorithm is usually robust to small pulse drifts <0.1 ps. Larger drifts cause sampling position errors. In this case, an extra calibration to compensate for the pulse drift error can be applied. For example, the actual sampled amplitude at a specific position in an AS can be compared with the amplitude of the reconstructed signal Erecons
to evaluate the drift error, which can be used to calibrate the later sampling points. This would efficiently improve the algorithm robustness and versatility for different applications.
In summary we have shown how a GA approach can be easily adapted to different geometries and different pulse shapes, demonstrating robust and versatile characterization capabilities.
REFERENCES
[1] Hangyo M, Tani M, Nagashima T, “Terahertz time-domain spectroscopy of solids: a review.” International journal of infrared and millimeter waves,26(12):1661-1690, 2005
[2] T. R. Globus et al., “THz-spectroscopy of biological molecules,” J. Biol. Phys., vol. 29, no. 2–3, pp. 89–100, 2003.
[3] R. Zhang, Y. He, K. Liu, L. Zhang, S. Zhang, E. Pickwell-MacPherson, Y. Zhao, and C. Zhang, “Composite multiscale entropy analysis of reflective terahertz signals for biological tissues,” Opt. Express, vol. 25, no. 20, pp. 23669-23676, 2017
[4] N. Karpowicz, J. Dai, X. Lu, Y. Chen, M. Yamaguchi, H. Zhao, X. Zhang, C. Zhang, L. Zhang, M. Price-Gallagher, C. Fletcher, O. Mamer, A. Lesimple, and K. Johnson, “Coherent heterodyne time-domain spectrometry covering the entire “terahertz gap”,” Appl. Phys. Lett., vol. 92, no. 1, p. 11131, 2008
[5] R A. Lewis, Terahertz physics[M]. Cambridge University Press, 2012.
[6] X. Zhang, “Terahertz wave imaging: Horizons and hurdles,” Phys. Med. Biol., vol. 47, pp. 3667–3677, 2002
[7] T. Dekorsy, G. Klatt, R. Gebs, C. Janke, and A. Bartels, “Asynchronous optical sampling with GHz repetition rate femtosecond lasers for high precision terahertz spectroscopy,” 2011 30th URSI Gen. Assem. Sci. Symp. URSIGASS 2011, pp. 1–4, 2011. [8] N. Krauß, A. Nast, D. C. Heinecke, C. Kölbl, H. G. Barros, and T. Dekorsy, “Fiber-coupled high-speed asynchronous optical sampling with sub-50 fs time resolution,” Opt. Express, vol. 23, no. 3, p. 2145, 2015.
[9] G. J. Kim, S. G. Jeon, J. Il Kim, and Y. S. Jin, “Terahertz pulse detection using rotary optical delay line,” Japanese J. Appl. Physics, Part 1 Regul. Pap. Short Notes Rev. Pap., vol. 46, no. 11, pp. 7332– 7335, 2007
[10] J.Z. Xu, X.C. Zhang, “Circular involute stage,” Opt. Lett., vol. 29, no. 17, pp. 2082–2084, 2004.
[11] H. Guerboukha, A. Markov, H. Qu, and M. Skorobogatiy, “Time Resolved Dynamic Measurements at THz Frequencies Using a Rotary Optical Delay Line,” IEEE Trans. Terahertz Sci. Technol., vol. 5, no. 4, pp. 564–572, 2015
[12] He Y, Parrott E P J, Pickwell-MacPherson E,”Adaptive sampling for terahertz time-domain spectroscopy and imaging”, IEEE Transactions on Terahertz Science and Technology, 118-123, 2017 [13] J. H. Holland, “ Genetic algorithms,”. Scientific American, vol. 267,
no. 1, pp. 66–73, 1992.
[14] X. Chen, E. P. J. Parrott, B. S. Y. Ung, and E. Pickwell-Macpherson, “A Robust Baseline and Reference Modification and Acquisition Algorithm for Accurate THz Imaging,” IEEE Trans. Terahertz Sci. Technol., vol. 7, no. 5, pp. 493–501, 2017.
[15] S. Fan, E. P. J. Parrott, B. S. Y. Ung, and E. Pickwell-MacPherson, “Calibration method to improve the accuracy of THz imaging and spectroscopy in reflection geometry,” Photonics Res., vol. 4, no. 3, p. A29, 2016.
[16] M. Exter, C. Fattinger, and D. Grischkowsky, “Terahertz time-domain spectroscopy of water vapor.,” Opt. Lett., vol. 14, no. 20, pp. 1128–30, 1989.
[17] J. Vázquez-Cabo, P. Chamorro-Posada, F. J. Fraile-Peláez, Ó. Rubiños-López, J. M. López-Santos, and P. Martín-Ramos, “Windowing of THz time-domain spectroscopy signals: A study based on lactose,” Opt. Commun., vol. 366, pp. 386–396, 2016. [18] R. Singh, I. A. I. Al-Naib, M. Koch, and W. Zhang, “Sharp Fano
resonances in THz metamaterials,” Opt. Express, vol. 19, no. 7, p. 6312, 2011.
[19] L. Thrane, R. H. Jacobse n, P. U. Jepsen, and S. R. Keiding, “Chemical THz reflection spectroscopy of liquid water,” Chem. Phys. Lett., vol. 240,no. 4, pp. 330–333, 1995.
[20] J. E. Bertie and Z. Lan, “Infrared intensities of liquids XX: The intensity of the OH stretching band of liquid water revisited, and the best current values of the optical constants of H2O(l) at 25 °C between 15,000 and 1 cm−1,” Appl. Spectrosc., vol. 50, no. 8, pp.
1047–1057, 2016.
[21] H. Hirori, K. Yamashita, M. Nagai, and K. Tanaka, “Attenuated total reflection spectroscopy in time domain using terahertz coherent pulses,” Jpn. J. Appl. Phys., vol. 43, no. 10A, pp. L1287–L1289, 2004.
[22] Q. Sun, E. P. J. Parrott, and Y. He, “In vivo THz imaging of human skin : Accounting for occlusion effects,” no. May 2017, pp. 1–8, 2018.
Kaidi Li received the B.Eng. degree in Electronic Information Engineering from Hunan University, Hunan, China, in 2017. Since 2017, he has been with Prof Macpherson’s Terahertz group, Department of Electronic Engineering, Chinese University of Hong Kong, Hong Kong. His research interests include terahertz measurement optimization and terahertz device development.
Dr. Xuequan Chenreceived the B.Eng. degree (Honors) from University of Electronic Science and Technology of China in 2014. After that, he joined Prof. Emma Pickwell-MacPherson's Terahertz group in the Chinese University of Hong Kong for his PhD research and completed his PhD degree in 2018. He is now a postdoctoral fellow and continues his research in fast and accurate terahertz spectroscopy and imaging, ellipsometry and advanced terahertz devices.
Shuaiqi Shenwas born in Wuhan, Hubei Province, China, in 1994. He received the B.Sc. degree in Electronic and Information Engineering from Hong Kong Polytechnic University (PolyU), Hong Kong, in 2016. He obtained his M.Phil. degree in System Engineering and Engineering Management from The Chinese University of Hong Kong, Hong Kong, in 2018. After graduation, he joined Prof. Song Ci’s group in Electronic and Computer Engineering, University of Nebraska-Lincoln, as a PhD student. His research interests include machine learning, system modelling and optimization, green computing and battery power management.
Rui Zhang received the B.Eng. degree in electronic information engineering from Xidian University, China, in 2010. He received his Ph.D. degree in mechanics from Peking University, China, in 2016. From Oct. 2016 to Oct. 2018, he was a Postdoctoral Fellow with Prof. MacPherson’s Terahertz Group in the Chinese University of Hong Kong. Since Nov. 2018, he has been an Assistant Professor in Shenzhen Institutes of Advanced Technology, Chinese Academy of Sciences, China. His research interests include terahertz spectroscopy and imaging, biomedical application of terahertz technique, terahertz wave generation.
Emma Pickwell-MacPherson received the Undergraduate degree in natural sciences and the M.Sc. degree in physics (specialized in semiconductor physics) from Cambridge University, Cambridge, U.K. She started
working toward the Ph.D. degree at the Semiconductor Physics Group, Cambridge University, and TeraView Ltd, Cambridge, a company specializing in terahertz imaging, in 2002, and received the Ph.D. degree in 2005. Her Ph.D. work focused on understanding contrast mechanisms in terahertz images of skin cancer.