Sample
Analysis of cropped delta wing under
low subsonic flow regime
K. Nagavardhanarao
1, J. Jasmine
2, K. Ayyappa
3, K. Sandeep
4, D. Buchibabu
512345
Student; Dept of Aeronautical Eng.: PVPSIT, Andhra Pradesh, India
---***---Abstract -
The Delta wing is a wing shaped in the
form of a triangle. Wing is a type of fin that produces
lift, while moving through air or some other fluid. As
such, wings have streamlined cross sections that are
subject to aerodynamic forces and act as an airfoil. A
wing’s aerodynamic efficiency is expressed as it's
lift-to-drag ratio. A high lift-lift-to-drag ratio requires a
significantly smaller thrust to propel the wings
through the air at enough lift and it proves suitable for
high-speed subsonic and supersonic flight. This phase
of this work is the testing of prototype model by using
the subsonic wind tunnel. During the test, the model is
placed in the test section of the tunnel and air is made
to flow past the model.
With the model mounted on the
test section we can measure lift, drag, lateral side
forces, over a range of
angle of attack
. This allows one
to produce common curves such as
lift coefficient
versus angle of attack, drag coefficient versus angle of
attack.
The lift of the airfoil increases linearly with
angle of attack and speed. But from the plots, the lift
decreases drastically at an angle of attack of 15
degrees. So, the stall angle exists at 15 degrees with
maximum coefficient of lift 0.92.
Key Words:
AOA- Angle of Attack, NACA-National
Advisory Committee for Aeronautics, NASA- National
Aeronautics and Space Administration, AR-Aspect
ratio, CG-Center of gravity, CFD- Computational Fluid
Dynamics, ANSYS-Analysis Structure.
1.INTRODUCTION
An
airfoil-shaped
body
moved
through
a fluid produces
an aerodynamic
force.
The
component of this force perpendicular to the
direction of motion is called lift. The component
parallel
to
the
direction
of
motion
is
called drag. Subsonic
flight airfoils
have
a
characteristic shape with a rounded leading edge,
followed by a sharp trailing edge, often with
a symmetric curvature of upper and lower surfaces.
Foils of similar function designed with water as the
working fluid are called hydrofoils. Supersonic
airfoils are much more angular in shape and can have
a very sharp leading edge, which is very sensitive to
angle of attack. A supercritical airfoil has its
maximum thickness close to the leading edge to have
a lot of length to slowly shock the supersonic flow
back
to
subsonic
speeds.
Generally
such transonic airfoils and also the supersonic
airfoils have a low camber to reduce drag divergence.
Modern aircraft wings may have different airfoil
sections along the wing span, each one optimized for
the conditions in each section of the wing. Cropped
delta wing is a delta wing with sheared tips. Mostly
cropped delta wings are used for fighter aircrafts
because of high maneuverability under higher speeds
and it also promotes higher fuel and weapon carrying
capacity. The performance of cropped delta wing is
appreciable under sub sonic speeds also, by using
cropped delta wing under low speeds drag due to
separation is reduced.
[image:1.595.314.550.543.693.2]
2. Super Critical Airfoil:
Employing a supercritical airfoil would alters the flow separation at the trailing edge and used to reduce the flow separation responsible for drag reduction further. Super critical airfoil contains flat upper surface which accelerates the downstream to higher speeds which reduces the induced drag.
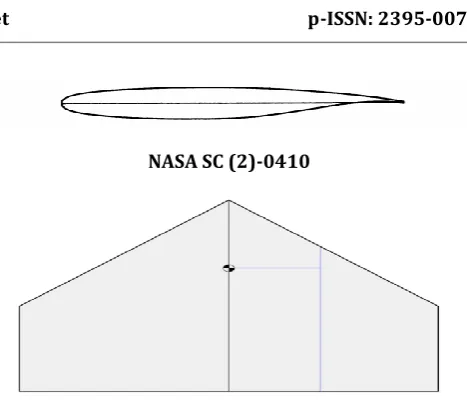
3.NASA SC (2)-0412:
A supercritical airfoil is an airfoil designed primarily to delay the onset of wave drag in the transonic speed range. Supercritical airfoils are characterized by their flattened upper surface, highly cambered ("downward-curved") aft section, and larger leading-edge radius compared with NACA 6 series laminar airfoil shapes.
Standard wing shapes are designed to create lower pressure over the top of the wing. The camber of the wing determines how much the air accelerates around the wing. As the speed of the aircraft approaches the speed of sound the air accelerating around the wing reaches Mach 1 and shockwaves begin to form. The formation of these shockwaves causes wave drag. Supercritical airfoils are designed to minimize this effect by flattening the upper surface of the wing.
The airfoil seleed for this analysis is NASA SC (2) -0410.
Figure 2: Super Critical Airfoil
3. METHODLOGY
Scaling
Fabrication of model Wind tunnel testing
Calculation of coefficient lift, drag and side force Flow analysis using Ansys software
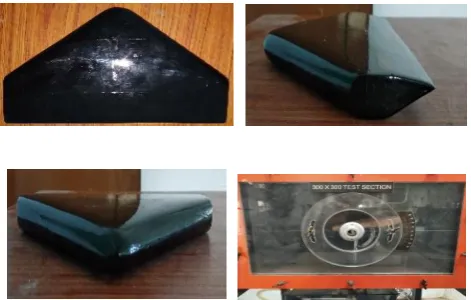
3.1. Fabrication of model
Due to the experimental constrains of wind tunnel experiments were carried out on scaled model with wing span of 25 cm, Root chord of 18cm, Tip chord of 8cmand wing area32.5cm.
[image:2.595.319.553.62.263.2]NASA SC (2)-0410
Figure 3: Delta Wing Configuration
And the model was fabricated using the wood, according to the dimensions of NASA SC (2) 0410. The model is shown in the figure3 the tests were conducted in low subsonic wind tunnel.
3.2. TESTING
The lift, drag and side forces are obtained from the wind tunnel testing and the coefficients are calculated using the formulae results are depicted in the tables.
Coefficient of lift =
Drag coefficient =
Coefficient of side force =
3.3. Results and Discussion:
TABLE 1: ANALYTICAL RESULTS FOR THE FLOW VELOCITY V=35m/s:
A LIFT Cl DRAG Cd SIDE Cs
-20 -2.3 -0.9253 0.61 0.2454 0.01 0.00402
-15 -1.23 -0.4948 0.29 0.11667 0.03 0.01207
Lift coefficient TABLE 2: ANALYTICAL RESULTS FOR THE FLOW
VELOCITY V=40m/s:
A LIFT Cl DRAG Cd SIDE Cs
-20 2.89 -0.89 0.76 0.02341 0.02 0.0062 -15 -1.41 -0.434 0.33 0.1016 0.03 0.0092 -10 -0.47 -0.145 0.21 0.0647 0.01 0.0031 -5 -0.08 -0.025 0.19 0.0585 -0.01 -0.003
0 0.59 0.1817 0.2 0.0616 0 0
5 1.32 0.4066 0.25 0.077 -0.02 -0.006 10 1.91 0.5883 0.58 0.1786 -0.01 -0.003 15 2.25 0.693 0.91 0.2803 0 0 20 1.77 0.5452 0.95 0.2926 -0.01 -0.003
TABLE 3: ANALYTICAL RESULTS FOR THE FLOW VELOCITY V=45m/s:
A LIFT Cl DRAG Cd SIDE Cs
-20 -3.74 -0.91 0.95 0.2312 0.02 0.0049 -15 -1.73 -0.421 0.42 0.1022 0.04 0.0097 -10 -0.6 -0.146 0.28 0.0681 0.01 0.0024 -5 -0.11 -0.027 0.24 0.0584 -0.01 -0.002 0 0.75 0.1825 0.24 0.0584 0 0 5 1.74 0.4235 0.32 0.0779 -0.03 -0.007 10 2.47 0.6011 0.77 0.1874 -0.02 -0.005 15 2.71 0.6595 1.1 0.2677 0 0 20 2.36 0.5743 1.23 0.2993 -0.01 -0.002
TABLE 4: ANALYTICAL RESULTS FOR THE FLOW VELOCITY V=50m/s:
A LIFT Cl DRA
G Cd SIDE Cs
-20 -4.96 -0.978 1.09 0.2149 0.04 0.0079 -15 -2.02 -0.398 0.5 0.0986 0.04 0.0079 -10 -0.71 -0. 14 0.34 0.067 0.01 0.002 -5 -0.13 -0.026 0.29 0.0572 -0.01 -0.002 0 0.95 0.1873 0.29 0.0572 0 0 5 2.14 0.4218 0.37 0.0729 -0.03 -0.006 10 3.14 0.619 0.97 0.1912 -0.03 -0.006 15 3.51 0.6919 1.37 0.2701 0.02 0.0039 20 3.03 0.5973 1.58 0.3115 -0.02 -0.004
TABLE 5: ANALYTICAL RESULTS FOR THE FLOW VELOCITY V=55m/s:
A LIFT Cl DR
AG Cd SIDE Cs
-20 -5.18 -0.84389 1.16 0.189 0.06 0.0098 -15 -2.42 -0.39425 0.59 0.0961 0.04 0.0065 -10 -0.81 -0.13196 0.41 0.0668 0.01 0.0016 -5 -0.14 -0.02281 0.37 0.0603 -0.01 -0.002 0 1.33 0.21667 0.38 0.0619 -0.02 -0.003 5 2.62 0.42683 0.46 0.0749 -0.03 -0.005 10 3.92 0.63862 1.17 0.1906 -0.04 -0.007 15 4.62 0.75266 1.72 0.2802 -0.01 -0.002 20 4.05 0.6598 2.01 0.3275 -0.02 -0.003
TABLE 6: ANALYTICAL RESULTS FOR THE FLOW VELOCITY V=60m/s:
A LIFT Cl DRA
G Cd SIDE Cs
Drag coefficient -1
-0.5 0 0.5 1
-30 -20 -10 0 10 20 30
C
LAT 40m/s
-1 -0.5 0 0.5 1
-30 -20 -10 0 10 20 30
C
LAT 45M/S
-1.5 -1 -0.5 0 0.5 1
-30 -20 -10 0 10 20 30
C
LAT 50 m/s
-1 -0.5 0 0.5 1
-30 -20 -10 0 10 20 30
C
LAT 55m/s
-0.2 0 0.2 0.4 0.6 0.8 1
-30 -20 -10 0 10 20 30
C
LAT 60 m/s
-1.5 -1 -0.5 0 0.5 1
-30 -20 -10 0 10 20 30
Side coefficient 0
0.05 0.1 0.15 0.2 0.25 0.3 0.35
-30 -20 -10 0 10 20 30
C
DAT 35m/s
0 0.05 0.1 0.15 0.2 0.25 0.3 0.35
-30 -20 -10 0 10 20 30
C
DAT 40m/s
0 0.05 0.1 0.15 0.2 0.25 0.3 0.35
-30 -20 -10 0 10 20 30
C
DAT 45M/S
0 0.05 0.1 0.15 0.2 0.25 0.3 0.35
-30 -20 -10 0 10 20 30
C
DAT 50 m/s
0 0.05 0.1 0.15 0.2 0.25 0.3 0.35
-30 -20 -10 0 10 20 30
C
DAT 55 m/s
-0.004 -0.002 0 0.002 0.004 0.006 0.008 0.01 0.012
-30 -20 -10 0 10 20 30
-0.01 -0.005 0 0.005 0.01 0.015
-30 -20 -10 0 10 20 30
C
sAT 35m/s
-0.008 -0.006 -0.004 -0.002 0 0.002 0.004 0.006 0.008 0.01 0.012
-30 -20 -10 0 10 20 30
C
SAT 40m/s
CS
-0.01 -0.008 -0.006 -0.004 -0.002 0 0.002 0.004 0.006 0.008 0.01 0.012
-30 -20 -10 0 10 20 30
C
SAT 45M/S
-0.008 -0.006 -0.004 -0.002 0 0.002 0.004 0.006 0.008 0.01
-30 -20 -10 0 10 20 30
C
SAT 50 m/s
-0.008 -0.006 -0.004 -0.002 0 0.002 0.004 0.006 0.008 0.01 0.012
-30 -20 -10 0 10 20 30
C
SAT 55 m/s
-0.035 -0.03 -0.025 -0.02 -0.015 -0.01 -0.005 0 0.005
-30 -20 -10 0 10 20 30
For all the wings the lift increases linearly with angle of attack and speed. But from the plots the lift decreases drastically at an angle of attack15 degrees. So, the angle of stalling exists at 15 degrees with maximum lift coefficient 0.8. The performance of a cropped delta wing is quite appreciable, and the max drag obtained is 0.12. There is no effect of side forces observed
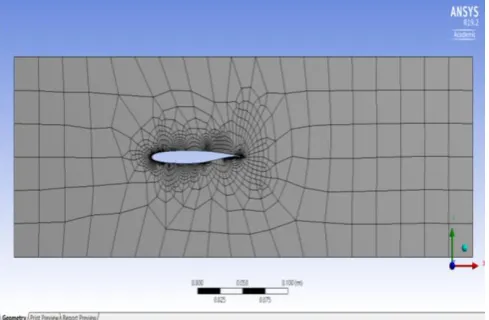
3.4. Flow Analysis using Ansys
The aim of this research is to analyze the behavior of the air flow at the internal cavity of the NASA SC (2)-0410 airfoil and predict possible zones of flow separation at the suction surface of this airfoil. A two-dimensional numerical simulation by using CFD will be performed to obtain velocity fields, pressure fields, temperature, density and streamlines of the flow. ANSYS workbench is the numerical type of engineering problem solving software. Used to simulate interactions of all disciplines of physics, structural, vibration, fluid dynamics, heat transfer and electromagnetic for engineers. Air foil geometry of NASA SC (2)-0410 is derived from the CSV file of coordinates. These coordinates of the respective airfoil are imported to the ANSYS FLUID FLOW (FLUENT)
[image:7.595.309.554.571.731.2]
Figure 4. Generation of all keypoints and edges of airfoil
-0.1 0 0.1 0.2 0.3 0.4
-30 -20 -10 0 10 20 30
C
DAT VARIOUS VELOCITIES
CD AT 35M/S
CD AT 40M/S
CD AT 45M/S
CD AT 50M/S
CD AT 55M/S
CD AT 60M/S
-0.04 -0.03 -0.02 -0.01 0 0.01 0.02
-40 -20 0 20 40
C
SAT VARIOUS VELOCITIES
CS AT 35M/S
CS AT 40M/S
CS AT 45M/S
CS AT 50M/S
CS AT 55M/S
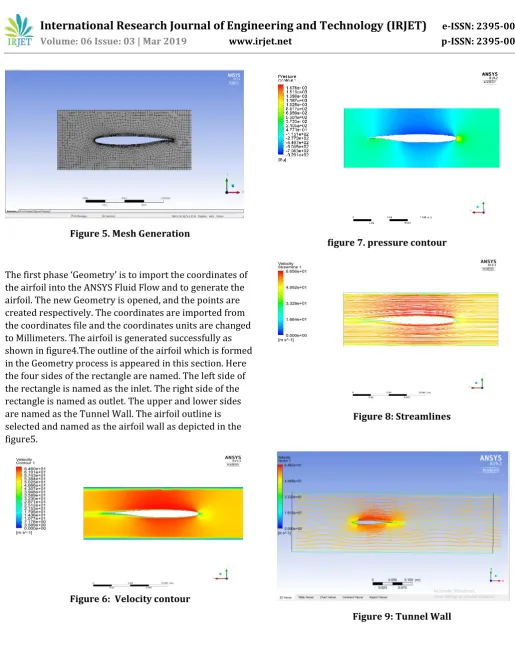
Figure 5. Mesh Generation
The first phase ‘Geometry’ is to import the coordinates of the airfoil into the ANSYS Fluid Flow and to generate the airfoil. The new Geometry is opened, and the points are created respectively. The coordinates are imported from the coordinates file and the coordinates units are changed to Millimeters. The airfoil is generated successfully as shown in figure4.The outline of the airfoil which is formed in the Geometry process is appeared in this section. Here the four sides of the rectangle are named. The left side of the rectangle is named as the inlet. The right side of the rectangle is named as outlet. The upper and lower sides are named as the Tunnel Wall. The airfoil outline is selected and named as the airfoil wall as depicted in the figure5.
Figure 6: Velocity contour
figure 7. pressure contour
[image:8.595.34.279.79.255.2]Figure 8: Streamlines
Figure10: Mesh view of streamlines
Figure11: Streamlines at 10contour points
Figure 12: Velocity in Ball Streamlines
4.Conclusion:
The lift of the airfoil increases linearly with angle of attack and speed. But from the plots, the lift decreases drastically at an angle of attack of 15 degrees. So, the stall angle exists at 15 degrees with maximum coefficient of lift 0.92.
According to experimentation and computational analysis the performance of a cropped delta wing is quite appreciable, and the maximum drag obtained is 0.2, since there is no effect of side forces observed. The maximum lift on the cropped delta wing under the supersonic flow and subsonic flow are similar at 15 degrees angle of attack.
There is a possibility of using cropped delta wings for civil aircrafts, that having higher maneuverability at lower speeds. The velocity fields, pressure fields, temperature, density and streamlines of the flow and graphs have been plotted, and the flow patterns are captured necessarily.
5.Future work:
Since the results presented in this work for lift calculation are only through basic formulae which only depend on are of the delta wing, a flow analysis could be done in order to determine the lift-off performances, vortices reduction.
The distribution of laminar and turbulent flow in the boundary layer of a delta wing is difficult to resolve experimentally and to predict
computationally even for sharp-edged wing.
Pressure distribution on delta wing should be done and a finite element analysis could be performed to calculate structural integrity using Finite Element Analysis tools like ANSYS or CATIA.
6.References:
1. Text book of Introduction to aerodynamics by John D Anderson.
2. Text book of Introduction to flight by John D Anderson.
3. Anderson J.D., Corda S., Van Wie, D.M. Numerical Lifting-Line Theory Applied to Drooped Leading Edge Wings Below and Above Stall // Journal of Aircraft. – 1980. – Vol 17, No 12. – P. 898–904.
4. Barnes J P. Semi-Empirical Vortex Step Method for the lift and induced drag loading of 2D and 3D Wings // SAE Paper / Society of Automotive Engineers. – 1997 Oct. – No 975559.
5. Blackwell J.A. A Finite-Step Method for Calculation of Theoretical Load Distributions for Arbitrary Lifting-Surface Arrangements at Subsonic Speeds // NASA TN D-5335. – 1969 July.
6. E.H. Dowell (Editor), A Modern Course in Aeroelasticity. Kluwer Academic Publishers, 2004.
7. R.E. Gordnier, Computation of limit cycle oscillations of a delta wing, in: 43rd AIAA/ASME/ASCE/AHS/ASC Structures, Structural Dynamics, and Materials Conference, 22-25 April 2002, Denver, Colorado, USA.
8 R.E. Gordnier, Computation of limit-cycle oscillations of a delta wing, Journal of Aircraft, 40, 2003, 1206-1207.
9. P. Attar, R.E. Gordnier, Aeroelastic prediction of the limit cycle oscillations of a cropped delta wing, in: 46th AIAA/ASME/ASCE/AHS/ASC Structures, Structural Dynamics & Materials Conference, 18-21 April 2005, Austin, Texas, USA.
10. E.T. Schairer, L.A. Hand, Measurements of unsteady aeroelastic model deformation by stereo photogrammetry, Journal of Aircraft, 36, 1999, 1033-1040.