warwick.ac.uk/lib-publications
Original citation:
Rivero Pacho, Angeles M., Critoph, Robert E. and Metcalf, Steven J.. (2017) Alternative
monolithic/composite carbons for adsorption generators and simulation for optimal
performance. Applied Thermal Engineering, 126 . pp. 350-357.
Permanent WRAP URL:
http://wrap.warwick.ac.uk/97323
Copyright and reuse:
The Warwick Research Archive Portal (WRAP) makes this work by researchers of the
University of Warwick available open access under the following conditions. Copyright ©
and all moral rights to the version of the paper presented here belong to the individual
author(s) and/or other copyright owners. To the extent reasonable and practicable the
material made available in WRAP has been checked for eligibility before being made
available.
Copies of full items can be used for personal research or study, educational, or not-for-profit
purposes without prior permission or charge. Provided that the authors, title and full
bibliographic details are credited, a hyperlink and/or URL is given for the original metadata
page and the content is not changed in any way.
Publisher’s statement:
© 2017, Elsevier. Licensed under the Creative Commons
Attribution-NonCommercial-NoDerivatives 4.0 International
http://creativecommons.org/licenses/by-nc-nd/4.0/
A note on versions:
The version presented here may differ from the published version or, version of record, if
you wish to cite this item you are advised to consult the publisher’s version. Please see the
‘permanent WRAP url’ above for details on accessing the published version and note that
access may require a subscription.
Alternative monolithic/composite carbons for adsorption generators and
simulation for optimal performance
Angeles M. Rivero-Pacho, Robert E. Critoph, Steven J. Metcalf
PhD, MSc, MEng - Research Fellow
School of Engineering, University of Warwick, Coventry CV4 7AL, UK, Telephone: +44 24 76151442, e-mail: [email protected]
ABSTRACT
This paper presents the development and thermal properties study of three types of carbon composites with enhanced thermal properties along with the optimisation of the geometry of the shell and tube generators currently used at the University of Warwick for the development of carbon-ammonia heat pumps.
The three carbon composites developed use lignin binder, silanes binder and Expanded Natural Graphite (ENG) as a way of enhancing their thermal properties in order to perform more efficiently in a refrigeration or heating system. Two techniques were used in order to obtain the thermal properties: Anter and HyperFlash thermal conductivity instruments.
Results show that ENG increases drastically the thermal conductivity of the samples (up to 3.4 W/(mK)) but reduces the carbon density (450 kg/m3) and increases the thermal mass of the system. Lignin binder samples
show lower thermal conductivities (0.3 W/(mK)) but higher carbon densities (750 kg/m3) which increases the
performance of the machine. Thermal conductivities of samples were also obtained for a wide range of working temperatures (25- 200°C).
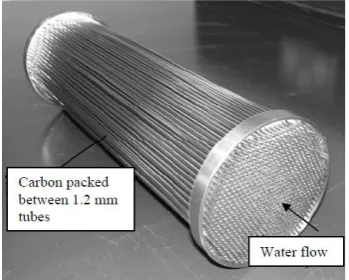
The current development of gas fired heat pumps at Warwick uses shell and tube adsorption generators with over 1000 water tubes of 1.2 mm diameter on a 3 mm pitch. This geometry is not optimised and a dynamic simulation program has been written to determine how far from optimal the design is and also whether alternative designs offer advantages.
The results presented show that the shell and tube is close to optimal for its type but that finned tube designs might offer improvements.
1.
Introduction
Researchers at the University of Warwick are currently developing a sorption gas fired heat pump that uses active carbon (AC) and ammonia. A major problem of the AC used in the system is its low thermal conductivity. During a refrigeration cycle, the adsorbent has to be heated (desorbing refrigerant) and cooled (adsorbing refrigerant) in order to complete a thermodynamic cycle.
The aim of the heat pump development is to achieve low capital costs by means of reducing the size of the sorption generators and using rapid cycles (minutes). In order to achieve this, high rates of heat and mass transfer in and out of the adsorbent are crucial; it is important to increase its thermal conductivity and reduce the resistance of its thermal contact with the walls of the heat exchanger without increasing the thermal capacity of the generator or reducing its mass transfer. As the working pressures of the heat pump are high (between 4 - 20 bar) the permeability and the mass transfer are not an issue.
With the aim of increasing the thermal conductivity of the sorbent, the AC was mixed with three different types of composites/binders and their thermal properties were measured with two different measurement techniques. Their adsorption characteristics were also measured.
Figure 1: Shell and (micro) tube sorption generator
Optimisation of materials or components for adsorption heat pumps is a complex task. For example, improving sorbent conductivity can reduce capital costs and physical size but reduce energy efficiency due to increased thermal mass. Enhancing conductivity of the adsorbent to an extreme level can result in either the water (tube side) heat transfer or tube-adsorbent thermal resistance becoming critical. Also, whatever the physical design of a machine there is a trade-off of achievable power against efficiency that requires sophisticated control to minimise energy use whilst maintaining required comfort levels.
One possibility of improving the heat transfer in the generator is the use of expanded natural graphite (ENG) as a matrix which has been widely utilised in the development of new types of adsorbents for adsorption refrigeration and air conditioning and heat pumping processes. The thermal conductivity of pure ENG is approximately 8 W/(mK) at a density of 1250 kg/m3 [2]. ENG has been used as an additive for granular active
carbon, in which the mixture thermal conductivity is improved by over 20 times [3]. Special attention must be paid when using compressed ENG matrices as the thermal conductivity of the mixture is highly anisotropic [4] and also increase the thermal mass of the generators.
Other possibility is the use of binders, either chemical or organic, that improve the bulk conductivity of the carbon. Examples of these binder can be vulcanised silicon rubber that increases the thermal conductivity of the granular carbon up to 1.3 W/(mK) [5] or lignin binder that increases it from around 0.1 W/(mK) up to 0.44 W/(mK) [6].
Regarding the optimisation of the existent sorption generators, two Matlab simulation models have been written to explore how varying dimensions, control parameters and adsorbent thermal properties affect the Coefficient of Performance (COP) and power output under specified conditions.
One model keeps the simple shell and tube geometry. This is a costly design to manufacture but has been proved with comparatively low conductivity carbon and high contact resistance. There are possibilities for improving the bulk conductivity of the carbon from around 0.1 W/(mK) to 0.3 W/(mK) using organic binders or as high as 3.4 W/(mK) using a matrix of expanded natural graphite, but the latter increases thermal mass. The 2-D model simulates the heat transfer from water in a single tube to its surrounding unit cell of carbon throughout several thermodynamic cycles until the dynamics stabilise and the heating power per unit volume and COP are calculated. The input parameters are the carbon bulk conductivity, specific heat, density and contact resistance, plus the water tube diameter, wall thickness and pitch.
The second model is based on the previous shell and tube model but it also includes the beneficial heat transfer effect of adding aluminium fins to the tubes [7, 8]. This introduces another two geometrical variables: the fin thickness and pitch. There is of course no ‘best’ design and the optimum for highest power per unit volume is not the same as that for highest COP, but the all the parameters and their trends are explored and useful designs evaluated.
2.
Carbon composites
Three carbon composites were developed with different binder materials in order to increase their thermal properties:
- Organic binder (lignin): These lignin-carbon composites consist of blocks made of a mixture of carbon
and ammonium salt of lignosulfonate, a lignin based binder.
The blocks of carbon and lignin are made by mixing 85% weight of carbon (grains, powder or a mixture of both) and 15% in weight of organic binder. Then hot water is added to the mixture, 50% weight of carbon, as it dissolves the binder and helps to create a homogenous mixture. After that, the mixture is compressed to the desired shape in a press between 60 and 106 MPa creating the blocks. Finally, the blocks are fired at 500°C in an inert atmosphere in order to carbonise the organic binder.
- Expanded Natural Graphite (ENG): These carbon composites consist of blocks made of a mixture of
carbon and flakes of ENG.
The blocks of carbon and ENG are made by mixing between 50 and 25% weight of ENG and 50 and 75% respectively of carbon (grains, powder or a mixture of both). Then water is added to the mixture, 100% weight of carbon, which helps to create a homogenous mixture. Finally, the mixture composite is compressed to the desired shape in a press between 60 and 106 MPa creating the blocks.
- Silane binder: There exist a type of silanes that have the characteristic of chemically bonding with stainless steel and carbon which could help decrease the wall contact resistance that exists between carbon and stainless steel.
The carbon-silane composites blocks are made by mixing 50:50 in weight two aqueous solutions of different silanes. The solutions are prepared by mixing 90% volume ethanol, 5% volume water and 5% volume silane. These solutions need to be prepared 24 h in advance of using them as they need to hydrolise at room temperature whilst being stirred continuously.
Then carbon (grains, powder or a mixture of both) is added to the solution obtaining a ration 85% weight of carbon and 15% weight of silanes. After a process of evaporation of the excess solvent (40%) at 80°C with magnetic stirring, the mixture is compressed to the desired shape in a press between 60 and 106 MPa creating the blocks. The blocks are then cured at 40°C for 24 hours, after that they are dipped in the aqueous binder solution which helps to increase their resilience and cured again at 40°C increasing slowly to 80°C during 12h.
3.
Thermal property measurement techniques
In order to measure the thermal conductivity of the carbon blocks and the wall contact resistance between the carbon block and a stainless steel surface two different techniques were used:
- Anter Quickline-10 machine: The thermal conductivity of the carbon samples was measured with a steady
state technique using flat plates. A 2-inch diameter carbon sample is placed in between the flat plates and a heat flux created by a heater and a heat sink travels through the sample. With the recorded heat flux, thickness of the sample and the calibration line of the machine it is possible to obtain the thermal conductivity of the sample.
- LFA 467 HyperFlash machine: This machine uses a transient technique to measure thermal diffusivity
and conductivity. It consists of a light beam that heats the lower surface of the carbon composite sample and an infra-red detector that measures the temperature increase on the upper sample surface. With these measurements it is possible to obtain the thermal conductivity of the sample. As this machine allows different sample temperatures, measurements of thermal conductivity have been carried out between 25 and 200°C.
3.1.
Thermal property results
Figure 2b shows how the thermal conductivity of the sample increases with sample temperature, measured by the HyperFlash machine. It must be noted that the carbon temperature in a heat pump is cycled between 30 and 170°C.
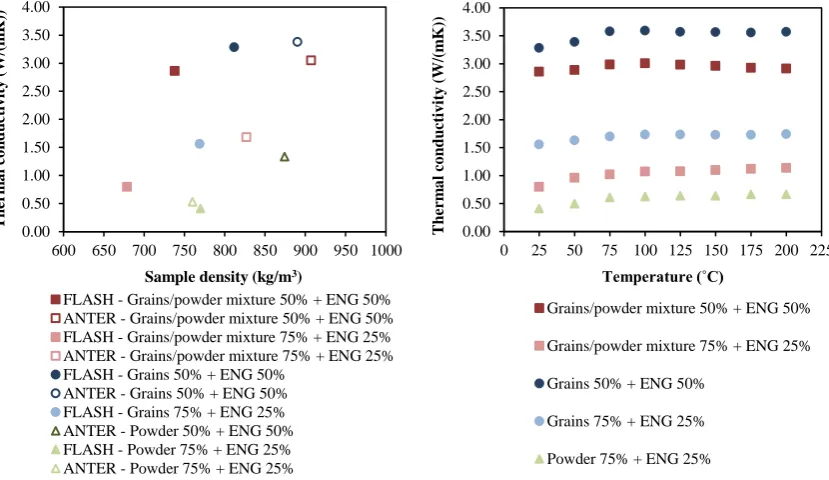
Figure 2: a) Thermal conductivity v. density of silanes and carbon composites, b) Thermal conductivity v. temperature of silanes and carbon composites
[image:5.595.95.509.427.642.2]- Anter & Flash, lignin binders + carbon: Figure 3a shows the relationship between density and the thermal conductivity of various lignin + carbon samples: 100% grains, 100% powder and a 66.7% grains + 33.3% powder mixture (all of them with 15% weight of lignin). The three types of samples were measured in the Anter and in the HyperFlash machine for different densities (compression rates).
Figure 3b shows how the thermal conductivity of the samples increases with sample temperature, measured by the HyperFlash machine.
Figure 3: a) Thermal conductivity v. density of lignin and carbon composites, b) Thermal conductivity v. temperature of lignin and carbon composites
- Anter & Flash, ENG + carbon: Figure 4a shows the relationship between density and the thermal conductivity of various ENG + carbon samples: 100 % grains, 100% powder and a 66.7% grains + 33.3% powder mixture (with 25% and 50% weight of ENG). The six types of samples were measured in the Anter and in the HyperFlash machine for different densities (compression rates).
Figure 4b shows how the thermal conductivity of the samples increases with sample temperature, measured by the HyperFlash machine.
0.20 0.22 0.24 0.26 0.28 0.30
550 600 650 700 750
T h er m a l co n d u ct iv it y ( W /( m K) )
Sample density (kg/m3)
FLASH - Grains 67% + Powder 33% ANTER - Grains 67% + Powder 33%
0.20 0.22 0.24 0.26 0.28 0.30 0.32 0.34 0.36 0.38 0.40
0 25 50 75 100 125 150 175 200 225
T h er m a l co n d u ct iv it y ( W /( m K) ) Temperature (°C)
FLASH - Grains 67% + Powder 33%
0.20 0.23 0.26 0.29 0.32 0.35
575 625 675 725 775 825
T h er m a l co n d u ct iv it y ( W /( m K) )
Density (kg/m3)
FLASH - Grains 67% + powder 33% ANTER - Grains 67% + powder 33% FLASH - Grains 100%
ANTER - Grains 100% FLASH - Powder 100% ANTER - Powder 100%
0.20 0.25 0.30 0.35 0.40 0.45 0.50
0 25 50 75 100 125 150 175 200 225
T h er m a l co n d u ct iv it y ( W /( m K) ) Temperature (˚C)
Grains 67% + powder 33% - 123 kN Grains 67% + powder 33% - 215 kN Grains 100% - 123 kN
Figure 4: a) Thermal conductivity v. density of ENG carbon composites, b) Thermal conductivity v. temperature of ENG carbon composites
4.
Adsorption characteristics
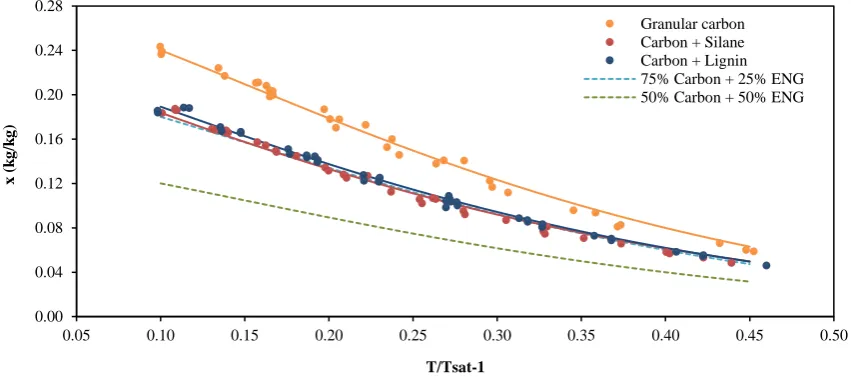
The mass of refrigerant (ammonia) adsorbed (x, kg/kg) in the beds depends on the temperature and pressure of the system. The ammonia concentration is calculated with the modified Dubinin-Astakhov equation presented by Critoph [9]:
𝑥 = 𝑥0 𝑒−𝐾(𝑇 𝑇⁄𝑠𝑎𝑡−1) 𝑛
kg/kg
where T is the refrigerant/adsorbent temperature (K), Tsat is the saturation temperature (K), x is the adsorbed
refrigerant concentration (kg/kg), x0 is the maximum (limiting) concentration (kg/kg) and K and n are
constants.
Since the adsorption characteristics of the carbon composites might vary due to the addition of the binders, adsorption test were carried out with a Rubotherm magnetic suspension balance.
4.1. Adsorption characteristics results
Table 1 shows the Dubinin-Astakhov adsorption coefficients of the different carbons tested that were obtained from the Rubotherm data, also plotted in Figure 5.
Table 1 also shows the specific heat of charcoal 208C that was measured at National Physical Laboratory on a scanning differential calorimeter along with several other different types of charcoal and that was found to vary linearly with temperature.
0.00 0.50 1.00 1.50 2.00 2.50 3.00 3.50 4.00
600 650 700 750 800 850 900 950 1000
T h er m a l co n d u ct iv it y ( W /( m K) )
Sample density (kg/m3)
FLASH - Grains/powder mixture 50% + ENG 50% ANTER - Grains/powder mixture 50% + ENG 50% FLASH - Grains/powder mixture 75% + ENG 25% ANTER - Grains/powder mixture 75% + ENG 25% FLASH - Grains 50% + ENG 50%
ANTER - Grains 50% + ENG 50% FLASH - Grains 75% + ENG 25% ANTER - Powder 50% + ENG 50% FLASH - Powder 75% + ENG 25% ANTER - Powder 75% + ENG 25%
0.00 0.50 1.00 1.50 2.00 2.50 3.00 3.50 4.00
0 25 50 75 100 125 150 175 200 225
T h er m a l co n d u ct iv it y ( W /( m K) ) Temperature (˚C)
Grains/powder mixture 50% + ENG 50% Grains/powder mixture 75% + ENG 25%
[image:6.595.92.507.87.327.2]Table 1: Adsorbent properties
ADSORBENT Density
(kg m-3)
Specific heat (J kg-1 K-1)
Conductivity
(W m-1 K-1) x0 n K
Granular carbon (208C) 650 175+2.245*T(K) 0.1 0.2849 4.792 1.448
208C + Silane 704 175+2.245*T(K) 0.26 0.2322 4.187 1.253
208C + Lignin 791 175+2.245*T(K) 0.32 0.2344 4.453 1.318
75% 208C + 25% ENG 827 175+2.245*T(K) 1.68 0.2849*0.75 4.792 1.448
50% 208C + 50% ENG 890 175+2.245*T(K) 3.38 0.2849*0.50 4.792 1.448
The adsorbents tested whose properties will be used in the simulation models include Chemviron 208C coconut shell granular carbon as well as 208C granular converted into a monolithic carbon by using both a lignin based binder and a silane binder. Two other composites made by mixing granular carbon 208C and Expanded Natural Graphite (ENG, from Mersen) at different mass ratios were used in the simulation models and their adsorption characteristics correspond proportionally to the ratio of granular carbon included in the composite.
Figure 5: Adsorbent performance
The specific heat of the carbon is calculated as a function of temperature and as the specific heats of the carbon and graphite are very similar, the same temperature dependent equation was used when simulating ENG + carbon composites.
5.
Optimal performance simulation models
Two Matlab simulation models have been written to explore how varying generator geometry, dimensions, control parameters and the adsorbent thermal properties affect the Coefficient of Performance (COP) and power output under specified conditions and sorption materials. The adsorbent thermal properties used were the ones previously tested and presented.
5.1.
Shell and tube design
The program is written as a two dimensional finite difference model in Matlab™. The unit cell is a cylindrical section as shown in Figure 6. The true outer surface in a shell and tube configuration would be a hexagonal adiabatic boundary but the approximation is made to a cylindrical boundary of the same contained volume.
0.00 0.04 0.08 0.12 0.16 0.20 0.24 0.28
0.05 0.10 0.15 0.20 0.25 0.30 0.35 0.40 0.45 0.50
x
(
k
g
/k
g
)
T/Tsat-1
[image:7.595.87.513.319.511.2]Figure 6: Shell and tube unit cell
Water-side heat transfer is laminar flow with a Nusselt number approximated to 4 and all other heat transfer is via conduction with the ability to include a steel-carbon resistance modelled by a thin layer of ammonia gas if required.
The lengthwise cell is split into nl axial sections allowing the modelling of thermal waves if required and the carbon is split into nc equal radial sections. In the results presented, nc = 3 has proved adequate when compared with finer subdivisions. The pressurised water used to heat or cool and steel have only one radial element, but the water can be subdivided into multiple numbers of axial elements if the mass flow rate specified is so high that an element of water could flow past more than one axial element of steel in one time step.
Typically a time step of 0.02 seconds was adequate to ensure that the solutions had converged and 3 full cycles were simulated to ensure that periodicity had been achieved. A range of equal heating and cooling times were modelled in combination with a range of heat recovery times so that an envelope of COPs and Specific Heating Powers (SHP, mean heat output in W / unit volume of generator) could be obtained.
Within the program, during the nominal isosteric heating and cooling the pressure at a new time step was derived iteratively with the constraint that the total mass of adsorbate within the generator was constant and during evaporation and condensation the pressure was maintained constant and mass change calculated.
5.2.
Shell and tube results
In this and all other simulations the cooling phase assumes an inlet water temperature of 50C, heating water inlet at 170C, evaporating at 5C and condensing at 50C in order to compare designs.
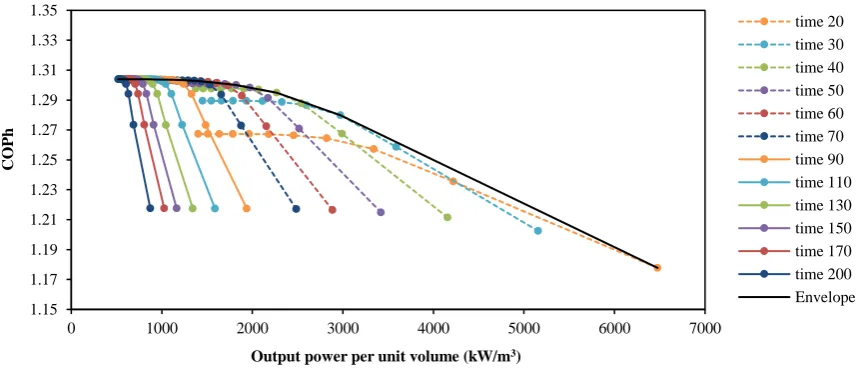
Figure 7 illustrates results for one particular carbon (208C + lignin binder) with 1.2 mm tube outside diameter and 3 mm tube pitch, as per the current design. It shows how for a range of heating/cooling and heat recovery times the combinations of COP and SCP vary. These form an envelope that characterise the best that can be obtained from a particular design, purely by varying control parameters.
Figure 7: COP v. SCP for sample adsorbent, tube and pitch diameters
1.15 1.17 1.19 1.21 1.23 1.25 1.27 1.29 1.31 1.33 1.35
0 1000 2000 3000 4000 5000 6000 7000
C
O
Ph
Output power per unit volume (kW/m3)
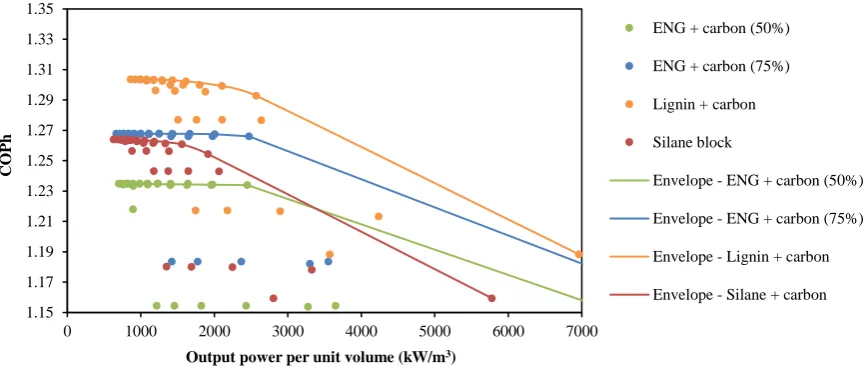
[image:8.595.89.519.560.744.2]Figure 8 takes similar envelopes for all the materials evaluated and compares then for a typical pitch of 3 mm and diameter of 1.2 mm. It shows trends similar to other cases studied that the 208C + lignin carbon seems to be preferable in all cases.
Figure 8: COP v. SCP for all adsorbents, tube and pitch diameters 1.2 mm and 3 mm respectively
[image:9.595.89.519.398.580.2]Figure 9 presents the comparison of different pitches and diameters with the 208C carbon + lignin binder. It can be seen that the present design is not far away from the optimum for a shell and tube design which would feature tube a diameter of 1.2 mm and a pitch somewhere between 2.5 and 4 mm.
Figure 9: COP v. SCP for 208C + lignin carbon with a 1.2 mm OD tube and a range of tube pitch
Given that present designs are not far from the optimum for a shell and tube design and that they all present challenges in reliable cost effective manufacture, the finned tube is worth exploring.
5.3.
Finned tube design
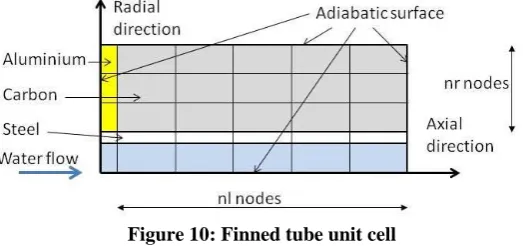
Whilst the shell and tube designs have been demonstrated and in principle have some advantages, the difficulty of manufacturing them at reasonable cost has prompted a re-examination of other geometries, including the use of aluminium fins on tubes within a shell, thereby reducing the number of tubes. In this work the unit cell has been modelled as in Figure 10.
In order to keep the simulation stable whilst the heat transfer in the metallic segments was modelled and whilst keeping the total computation time reasonable, at a time step roughly 0.05 times that of the carbon was used for all the metallic elements.
1.15 1.17 1.19 1.21 1.23 1.25 1.27 1.29 1.31 1.33 1.35
0 1000 2000 3000 4000 5000 6000 7000
C
OPh
Output power per unit volume (kW/m3)
ENG + carbon (50%)
ENG + carbon (75%) Lignin + carbon
Silane block
Envelope - ENG + carbon (50%)
Envelope - ENG + carbon (75%) Envelope - Lignin + carbon
Envelope - Silane + carbon
1.15 1.17 1.19 1.21 1.23 1.25 1.27 1.29 1.31 1.33 1.35
0 1000 2000 3000 4000 5000 6000 7000
C
OPh
Output power per unit volume (kW/m3)
Pitch = 2.5 mm Pitch = 3 mm Pitch = 4 mm Pitch = 5 mm
Envelope - Pitch = 2.5 mm
Figure 10: Finned tube unit cell
5.4.
Finned tube results
All of the simulations presented are with the 208C + lignin carbon. One early trend observed was that as tube diameters and pitches grew (desirable in terms of manufacturing) the water side heat transfer became limiting and the largest thermal resistance was between water and steel.
[image:10.595.89.529.352.533.2]Since techniques to improve surface area and/or heat transfer coefficient exist, the model simply augmented the W/K of a length of tube by a factor of 10 in order to explore what the potential is on the adsorbent side. This is illustrated in Figure 11 which shows how COP and SHP vary with cycle times for both augmented and unaugmented water side heat transfer (hw).
Figure 11: COP and SCP for 208C + lignin carbon with a range of control times with low and high water side heat transfer
Figure 12 brings together result envelopes for series of tube pitches at one tube outside diameter (3 mm). 3 mm is not an optimum but a starting point. It can be seen that it is feasible to obtain reasonable COPs and SHPs at pitches as high as 16 mm, resulting in a tube count reduction of nearly 30:1. Other tube diameters still need to be simulated.
1.00 1.05 1.10 1.15 1.20 1.25 1.30
0 1000 2000 3000 4000 5000 6000 7000 8000 9000
10 30 50 70 90 110
C
OPh
Ou
tp
u
t
h
ea
ti
n
g
p
o
w
er
p
er
u
n
it
v
o
lu
m
e
(k
W
/m
3)
Half heating/cooling time (s)
Power - Time rec. = 0s - Low hw
Figure 12: COP and SCP for 208C + lignin carbon with a range of control times with high water side heat transfer, 3mm OD tubing and a range of pitches
5.5.
Geometries comparison
The envelopes of the best case of shell and tube, Figure 7, and a case of finned tube have been plotted together in Figure 13 for comparison along with its heating/cooling and recovery times.
The tube in both examples has an outer radius of 0.6 mm and an inner radius of 0.4 mm and the sorption material modelled is the same, lignin-carbon composite. In the case of the finned tube the fin thickness is 0.1 mm and the carbon thickness between fins is 2 mm. In the shell and tube case, the tube pitch is 3 mm whilst in the finned tube case, the tube pitch is 8 mm.
Both cases show similar performance, having the finned tube case slightly higher COP but the interesting thing to highlight is that due to the difference in tube pitches, the finned tube generator would need 7 times fewer tubes than the shell and tube one in order to obtain similar performance which would reduce their manufacturing cost.
Figure 13: COP v. Output power comparison of shell and tube and finned tube generators with carbon + lignin composite
1.15 1.17 1.19 1.21 1.23 1.25 1.27 1.29 1.31 1.33 1.35
0 1000 2000 3000 4000 5000 6000 7000
C
OPh
Output power per unit volume (kW/m3)
Pitch = 6 mm Pitch = 8 mm Pitch = 10 mm Pitch = 12 mm Pitch = 16 mm Envelope - Pitch = 6 mm Envelope - Pitch = 8 mm Envelope - Pitch = 10 mm Envelope - Pitch = 12 mm Envelope - Pitch = 16 mm
20,0 40,15
60,25 200,30
20,0 35,15
50,30 200,30
1.15 1.17 1.19 1.21 1.23 1.25 1.27 1.29 1.31 1.33 1.35
0 1000 2000 3000 4000 5000 6000 7000
C
OPh
Output power per unit volume (kW/m3)
[image:11.595.93.518.493.677.2]6.
Conclusions
The thermal conductivity of three different carbon composites has been measured and they perform much better compared to a vibrated bed of carbon granules that has typically a thermal conductivity of 0.1 K/(mK) and a density of 575 kg/m3.
The samples that showed the highest thermal conductivities are the ones corresponding to 50% weight ENG (circled in turquois in Figure 14) but when they are plotted v. the carbon density of the sample they only reach a maximum of 450 kg/m3 which results in a low amount of refrigerant cycled, low COP of the system.
The samples that have a 25% weight of graphite (circled in purple in Figure 14) achieve relatively high thermal conductivities and they reach a better carbon density of 620 kg/m3.
The samples that perform with lowest thermal conductivities but highest carbon densities correspond to the lignin and silane composites (circled in orange in Figure 14). Silane composite samples show lower thermal conductivities and lower carbon densities that the lignin ones.
Figure 14: Thermal conductivity v. carbon density of all the samples tested (A-Anter, F-HyperFlash)
Regarding the optimisation of the dimensions of the existing generator design, they seem to be close to the optimum for a shell and tube generator but they have inherent cost and reliability challenges. It is possible that finned tube designs with larger tube OD could be significantly lower cost in production and offer equivalent performance if the heat transfer in the water side is improved by the use of turbulators.
Further work will be done to establish a preferred fin and tube design and then to test it in a large temperature jump apparatus before attempting to build a full sized generator for evaluation in a kW scale machine.
The preferred carbon composite to use in a future generator is the 208C carbon + lignin, mixture of grains and powder. Although its thermal conductivity is lower compared to the ENG composites which means that cycle times will be longer, it contains a 67% more carbon which means the heat pump can perform with higher COP’s as it can be observed in Figure 8.
ACKNOWLEDGEMENTS
We would like to thank Chemviron Carbon for supplying the carbon and the organic binder used in the experiments, Fraunhofer ISE for carrying out the measurements with the LFA 467 HyperFlash machine and
0.00 0.50 1.00 1.50 2.00 2.50 3.00 3.50
300 400 500 600 700 800
T
h
er
m
a
l
co
n
d
u
ct
iv
it
y
(
W
/(
m
K)
)
Carbon density (kg/m3)
F - Silane + (Grains 67% + Powder 33%) A - Silane + (Grains 67% + Powder 33%) F - Lignin + (Grains 67% + Powder 33%) A - Lignin + (Grains 67% + Powder 33%) F - Lignin + Grains 100%
A - Lignin + Grains 100% F - Lignin + Powder 100% A - Lignin + Powder 100%
F - ENG 25% + (Grains 67% + Powder 33%) 75% A - ENG 25% + (Grains 67% + Powder 33%) 75% F - ENG 50% + (Grains 67% + Powder 33%) 50% A - ENG 50% + (Grains 67% + Powder 33%) 50% F - ENG 50% + Grains 50%
Lucio Bonaccorsi (Mediterranea University of Reggio Calabria) and Dorotea Spadaro (University of Warwick) for their help with the silane binder development.
NOMENCLATURE
T refrigerant/adsorbent temperature (K) Tsat saturation temperature (K)
x adsorbed refrigerant concentration (kg/kg) x0 maximum (limiting) concentration (kg/kg)
K constant
N constant
REFERENCES
[1] R. E. Critoph, S. Metcalf, Development of a Domestic Adsorption Gas-fired Heat Pump, Proc. Inst. R. (2011-12) 1.1 – 1.7.
[2] H. P. Klein, M. Groll, Heat transfer characteristics of expanded graphite matrices in metal hydride beds. International Journal of Hydrogen Energy 29 (2004) 1503–1511.
[3] D. Menard, X. Py, N. Mazet, Activated carbon monolith of high thermal conductivity for adsorption processes improvement, Part A: Adsorption step. Chemical Engineering and Processing 44 (2005) 1029–1038.
[4] L. W. Wang, Z. Tamainot-Telto, S. J. Metcalf, R. E. Critoph, R. Z. Wang, Anisotropic thermal conductivity and permeability of compacted expanded natural graphite. Applied Thermal Engineering 30 (2010) 1805–181.
[5] Z. Jin, B. Tian, L. Wang, R. Wang, Comparison on thermal conductivity and permeability of granular and consolidated activated carbon for refrigeration, Chinese Journal of Chemical Engineering 21 (2013) 676–682.
[6] Z. Tamainot-Telto, R. E. Critoph, Monolithic carbon for sorption refrigeration and heat pump applications, Applied Thermal Engineering 21 (2001) 37–52.
[7] G. Restuccia, A. Freni, F. Russo, S. Vasta, Experimental investigation of a solid adsorption chiller based on a heat exchanger coated with hydrophobic zeolite, Applied Thermal Engineering 25 (2005) 1419–1428.
[8] S. D. Waszkiewicza, M. J. Tierney, H. Saidani Scott, Development of coated, annular fins for adsorption chillers, Applied Thermal Engineering 29 (2009) 2222–2227.