Thesis by Nicholas Boekelheide
In Partial Fulfillment of the Requirements for the Degree of
Doctor of Philosophy
California Institute of Technology Pasadena, California
2013
c 2013 Nicholas Boekelheide
Acknowledgements
First, thank you to Tom Miller, my advisor. His support, guidance, and encourage-ment have contributed a great deal to my developencourage-ment as a scientist over the last five years. He taught me how to think about the problems I find most interesting. I would also like to thank the chemistry division faculty. Particularly, I thank my thesis committee, Harry Gray, Rudy Marcus, and Shu-ou Shan for their time, advice and help planning for the future. I also thank Mitchio Okumura and Doug Rees. I appreciated working with them my first year and their interest in what I’ve done since. Also, I remember Aron Kuppermann for his articulate, detailed teaching of quantum mechanics and friendly conversations outside of class.
Thank you to the division administrative sta↵, particularly Priscilla Boon who does so much to support the Miller group and the chemical physics subdivision.
I appreciate the friendship and support of the Miller Group. Bin, Artur, Jason, Josh, Taylor, Connie, Mike, Michiel, Nandini, Romeila, Kuba, Fran, and Frank, I couldn’t have had better officemates. Feedback on talks and papers and help developing my ideas taught me so much. I’ve enjoyed all the scientific discussions, walks for co↵ee, and fun we’ve had. Thank you as well to my friends outside the Miller Group who were there to help me unwind.
I also thank the teachers and students who I mentored with the Caltech Class-room Connection, Christine Kye, Phil Sang, Darius Hines, and Kyle Priver. Addi-tionally, I thank James Maloney and Sherry Tsai, the coordinators of the Caltech Classroom Connection. I enjoyed our work together and the opportunity to explore education in the sciences beyond Caltech.
Thank you to my family—my parents, my brothers and the Bergmanns. I’m not sure what you guys thought of what Kristin and I did, but we knew you were there for us, and that helped.
Quantum Simulation of Enzyme Catalysis
by
Nicholas Boekelheide
In Partial Fulfillment of the Requirements for the Degree of
Doctor of Philosophy
Abstract
Separating the dynamics of variables that evolve on di↵erent timescales is a com-mon assumption in exploring complex systems, and a great deal of progress has been made in understanding chemical systems by treating independently the fast processes of an activated chemical species from the slower processes that proceed activation. Protein motion underlies all biocatalytic reactions, and understand-ing the nature of this motion is central to understandunderstand-ing how enzymes catalyze reactions with such specificity and such rate enhancement. This understanding is challenged by evidence of breakdowns in the separability of timescales of dynam-ics in the active site form motions of the solvating protein. Quantum simulation methods that bridge these timescales by simultaneously evolving quantum and classical degrees of freedom provide an important method on which to explore this breakdown. In the following dissertation, three problems of enzyme catalysis are explored through quantum simulation.
In Chapter 2, we explore the mechanistic origin of temperature independent kinetic isotope e↵ects in enzyme catalysis. By enabling the characterization of the ensemble of reactive paths, quantum simulations reveal transient compression of the donor and acceptor atoms that is independent of the mass of the transferred hydride, thus strengthening the mechanistic interpretation of this general feature of enzyme catalysis.
Contents
1 Dynamics and Dissipation in Enzyme Catalysis 1
1.1 Introduction . . . 1
1.2 Results and Discussion . . . 5
1.3 Concluding Remarks . . . 10
1.4 Methods . . . 11
1.4.1 Calculation details . . . 11
1.4.2 Ring polymer molecular dynamics . . . 11
1.4.3 Calculating the statistical correlation functions,cij . . . 11
1.4.4 The transition path ensemble . . . 12
2 Quantum Simulation of Temperature Independent Kinetic Iso-tope E↵ects in Enzyme Catalysis 18 2.1 Introduction . . . 18
2.2 Methods . . . 20
2.2.1 Ring polymer molecular dynamics . . . 20
2.2.2 Calculation details . . . 23
2.3 Results . . . 29
2.3.1 RPMD rates and KIEs . . . 29
2.3.2 Mass dependence of organization of the enzyme . . . 30
2.3.3 Temperature dependence of classical barrier position . . . . 32
2.3.4 Dynamical correlations . . . 33
3 Promoting Modes in Lactate Dehydrogenase 44
3.1 Introduction . . . 44
3.2 Methods . . . 46
3.2.1 Ring polymer molecular dynamics . . . 46
3.2.2 Calculation details . . . 46
3.3 Results and Discussion . . . 52
3.4 Conclusion . . . 55
A Appendix 1: Supplemental Information for Chapter 1 61 A.1 Potential Energy Surface . . . 61
A.2 Calculation Details . . . 62
A.3 Free Energy Sampling . . . 63
A.4 The Dividing Surface Ensemble . . . 65
A.5 Calculation of the Transmission Coefficient . . . 66
A.6 Additional Measures of Dynamical Correlations . . . 67
B Appendix 2: Supplemental Information for Chapter 2 80 B.1 Potential Energy Surface . . . 80
List of Figures
1.1 The hydride transfer reaction catalyzed by DHFR . . . 3 1.2 Statistical and dynamical correlations among enzyme motions
dur-ing the intrinsic reaction . . . 4 1.3 Dynamical correlation measures . . . 7 1.4 Minimum free energy pathways and the mean pathway of the
reac-tive trajectories . . . 9
2.1 The independence of the RMPD with the choice of dividing surface 21 2.2 Temperature dependence of simulated and experimental KIEs . . . 30 2.3 Donor-acceptor distance in the equilibrium ensembles and during
the intrinsic reaction . . . 31 2.4 The temperature dependent shift in classical reaction barrier position 32 2.5 Dynamical correlations among enzyme motions during the intrinsic
reaction involving hydrogen at 300K . . . 33 2.6 Nuclear quantum e↵ects at the transition state . . . 35
3.1 The crystal structure of human heart lactate dehydrogenase isozyme 45 3.2 The QM region of the LDH system . . . 47 3.3 FE surface ⇥Pand ⇥H using the AM1 QM/MM potential . . . 52
3.4 AM1 and AM1-SRP energies of the training set used for SRP opti-mization plotted versus MP2 energies . . . 53 3.5 FE surface ⇥Pand ⇥H using the AM1-SRP QM/MM potential . . 54
A.1 The active site region of the DHFR enzyme . . . 69 A.2 The quantized and classical free energy profiles for the reaction . . 70 A.3 Covariance and dynamical correlation amongst all atoms . . . 70 A.4 Alternative measures of the dynamical correlation . . . 71 A.5 The measure of temporally non-local dynamical correlations . . . . 72 A.6 Other measures of dynamical correlations . . . 73 A.7 Modifications to the GROMOS 43A1 united atom forcefield . . . . 74 A.8 Tests of the degree to which the weak harmonic restraints impact
the dynamics of the reactive trajectories . . . 75 A.9 Free energy profiles obtained with and without swapping of
config-urations . . . 75
List of Tables
2.1 Enzymes exhibiting temperature independent kinetic isotope e↵ects 20 2.2 Hydride transfer rates and terms for each temperature and mass . 29
A.1 The umbrella sampling parameters . . . 76
B.1 The umbrella sampling parameters . . . 82
C.1 Semi-empirical parameters from AM1 and AM1-SRP data sets . . 83 C.2 The umbrella sampling parameters for 1D sampling with AM1-SRP
Chapter 1
Dynamics and Dissipation in Enzyme
Catalysis
We use quantized molecular dynamics simulations to characterize the role of en-zyme vibrations in facilitating dihydrofolate reductase hydride transfer. By sam-pling the full ensemble of reactive trajectories, we are able to quantify and distin-guish between statistical and dynamical correlations in the enzyme motion. We demonstrate the existence of non-equilibrium dynamical coupling between protein residues and the hydride tunneling reaction, and we characterize the spatial and temporal extent of these dynamical e↵ects. Unlike statistical correlations, which give rise to nanometer-scale coupling between distal protein residues and the in-trinsic reaction, dynamical correlations vanish at distances beyond 4-6 ˚A from the transferring hydride. This work suggests a minimal role for non-local vibrational dynamics in enzyme catalysis, and it supports a model in which nanometer-scale protein fluctuations statistically modulate—or gate—the barrier for the intrinsic reaction.
1.1
Introduction
fluctua-tions that occur in the protein environment of the active site. The textbook view of enzyme-catalyzed reaction mechanisms neglects the functional role of such fluctua-tions and describes a static protein environment that both sca↵olds the active site region and reduces the reaction barrier [3]. This view has grown controversial amid evidence that active site chemistry is coupled to motions in the enzyme [4, 5, 6], and it has been explicitly challenged by recent proposals that enzyme-catalyzed re-actions are driven by vibrational excitations that channel energy into the intrinsic reaction coordinate [7, 8] or promote reactive tunneling [9, 10]. In the following, we combine quantized molecular dynamics and rare-event sampling methods to reveal the mechanism by which protein motions couple to reactive tunneling in dihydro-folate reductase and to clarify the role of non-equilibrium vibrational dynamics in enzyme catalysis.
NADPH
DHF+
H
-A
-200 -100 0 100 200 (kcal/mol) 0
-5 5 10 15
B
F(
) (kcal/mol)
0.0 0.2 0.4 0.6 0.8 1.0
0 20 40 60 80 100
C
Time (fs)
T
ransmission Coef
[image:13.612.192.418.103.385.2]ficient
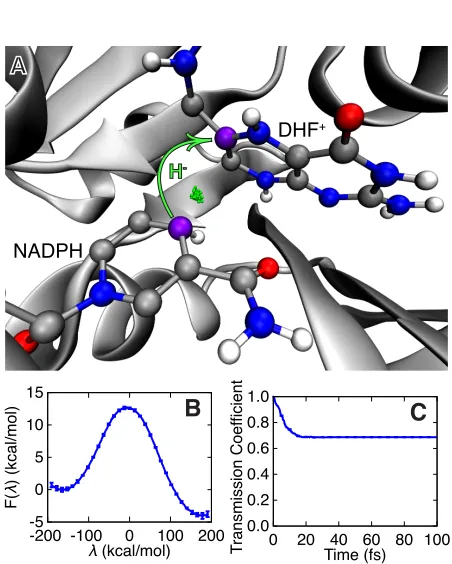
Figure 1.1: The hydride transfer reaction catalyzed by DHFR. (A) The active site with the hydride (green) shown in the ring-polymer representation of the quantized MD and the donor and acceptor C atoms in purple. (B) The quantized free energy profile for the reaction. (C) The time-dependent transmission coefficient corresponding to the dividing surface at (x) = 4.8 kcal/mol.
Reactant Dividing surface Product Dynamical correlation Statistical correlation 40 80 120 C residue number 1.0 / 0.12
-1.0 / -0.12
A A
D
D
A E
40 80 120 A D 40 80 120 A D
40 80 120 A D
-0.4 -0.2 0 0.2 0.4 dij (t)
-400 -200 0 200 400 t (fs)
-400 -200 0 200 400 t (fs)
-400 -200 0 200 400 t (fs)
B C D
D H A
D H A
R2 R1
D H A
R2 R
[image:14.612.112.496.112.318.2]1
Figure 1.2: Statistical and dynamical correlations among enzyme motions during the intrinsic reaction. (A) (Upper triangles) The covariance cij among position
fluctuations in DHFR, plotted for the reactant, dividing surface, and product regions. Protein residues are indexed according to PDB 1RX2; substrate and cofactor regions are indicated by the hydride acceptor A and donor D atoms, respectively. (Lower triangles) The di↵erence with respect to the plot for the reac-tant basin. (B-D) The dynamical correlation measuredij(t) for (B) the donor and
acceptor atom pair, (C) the substrate-based C7 and acceptor atom pair, and (D) the cofactor-based CN3 and donor atom pair. Results for additional atom pairs are presented in Figure A.8. (E) (Upper triangle) The integrated dynamical cor-relation measure dij, indexed as in (A). Significant dynamical correlations appear
primarily in the substrate and cofactor regions, which are enlarged in the lower triangle.
is obtained from an e↵ective Hamiltonian matrix, with diagonal elements (Vr(x)
and Vp(x)) corresponding to the potential energy for the reactant and product
sur-face F( ) is obtained using over 120 ns of RPMD sampling (Figure 1.1B), and the transmission coefficient is obtained from over 5000 RPMD trajectories that are released from the Boltzmann distribution constrained to the dividing surface (Figure 1.1C). In contrast to mixed quantum-classical and transition state theory methods, RPMD yields reaction rates and mechanisms that are formally indepen-dent of the choice of dividing surface or any other reaction coordinate assumption [22]. Furthermore, the RPMD method enables generation of the ensemble of reac-tive, quantized molecular dynamics trajectories, which is essential for the following analysis of dynamical correlations. Calculation details, including a description of the rare-event sampling methodology used to generate the unbiased ensemble of reactive trajectories [24, 25], are provided in below.
1.2
Results and Discussion
The time-dependence of the transmission coefficient in Figure 1.1C confirms that reactive trajectories commit to the reactant or product basins within 25 fs. The near-unity value of this transmission coefficient at long times indicates that re-crossing of the dividing surface in reactive trajectories is a modest e↵ect, although it is fully accounted for in this study, and it confirms that the collective variable (x) provides a good measure of progress along the intrinsic reaction. We find that quantization of the hydride lowers the FE barrier by approximately 3.5 kcal/mol (Figure A.5), in agreement with earlier work [26, 27].
Statistical correlations among the protein and enzyme active site coordinates are shown in Figure 1.2A. The normalized covariance among atom position fluc-tuations, cij =Cij/(CiiCjj)1/2 such that
Cij =h(xi hxii)·(xj hxji)i, (1.1)
corre-lation plots are provided in Figure A.6. As has been previously emphasized [11], structural fluctuations in the active site and distal protein residues are richly cor-related within each region, which contributes to non-additive e↵ects in the kinetics of DHFR mutants [28, 14]. Furthermore, the network of correlations varies among the three ensembles, indicating that fluctuations in distal protein residues respond to the adiabatic progress of the hydride from reactant to product. However, these time-averaged quantities do not address the role of dynamical correlations between the transferring hydride and its environment, which depend on the hierarchy of timescales for motion in the system.
To characterize dynamical correlations in the intrinsic reaction, we introduce a measure of velocity cross-correlations in the reactive trajectories,
dij(t) =Dij(t)/(Dii(t)Djj(t))1/2 such that
Dij(t) =hvi·vjit. (1.2)
Here, h...it denotes an average over the non-equilibrium ensemble of phase-space points that lie on reactive trajectories which crossed the dividing surface some time t earlier and subsequently terminate in the product basin. This quantity, which vanishes for the equilibrium ensemble, reports on the degree to which atoms move in concert during the intrinsic reaction step. Figure 1.2B-D show dij(t) for
several atomic pairs in the active site. Negative dynamical correlations are seen between the donor and acceptor C atoms (Figure 1.2B), which move in opposite directions (first approaching each other, then moving apart) during the hydride transfer. Similarly, positive correlations are seen between atom pairs on the cofac-tor (Figure 1.2C) and on the substrate (Figure 1.2D) which move in concert as the hydride is transferred. In each case, the primary features of the correlation decay within ⌧ = 100 fs.
Figure 1.2E summarizes the extent of dynamical correlations throughout the enzyme system in terms of dij =R⌧⌧dij(t)dt.Only atoms in the substrate and
x y z
0.0 0.4 0.8
D -0.2 0.0 0.2 0.4 0.6 0.8 1.0
0 5 10 15 20 25
E 0.0 0.2 0.4 0.6 0.8 1.0 Side chain Backbone Substrate/cofactor
Distance from active site (Å)
0 5 10 15 20 25
-5 0 5 10 15 0 100 -100 t (fs)
-200 200
0 100 -100
t (fs)
-200 200
0 100 -100
t (fs)
-200 200
[image:17.612.219.392.100.396.2]B = x y z OH Y100 A D H H A C
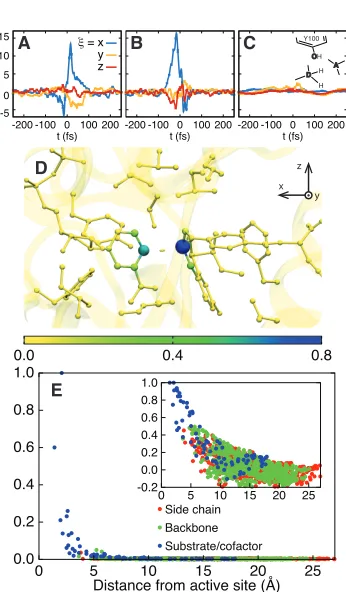
Figure 1.3: The dynamical correlation measure fi⇠(t), plotted for (A) the donor atom, (B) the acceptor atom, and (C) the side-chain O atom in the Y100 residue of the active site. (D) The size and color of atoms in the active site region are scaled according to the integrated dynamical correlation measure, fi. (E) (main panel)
The integrated dynamical correlation measure, fi, as a function of the distance of
atom ifrom the midpoint of the donor and acceptor atoms. (inset) The statistical correlation measure, ¯ci, is similarly presented. Atoms corresponding to the protein
side chains, the protein backbone, and the substrate/cofactor regions are indicated by color. Values presented in part A are in units of nm/ps, and values in parts D and E are normalized to a maximum of unity. The estimated error in part E is smaller than the dot size.
the active site region exhibit appreciable signal. The same conclusions are reached upon integrating the absolute value of the dij(t) (Figure A.7), emphasizing that
and for dynamical correlations that are non-local in time (Figure A.8), but the fol-lowing conclusion is unchanged. The extensive network of statistical correlations (Figure 1.2A) is neither indicative of, nor accompanied by, an extensive network of dynamical correlations during the intrinsic reaction (Figure 1.2E).
A combined measure of the dynamical correlation between a given atom and the intrinsic reaction event can be obtained from the non-equilibrium ensemble average of velocities in the reactive trajectories. Specifically, we consider fi⇠(t) =
D
vi⇠· (x)E
t, where⇠ 2{x,y,z}indicates the component of the velocity, the filter
(x) = ¯ | (x)| /¯ selects configurations in the region of the dividing surface,
and ¯ = 177 kcal/mol is the average magnitude of (x) in the reactant and product regions. Each component of fi(t) vanishes trivially at equilibrium. Figure
1.3A-C presents the measure for various atoms in the active site region. The donor and acceptor C atoms (Figure 1.3A and B) are both strongly correlated with the dynamics of the intrinsic reaction, whereas the O atom in the Y100 residue of the active site (Figure 1.3C) reveals smaller, but non-zero, signatures of dynamical correlation. Figure 1.3D presents fi =
R⌧
⌧|fi(t)|2dt for each atom, summarizing
the degree to which all atoms in the active site exhibit dynamical correlations, and Figure 1.3E compares the correlation lengthscales in the enzyme. The main panel in Figure 1.3E presents fi as a function of the distance of heavy atoms from
the midpoint of the hydride donor and acceptor, and the inset similarly presents the distance dependence of the statistical correlation measure ¯ci = (ciµ+ci⌫)/2,
where cij is defined previously and where indices µ and ⌫ label the donor and
acceptor carbon atoms, respectively. Whereas the statistical correlations reach the nanometer lengthscale and involve the protein environment, dynamical correlations are extremely local in nature and primarily confined to the enzyme substrate and cofactor.
Figure 1.4 illustrates that dynamical correlations in the intrinsic reaction are limited by disparities in the relative timescales for enzyme motion. The figure presents two-dimensional projections of the FE surface,F( ,⇥↵), where↵2{1,2},
2.8 3.0 3.2 3.4
1
-200 -100 0 100 200 5.2
5.4 5.6 5.8
2
0 5 10 15 20
F( ,
[image:19.612.213.395.82.450.2]B
A
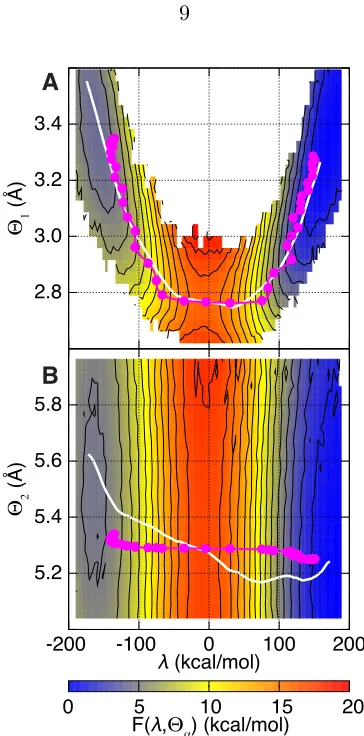
Figure 1.4: Minimum free energy pathways (s, white) and the mean pathway of the reactive trajectories ( , magenta) overlay two-dimensional projections of the free energy landscape, F( ,⇥↵). (A) F( ,⇥1), where ⇥1 is the distance between the
hydride donor and acceptor atoms. (B)F( ,⇥2), where⇥2is the distance between
side-chain atoms I14 C and Y100 O in the active site residues. The non-zero slope insand indicates statistical and dynamical correlations, respectively.
separation between active site protein atoms I14 C and Y100 O (side chain). Overlaid on the surfaces are the minimum FE pathway between the reactant and product basins, s, and the time-parameterized pathway followed by the ensemble of reactive trajectories, = (h (x)it,h⇥↵(x)it). Non-zero slope in s indicates
statistical correlation of⇥↵with , whereas the same feature in indicates that the
donor-acceptor distance is both statistically and dynamically correlated with the intrinsic reaction. In contrast, Figure 1.4B reveals significant statistical correlation between ⇥2 and the intrinsic reaction, but the reactive trajectories traverse the
dividing surface region on a timescale that is too fast to dynamically couple to the protein coordinate.
1.3
Concluding Remarks
confirm the generality of the conclusions drawn here.
1.4
Methods
1.4.1 Calculation details
All simulations are performed using a modified version of the Gromacs-4.0.7 molec-ular dynamics package [32]. Further calculation details regarding the potential energy surface, the system initialization and equilibration protocol, free-energy sampling, and dividing surface sampling are provided in Appendix A.
1.4.2 Ring polymer molecular dynamics
The RPMD equations of motion [21] used to simulate the dynamics of DHFR are
¨
qj =
1
nmn
⇥
kn(qj+1+qj 1 2qj) rqjU(qj,Q1, . . . ,QN)
⇤ ,
j= 1, ..., n (1.3)
¨
Qk=
1
nMk n
X
j=1
rQkU(qj,Q1, . . . ,QN), k= 1, ..., N (1.4)
where U(q,Q1, . . . ,QN) is the potential energy function for the system, n = 32
is the number of ring polymer beads used to quantize the hydride, qj andmn are
the position and mass of the jth ring polymer bead, and q0=qn. Similarly, N is
the number of classical nuclei in the system, andQkand Mk are the position and
mass of the kthclassical atom, respectively. The inter-bead force constant iskn= mHn2/( ¯h)2, wheremH= 1.008 amu is the mass of the hydride and = (kBT) 1
is the reciprocal temperature; a temperature ofT = 300 K is used throughout the study. For dynamical trajectories, RPMD prescribes that mn=mH/n.
1.4.3 Calculating the statistical correlation functions, cij
ensemble averages are strictly defined using
hAi ⇤ =
Z ⇤+
⇤
d 0P( 0)
Z
dq1. . . Z
dqn
Z
dQ1. . . Z
dQN
⇥ ( 0 (x))A(q1, . . . ,qn,Q1, . . . ,QN), (1.5)
where P( ) = exp( F( ))/Rd 0exp( F( 0)), and F( ) is calculated using umbrella sampling, as described in the SI. For the ensembles in the reactant, dividing surface, and product regions, we employ ⇤= -181 kcal/mol, -7 kcal/mol, and 169 kcal/mol, respectively, and = 2.5 kcal/mol.
1.4.4 The transition path ensemble
Reactive trajectories are generated through forward- and backward-integration of initial configurations drawn from the dividing surface ensemble with initial veloci-ties drawn from the Maxwell-Boltzmann distribution. Reactive trajectories corre-spond to those for which forward- and backward-integrated half-trajectories ter-minate on opposite sides of the dividing surface. From the 10,500 half-trajectories that are initialized on the dividing surface (i.e., 5,250 possible reactive trajecto-ries), over 3,000 reactive RPMD trajectories are obtained. For analysis purposes, the integration of these reactive trajectories was continued for a total length of one ps in both the forward and backward trajectories.
The reactive trajectories that are initialized from the equilibrium Boltzmann distribution on the dividing surface must be reweighted to obtain the unbiased ensemble of reactive trajectories (i.e., the transition path ensemble) [25, 33, 24]. A weighting term is applied to each trajectory ↵, correctly accounting for the recrossing and for the fact that the trajectories are performed in the microcanonical ensemble [24],
w↵=
X
intersectionsi
˙
i
1! 1
(1.6)
References
[1] K. A. Henzler-Wildman, V. Thai, M. Lei, M. Ott, M. Wolf-Watz, T. Fenn, E. Pozharski, M. A. Wilson, G. A. Petsko, M. Karplus, C. G. Hubner, and D. Kern. Intrinsic motions along an enzymatic reaction trajectory. Nature, 450:838–844, 2007.
[2] D. D. Boehr, D. McElheny, H. J. Dyson, and P. E. Wright. Millisecond timescale fluctuations in dihydrofolate reductase are exquisitely sensitive to the bound ligands. Proc. Natl. Acad. Sci. U.S.A., 107(4):1373–1378, 2010.
[3] Paul F. Cook and W. W. Cleland. Enzyme kinetics and mechanism. Garland Science, New York, 2007.
[4] S. C. L. Kamerlin and A. Warshel. At the dawn of the 21stcentury: Is dynam-ics the missing link for understanding enzyme catalysis? Proteins, 78(6):1339– 1375, 2010.
[5] V. C. Nashine, S. Hammes-Schi↵er, and S. J. Benkovic. Coupled motions in enzyme catalysis.Curr. Opin. Chem. Biol., 14(5):644–651, 2010.
[6] M. Garcia-Viloca, J. Gao, M. Karplus, and D. G. Truhlar. How enzymes work: Analysis by modern rate theory and computer simulations. Science, 303(5655):186–195, 2004.
[7] S. D. Schwartz and V. L. Schramm. Enzymatic transition states and dynamic motion in barrier crossing. Nature Chem. Biol., 5(8):552–559, 2009.
chemical barrier and tunneling in enzymes. J. Phys. Org. Chem., 23(7):690– 695, 2010.
[9] L. Masgrau, A. Roujeinikova, L. O. Johannissen, P. Hothi, J. Basran, K. E. Ranaghan, A. J. Mulholland, M. J. Sutcli↵e, N. S. Scrutton, and D. Leys. Atomic description of an enzyme reaction dominated by proton tunneling.
Science, 312(5771):237–241, 2006.
[10] Z. D. Nagel and J. P. Klinman. A 21st century revisionist’s view at a turning point in enzymology.Nature Chem. Biol., 5(8):543–550, 2009.
[11] P. K. Agarwal, S. R. Billeter, P. T. R. Rajagopalan, S. J. Benkovic, and S. Hammes-Schi↵er. Network of coupled promoting motions in enzyme catal-ysis.Proc. Natl. Acad. Sci. U.S.A., 99(5):2794–2799, 2002.
[12] J. Y. Pang, J. Z. Pu, J. L. Gao, D. G. Truhlar, and R. K. Allemann. Hydride transfer reaction catalyzed by hyperthermophilic dihydrofolate reductase is dominated by quantum mechanical tunneling and is promoted by both inter-and intramonomeric correlated motions. J. Am. Chem. Soc., 128(24):8015– 8023, 2006.
[13] T. H. Rod, J. L. Radkiewicz, and C. L. Brooks. Correlated motion and the e↵ect of distal mutations in dihydrofolate reductase. Proc. Natl. Acad. Sci. U.S.A., 100(12):6980–6985, 2003.
[14] K. F. Wong, T. Selzer, S. J. Benkovic, and S. Hammes-Schi↵er. Impact of dis-tal mutations on the network of coupled motions correlated to hydride transfer in dihydrofolate reductase.Proc. Natl. Acad. Sci. U.S.A., 102(19):6807–6812, 2005.
[15] L. Wang, S. Tharp, T. Selzer, S. J. Benkovic, and A. Kohen. E↵ects of a distal mutation on active site chemistry.Biochemistry, 45(5):1383–1392, 2006.
[17] C. R. Pudney, S. Hay, C. Levy, J. Y. Pang, M. J. Sutcli↵e, D. Leys, and N. S. Scrutton. Evidence to support the hypothesis that promoting vibrations enhance the rate of an enzyme catalyzed h-tunneling reaction.J. Am. Chem. Soc., 131(47):17072–17073, 2009.
[18] E. J. Loveridge, L. H. Tey, and R. K. Allemann. Solvent e↵ects on catalysis byEscherichia coli dihydrofolate reductase.J. Am. Chem. Soc., 132(3):1137– 1143, 2010.
[19] S. Saen-Oon, S. Quaytman-Machleder, V. L. Schramm, and S. D. Schwartz. Atomic detail of chemical transformation at the transition state of an enzy-matic reaction. Proc. Natl. Acad. Sci. U.S.A., 105(43):16543–16548, 2008.
[20] P. Ball. Enzymes—By chance, or by design? Nature, 431(7007):396–397, 2004.
[21] I. R. Craig and D. E. Manolopoulos. Quantum statistics and classical mechan-ics: Real time correlation functions from ring polymer molecular dynamics.
J. Chem. Phys., 121(8):3368–3373, 2004.
[22] I. R. Craig and D. E. Manolopoulos. A refined ring polymer molecular dynam-ics theory of chemical reaction rates.J. Chem. Phys., 123(3):034102, 2005.
[23] A. Warshel and R. M. Weiss. An empirical valence bond approach for compar-ing reactions in solutions and in enzymes.J. Am. Chem. Soc., 102(20):6218– 6226, 1980.
[24] G. Hummer. From transition paths to transition states and rate coefficients.
J. Chem. Phys., 120(2):516–523, 2004.
[25] P. G. Bolhuis, D. Chandler, C. Dellago, and P. L. Geissler. Transition path sampling: Throwing ropes over rough mountain passes, in the dark. Annu. Rev. Phys. Chem., 53:291–318, 2002.
[27] M. Garcia-Viloca, D. G. Truhlar, and J. L. Gao. Reaction-path energetics and kinetics of the hydride transfer reaction catalyzed by dihydrofolate reductase.
Biochemistry, 42(46):13558–13575, 2003.
[28] P. T. R. Rajagopalan, S. Lutz, and S. J. Benkovic. Coupling interactions of distal residues enhance dihydrofolate reductase catalysis: Mutational e↵ects on hydride transfer rates.Biochemistry, 41(42):12618–12628, 2002.
[29] E. Neria and M. Karplus. Molecular dynamics of an enzyme reaction: Proton transfer in TIM.Chem. Phys. Lett., 267(1-2):23–30, 1997.
[30] J. Z. Pu, S. H. Ma, M. Garcia-Viloca, J. L. Gao, D. G. Truhlar, and A. Kohen. Nonperfect synchronization of reaction center rehybridization in the transition state of the hydride transfer catalyzed by dihydrofolate reductase. J. Am. Chem. Soc., 127(42):14879–14886, 2005.
[31] Q. Cui and M. Karplus. Quantum mechanics/molecular mechanics studies of triosephosphate isomerase-catalyzed reactions: E↵ect of geometry and tunnel-ing on proton-transfer rate constants.J. Am. Chem. Soc., 124(12):3093–3124, 2002.
[32] B. Hess, C. Kutzner, D. van der Spoel, and E. Lindahl. GROMACS 4: Algo-rithms for highly efficient, load-balanced, and scalable molecular simulation.
J. Chem. Theory. Comput., 4(3):435–447, 2008.
Chapter 2
Quantum Simulation of Temperature
Independent Kinetic Isotope E
↵
ects in
Enzyme Catalysis
A temperature independent kinetic isotope e↵ect (KIE) of hydrogen transfer is feature of many wild type enzymes functioning at their optimal conditions on their natural substrates, yet this phenomenon is not predicted by simple reaction rate models. Here, we use ring polymer molecular dynamics to demonstrate tem-perature independent KIEs in the dihydrofolate reductase system and reveal that compression of the hydride donor and acceptor atoms during the reaction event leads to transient configurations for hydride transfer that are mass independent.
2.1
Introduction
transfer: wild-type enzymes functioning on their natural substrate in their opti-mal temperature range exhibit temperature independent KIEs. Examples of such temperature independence are summarized in Table 2.1. This temperature in-dependence challenges interpretation of reaction rates based on rate models that simply include zero point energy and tunneling corrections [1].
Model rate theories that predict temperature independent KIEs have been de-veloped [2, 3, 4]. The mechanistic interpretation of such temperature independence is that organization of the enzyme preceeds hydrogen transfer to an extent that is independent of hydrogen mass. This organization gives rise to an Arrhenius activation energy that is independent of mass; the magnitude of the KIE is due to mass dependent di↵erences in tunneling from the ground state. Alternatively, simulations based on the variational transition state theory (VTST) method [5] have shown that temperature independent KIEs arise due to a temperature de-pendent change in the classical dividing surface position. In these simulations, the Arrhenius activation energy is mass independent due to changes in the quantum e↵ects of barrier crossing with temperature which cancel most of mass dependent di↵erence in activation energy due to zero-point energy.
Enzyme H/D KIE Temperature range (K)
DHFR 3.5 278-318
tDHFR 4 298-338
TSOX 7 278-308
TMADH 7 278-298
MADH 17 278-313
AcCoA-DS 23 278-303
ThyS 7 278-313
SLO 81 283-323
tADH 3.2 303-338
Table 2.1: Enzymes exhibiting temperature independent KIEs on their natural sub-strate and conditions. DHFR, dihydrofolate reductase [7]; tDHFR, thermophilic alcohol dehydrogenase [8]; TSOX, sarcosine oxidase [9]; TMADH, trimethylamine dehydrogenase [10]; MADH, methylamine dehydrogenase [3]; AcCoA-DS, AcCoA desaturase [11]; ThyS, thymidylate synthase [12, 13]; SLO, soybean lipoxygenase [14]; tADH, thermophilic alcohol dehydrogenase [15, 16].
trajectories to elucidate the mechanistic origins of temperature independent KIEs.
2.2
Methods
2.2.1 Ring polymer molecular dynamics
The RPMD equations of motion for a system with a quantized hydride of massm
and N classical particles are [17, 18]
˙v(↵)=!2n⇣q(↵+1)+q(↵ 1) 2q(↵)⌘ 1
mrq(↵)Uext ⇣
q(↵),Q1, . . . ,QN
⌘
(2.1)
and
˙
Vj = 1 nMj
n
X
↵=1
rQjUext
⇣
q(↵),Q1, . . . ,QN
⌘
, (2.2)
cor--0.20 -0.15 -0.10 -0.05 0.00 0.1
1 10
-15 -10 -5 0 5 10
kTST kRPMD
[image:31.612.133.473.79.290.2](kcal/mol) H (Å)
Figure 2.1: RPMD rates are independent of the choice of dividing surface. Here, the rate of hydride transfer catalyzed by DHFR is calculated using two collective variable definitions of the dividing surface, and ⇥H, described in the text, at
three values for each coordinate. The ratio with respect to the dividing surface = 2.8 kcal/mol is shown for each term in the RPMD rate—the transmission coefficient (red) and the TST rate (green)–and the RPMD rate (blue). The independence of the RPMD rate is achieved as the larger TST rate is o↵set by a higher degree of recrossing.
responding mass Mj, and n is the number of imaginary time ring-polymer beads.
The intra-bead harmonic frequency is !n = n¯h where is the reciprocal
temper-ature. Uext q(↵),Q1, . . . ,QN is the potential energy function of the system, and
q(0) =q(n). Equations 2.1 and 2.2 generate classical dynamics that we employ as
a model for the real-time dynamics of the system [19]. In the limit of large n, these time-reversible dynamics preserve the exact Boltzmann distribution [20, 21, 22].
As in classical formulations of the thermal rate constant [23, 24, 25], the RPMD rate equation can be written as [26, 27]
kRPMD = lim
t!1(t)kTST. (2.3)
Here, kTST is the transition state theory (TST) approximation for the rate for
nuclei. The prefactoris the transmission coefficient that accounts for recrossing of trajectories through the dividing surface. As is the case for both exact classical and exact quantum dynamics, the RPMD method yields reaction rates and mechanisms that are independent of the choice of the dividing surface [26, 27, 28].
The TST rate in Equation 2.3 is calculated using [29, 30, 31, 32]
kTST = (2⇡ ) 1/2hg i‡
e F( ‡)
R ‡
1d e F( )
. (2.4)
Here, F( ) is the free energy (FE) along such that
e F( 0) = h ( (x) 0)i h ( (x) r)i
, (2.5)
where r is a reference point in the reactant region, and [29, 33]
g (x) =
" d X i=1 1 mi ✓
@ (x) @xi
◆2#1/2
, (2.6)
wherexi2{x}indicates either a ring-polymer bead or classical particle degree of
freedom, mi is the corresponding mass, and d is the total number of degrees of
freedom in the system. In Equation 2.5, h· · ·i denotes the equilibrium ensemble average
h· · ·i=
R
dxRdve Hn(x,v)(· · ·)
R
dxRdve Hn(x,v) , (2.7) and h· · ·i‡in Equation 2.4 denotes the average in the transition-state constrained ensemble
h· · ·i‡=
R
dxRdve Hn(x,v)(· · ·) (x) ‡
R
dxRdve Hn(x,v) ( (x) ‡). (2.8) Here,
Hn(x,v) = N
X
j=1
1 2MjV
2 j + n X ↵=1 1 2mb
⇣
v(↵)⌘2+Un(x), (2.9)
and
Un(x) =
1 n n X ↵=1 1 2m!
2
n
⇣
q(↵) q(↵ 1)⌘2+ 1
n n
X
↵=1
Uext(x(↵)) (2.10)
is the full potential energy function for the RPMD system where
x(↵) ⌘ (q(↵),Q
1, . . . ,QN) is used to indicate the position of ring polymer bead ↵ and the full set of classical nuclei.
The transmission coefficient in Equation 2.3 is obtained from the flux-side correlation function [26, 27],
(t) =
D
˙
0h (xt) ‡
E
‡
D
˙0h⇣˙0⌘E ‡
(2.11)
by releasing trajectories from the transition-state constrained ensemble. Here, h
is the Heaviside function, ˙0 is the time derivative of upon initialization of the
RPMD trajectory from the dividing surface with initial velocities sampled from the Maxwell-Boltzmann distribution, and xt is the time-evolved position of the
system along the RPMD trajectory.
2.2.2 Calculation details
RPMD simulations of DHFR were performed using a modified version of the Gromacs-4.5.5 molecular dynamics package [34] at three temperatures spanning the range of experimental KIEs: 280, 300, and 320K. At each temperature, the reaction was simulated with the mass of the transferring hydride at each of the three isotopes of hydrogen.
The full potential energy function for the RPMD system is described using the empirical valence bond (EVB) method [35, 36],
Uext(x(↵)) =
1 2
⇣
Vr(x(↵)) +Vp(x(↵)) ⌘
1 2
q
Vr(x(↵)) Vp(x(↵)) 2+ 4V122. (2.12)
functions for the system with the hydride covalently bonded to the donor and ac-ceptor atoms based on previously described [37] modified version of the GROMOS 43A1 united atom forcefield [38], with modifications described in Appendix B. The constantV12=13.4 kcal/mol is fit to the Eyring equation for the experimental rate
of the intrinsic reaction [39], and the product state potential Vp(x(j)) includes a
constant shift of 12 = +101.9 kcal/mol to match the experimental driving force
for the intrinsic reaction [39].
System preparation
The system is initialized and equilibrated at each temperature following a previ-ously described protocol [37]. The system is initialized from the DHFR crystal structure in the active configuration (PDB code: 1RX2) [40]. Crystallographic 2-mercaptoethanol and manganese ions are removed; crystallographic waters are not. The amine side chain of Q102 is rotated 180 degrees to correctly coordinate the adenine moiety of the cofactor [41]. To be consistent with the observed hy-drogen bonding networks in the crystal structure, histidine residues 45, 124, and 149 are protonated at nitrogen ND1, histidine residues 114 and 141 are protonated at nitrogen NE2, and both DHFR cysteine residues are in their protonated form [36]. The enzyme is explicitly solvated using 4,122 SPC/E rigid water molecules [42] in a truncated octahedral simulation cell with constant volume and periodic boundary conditions. The periodic image distance for the cell is 57.686 ˚A. Twelve Na+ ions are included for charge neutrality. The full system includes N =14,080 classical nuclei.
From the initial geometry of the crystal structure, the system is equilibrated on the reactant potential energy surface Vr using classical MD. In a series of three
equilibration steps, MD trajectories of length 10 ps in time are performed with progressively weaker harmonic restraints between the heavy atom positions and the crystal structure; the restraint force constants for the three equilibration runs are 100, 50, and 25 kcal mol 1˚A 2, respectively, and the runs are performed in the
[43]. After initial equilibration to the reactants basin, the system is equilibrated on the full potential energy surface (Equation A.1) for an additional 100 ps of classical MD. Finally, the ring polymer representation for the quantized hydride was introduced at the geometry of the relaxed classical system and equilibrated for an additional 1 ps using RPMD with velocities resampled from the Maxwell-Boltzmann distribution every 100 fs.
RPMD simulations
In all simulations, the RPMD equations of motion are evolved using the velocity Verlet algorithm [44]. As in previous RPMD simulations, each timestep involves separate coordinate updates for forces arising from the external potential and for exact evolution of the purely harmonic portion of the ring-polymer potentials [6]. The hydride is quantized withn= 32 beads for each of the three masses.
Reaction progress is characterized by the collective variable ⌘ (xc) =
Vr(xc) Vp(xc), where xc ⌘ (qc,Q1, . . . ,QN), qc = Pn↵=1q(↵)/n is the ring
polymer centroid with mass mc=m, andVr and Vp are defined above.
The RPMD reaction rate is calculated from the product of the TST rate and the transmission coefficient (Equation 2.3). The FE profiles that appear in the TST rate expression (Equation 2.4) are obtained using umbrella sampling along and the weighted histogram analysis method (WHAM) [45]. The umbrella sam-pling method [46] is used to efficiently sample this collective variable between the reactant and product basins. Independent RPMD sampling trajectories are per-formed using biased potentials of the form
Un(x) +
1
2kl( (x
c)
l)2, l= 1, . . . ,25, (2.13)
where the {kl} and { l} are listed in Table B.1.
harmonic internal modes of the ring polymer are scaled so each mode has a period of 8 fs. Changing these parameters does not a↵ect the ensemble of configurations that are sampled in the calculation of the FE profile; it merely allows for the sam-pling trajectories to be performed with a larger simulation time-step (1.0 fs) than is used in the dynamical trajectories. Furthermore, unlike the RPMD dynamical trajectories in which the long-range electrostatic contributions are updated every time-step, we use twin-ranged cut-o↵s [38] in the FE sampling trajectories such that non-bonding interactions beyond 9 ˚A are updated every 5 fs. Sampling trajec-tories are performed at constant temperature by resampling the particle velocities from the Maxwell-Boltzmann distribution every 1.3 ps.
For each temperature and mass, the sampling trajectories are initialized in or-der of increasing l, as follows. The first sampling trajectory (l= 1) was initialized
from the equilibrated system in the reactant basin. After 25 ps of simulation, the configuration from this first sampling trajectory was used to initialize the second sampling trajectory (l = 2). After 25 ps of simulation, the configuration from the second trajectory was used to initialize the third sampling trajectory (l= 3), and so on. After initialization, each window was run for 2 ns. The full initial-ization protocol was repeated five times for each window giving a total of 10 ns sampled for each value of l. In order to better converge the kTST term, windows
between reactants and products were repeated an additional 5 times, giving a total of 20 ns sampled for windows of l <18. The weighted histogram analysis method (WHAM) [45] is used to calculate the unbiased FE profile F( ) from the set of sampling trajectories.
Equilibrium averages
strictly defined using
hAi ⇤ =
Z ⇤+
⇤
d 0P( 0)
Z
dq1. . . Z
dqn
Z
dQ1. . . Z
dQN
⇥ ( 0 (x))A(x)), (2.14)
whereP( ) = exp( F( ))/R d 0exp( F( 0)), andF( ) is calculated using um-brella sampling, as described above. Similarly, equilibrium ensemble distributions are presented for each of the three regions. These distributions are defined using
P ⇤(A) =
Z ⇤+
⇤
d 0P( 0)
Z
dq1. . . Z
dqn
Z
dQ1. . . Z
dQN
⇥ ( 0 (x)) (A A(x))). (2.15)
For the ensembles in the reactant, dividing surface, and product regions, we employ
⇤ = -141 kcal/mol, -2.5 kcal/mol, and 162 kcal/mol, respectively, and = 2.5
kcal/mol.
The dividing surface ensemble
Boltzmann-weighted sampling on the reaction dividing surface is performed with constrained molecular dynamics using the RATTLE algorithm [47]. The exist-ing implementation of RATTLE in Gromacs-4.5.5 is modified to constrain both classical MD and RPMD with respect to the collective variable (xc). To re-move the hard-constraint bias from the ensemble of configurations that is sampled in the constrained dynamics [48, 49], each sampled configuration is weighted by [H(xc)] 1/2, where
H(xc) = (mc) 1|rqc (xc)|2+ N
X
k=1
Mk1|rQk (xc)|2. (2.16)
trajectories that are restrained to the dividing surface region using Equation 2.13, and they are performed at constant temperature by resampling velocities from the Maxwell-Boltzmann distribution every 1.3 ps. Following an initial equilibration of 10 ps, each of the constrained trajectories is run for 20 ps, and dividing surface configurations are sampled every 4 ps. As with the umbrella sampling trajectories, the constrained dynamics are run with a timestep of 1 fs enabled by scaling masses of the harmonic internal modes of the ring polymer so each mode has a period of 8 fs.
RPMD transition path ensemble
As we have done previously [37, 50], we analyze the transition path ensemble [51] for the RPMD trajectories in this study. Reactive trajectories are generating by forward and backward integration of initial configurations drawn from the dividing surface ensemble with initial velocities drawn from the MB distribution. Reactive trajectories correspond to those for which the forward and backward integrated half-trajectories terminate on opposite sides of the diving surface. The reactive trajectory, being initialized on the dividing surface must be reweighed to obtain the unbiased transition path ensemble [32, 52]. A weighting termw↵ is applied to
each trajectory, correctly accounting for recording and for the fact that individual trajectories are performed in the microcanonical ensemble. This term is given by
w↵=
X
i
˙ (x) 1
! 1
, (2.17)
T (K) Mass ‡ (kcal/mol) kTST (s 1) kRPMD (s 1)
280 H -2.6 1100±100 0.808 ±0.004 900±100
280 D -2.1 200±20 0.872 ±0.007 170±20
280 T -2.0 110±10 0.881 ±0.006 100±10
300 H -2.8 3800±400 0.826 ±0.008 3100±400
300 D -2.2 750±80 0.874 ±0.006 660±80
300 T -2.1 360±20 0.884 ±0.005 320±20
320 H -2.9 5400±100 0.832 ±0.008 4500±100 320 D -2.2 1200±100 0.877 ±0.005 1100±100
[image:39.612.118.491.111.320.2]320 T -2.1 710±80 0.888 ±0.003 630±80
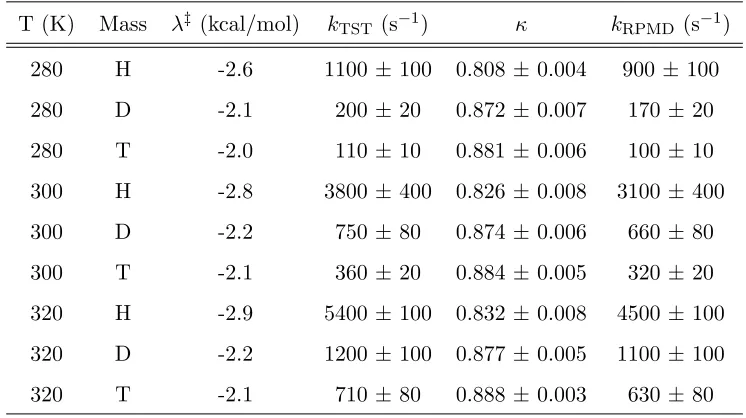
Table 2.2: Hydride transfer rates and terms for each temperature and mass.
2.3
Results
2.3.1 RPMD rates and KIEs
Figure 2.1 demonstrates the independence of the RPMD rate with regards to mechanistic choices of reaction coordinate and dividing surface. The rate of hy-dride transfer was calculated using three values of the energy gap coordinate (-13.4 kcal/mol, -2.8 kcal/mol, and 7.6 kcal/mol) and three values of the hydride coordinate ⇥H (-0.168 ˚A, -0.100 ˚A, and -0.043 ˚A) which describes motion of the
hydride between the donor and acceptor carbons using
⇥H=|QD qc| |QA qc| (2.18)
where QD and QA are the position vectors for the donor and acceptor carbons,
1 10
3.1 3.2 3.3 3.4 3.5 3.6
KIE
1000/T, K-1
320 300 280
Temperature, K
H/D H/T
D/T
Simulation Experment*
Figure 2.2: Simulated (open circles) and experimental KIEs for the intrinsic reac-tion. *—Experimental KIEs from [7]
Kinetic isotope e↵ects for the RPMD system are calculated using (L/ )KIE =
kLRPMD/kRPMD where L/ is H/D, H/T or D/T. These KIEs qualitatively repro-duce the magnitudes and small temperature dependence of experimental KIEs (Figure 2.2). Here, the dividing surface for each temperature and mass was deter-mined by the maximum value of on the FE profile from a harmonic fit in the transition state region. These values ( ‡), as well as the rates (kRPMD and kTST)
and the transmission coefficient () are presented for each temperature and mass in Table 2.2. Arrhenius plots for the calculated KIEs are shown with experimental intrinsic reaction rates [7].
2.3.2 Mass dependence of organization of the enzyme
3.0 3.5 4.0
Donor-Acceptor distance,
Å 280 K
320 K 300 K 3.0 3.5 4.0 Donor-Acceptor distance,
Å 280 K
320 K 300 K 3.0 3.5 4.0 Donor-Acceptor distance,
Å 280 K
320 K 300 K
95% 68%
0.00 0.05 0.10 -0.10 -0.05
Time, ps
3.0 3.5 4.0
0.0 0.5 1.0
-1.0 -0.5
Donor-Acceptor d
istance,
Å
Time, ps
H,D,T
95% 68%
2.6 2.8 3.0 3.2 3.4 3.6 3.8 4.0
0 10 20 30 40 50
Donor-Acceptor distance, Å
Probability distribution, Å -1 Reactant Product Transition state H,D,T
A
B
C
D
[image:41.612.118.485.80.381.2]E
Figure 2.3: Donor-acceptor distance in the equilibrium ensemble and during the in-trinsic reaction (A) The equilibrium probability distributions of the donor-acceptor distance is shown in the reactant (light grey), the product (dark grey), and the transition state (blue) regions for the hydrogen reaction at 300 K. The equilibrium probability distributions in the transition state region are shown for deuterium (red) and tritium (green). (B) The time-dependent distribution of donor-acceptor distances in the non-equilibrium ensemble of reactive trajectories for each mass at 300 K is shown for hydrogen (blue), deuterium (red) and tritium (blue). The me-dian value of these distributions is in bold, and contours representing 68% and 95% are shown. (C-E) The time-dependent distribution of donor-acceptor distances in the non-equilibrium ensemble of reactive trajectories is shown from -0.1 to 0.1 ps (vertical dashed lines inB) for each of the three temperatures 280 K (dashed), 300 K (solid), and 320K (dotted) for each of the masses, hydrogen (C), deuterium (D), and tritium (E).
compression is sampled is explored by looking at the distribution of donor acceptor distances in the ensemble of reactive trajectories. The narrow distribution at the transition state quickly relaxes to distributions consistent with the reactant and product basins within 150 fs. Similar to the equilibrium distributions, the distribu-tion in the ensemble of reactive trajectories is mass independent and temperature independent (2.3C-E).
2.3.3 Temperature dependence of classical barrier position
To compare to previous VTST studies [5], The temperature dependent shift in classical barrier observed in previous VTSTS studies was estimated by considering the temperature dependence of classical barrier position on the same coordinate, ⇥H(Equation 2.18) was estimated by considering the free energy profile for tritium
transfer. Figure 2.4 shows a shift of 0.013 ±0.002 ˚A on⇥H towards products for
the system at 320 K compared to 280 K.
0
5
10
15
-2
-1
0
1
2
280 K 320 K
10 11 12 13 14 15
-0.3 -0.2 -0.1 0 0.1
Hydride coordinate, Å
Free energy, kcal/mol
-0.107 ± 0.001 -0.094 ± 0.001
Figure 2.4: The temperature dependent shift in classical reaction barrier position on the hydride coordinate ⇥H is estimated by considering the FE profile on ⇥H
2.3.4 Dynamical correlations
Dynamical correlations in the intrinsic reaction are characterized following pre-viously developed measures of dynamical correlation [37]. A measure of velocity cross-correlations in the reactive trajectories is introduced,
dij(t) =Dij(t)/(hDiii hDjji)1/2 such that
Dij(t) =hvi·vjit (2.19)
and
hDiii=hvi·vii. (2.20)
A D
D A
80 120
40
-0.12 0.12
0.0 0.1 0.2 0.3 0.4
0 5 10 15 20 25 Side chain
Backbone Substrate/cofactor
Distance from active site, Å
dii
0.0 0.4
A B
[image:43.612.118.502.158.509.2]C
Figure 2.5: Dynamical correlations among enzyme motions during the intrinsic reaction involving hydrogen at 300K. (A) (Upper triangle) The integrated dynam-ical correlation measuredij. Protein residues are indexed according to PDB 1RX2;
substrate and cofactor regions are indicated by the hydride acceptor A and donor D atoms, respectively. Significant dynamical correlations appear primarily in the substrate and cofactor regions, which are enlarged in the lower triangle. (D) The color of atoms in the active site region are scaled according to the diagonal of the integrated dynamical correlation measure,dii. (C) The diagonal of the integrated
dynamical correlation measure,dii, as a function of the distance of atomifrom the
Here, h...it denotes an average over the non-equilibrium ensemble of phase-space
points that lie on reactive trajectories which crossed the dividing surface some time
t earlier and subsequently terminate in the product basin, and h...i denotes the equilibrium average. dij(t), which vanishes for the equilibrium ensemble, reports
on the degree to which atoms move in concert during the intrinsic reaction step. Figure 2.5 summarizes the extent of dynamical correlations throughout the enzyme system in terms of dij =R⌧⌧dij(t)dt.Negative dynamical correlations are
seen between the donor and acceptor carbon atoms (Figure 2.5A), which move in opposite directions (first approaching each other, then moving apart) during the hydride transfer. Similarly, positive correlations are seen between atom pairs on the cofactor and on the substrate which move in concert as the hydride is transferred. Figure 2.5A is reproduced for all masses and temperatures in Figure B.1 Diagonal termsdiireport on the degree to which the velocity of an individual atom deviates
from equilibrium during the transient reaction event. Fig 2.5B shows the active site color coded by the value of the diagonal term dii for each atom. Figure 2.5C
correlates the diagonal terms with distance from the active site. Previous results are reconfirmed: Atom pairs that that are dynamically correlated and atoms that undergo significant deviations from their equilibrium behavior are highly localized to the active site [37].
Transition state tunneling
Tunneling through the transition state along the donor-acceptor coordinate is char-acterized using the connection between RPMD and semiclassical instanton theory [53, 54] and recognizing that an extended configuration of the ring polymer at the dividing surface indicates that the system is in a tunneling regime. The radius of gyration
Rg2= 1
n n
X
↵=1
is used to characterize this extension. We define a measure of extension along the donor-acceptor coordinate as
RDAg 2= 1
n n
X
↵=1 ⇣
q(DA↵) qcDA⌘2, (2.22)
where qDA(↵) is the scalar projection of the↵th bead onto the vector connecting the
donor and acceptor carbons. To characterize extension or compression transverse to the donor-acceptor coordinate, we define
⇣
R?g⌘2= R
2
g RDAg
2
2 . (2.23)
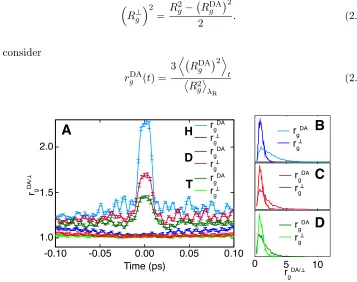
We consider
rgDA(t) =
3D RgDA 2E t ⌦ R2 g ↵ R (2.24) 1.0 1.5 2.0
-0.10 -0.05 0.00 0.05 0.10
0 5 10
A
B
C
D
Time (ps) rg DA/rgDA/
H
D
T
rgDA rg rgDA rg rgDA rg
rgDA rg
rgDA rg
[image:45.612.127.484.284.566.2]rgDA rg
Figure 2.6: Nuclear quantum e↵ects at the transition state for each of the three masses at 300 K are characterized by considering transition state tunneling along donor-acceptor bond and constriction in transverse coordinates using the radius of gyration based measures rDAg and rg?. (A) The time evolution of rDAg and rg?
and
rg?(t) =
3D Rg? 2E t
⌦ R2
g
↵
R
(2.25)
to characterize deviations from the equilibrium ensemble of these values in the ensemble of reactive trajectories. Here, R is the average over the reactants basin.
Fig 2.6A-D shows significant extension of the ring polymer along the donor-acceptor coordinate during the intrinsic reaction event and quick collapse away from the barrier (Fig 2.6A). These deviations increase with decreasing mass. There is no extension or compression in coordinates transverse to the donor-acceptor coordinate, suggesting that constriction of the hydrogen in these coordinates is unlikely to play a role in determining the KIE.
2.4
Conclusion
References
[1] R. P. Bell. The Tunnel E↵ect in Chemistry. Chapman and Hall, New York, 1980.
[2] M. J. Knapp and J. P. Klinman. Environmentally coupled hydrogen tunneling—linking catalysis to dynamics. Eur. J. Biochem., 269(13):3113– 3121, 2002.
[3] J. Basran, M. J. Sutcli↵e, and N. S. Scrutton. Enzymatic H-transfer requires vibration-driven extreme tunneling.Biochemistry, 38(10):3218–3222, 1999.
[4] A. M. Kuznetsov and J. Ulstrup. Proton and hydrogen atom tunnelling in hydrolytic and redox enzyme catalysis. Can. J. Chem., 77(5-6):1085–1096, 1999.
[5] J. Z. Pu, S. H. Ma, J. L. Gao, and D. G. Truhlar. Small temperature depen-dence of the kinetic isotope e↵ect for the hydride transfer reaction catalyzed byEscherichia coli dihydrofolate reductase.J. Phys. Chem. B, 109(18):8551– 8556, 2005.
[6] S. Habershon, D. E. Manolopoulos, T. E. Markland, and T. F. Miller III. Ring-polymer molecular dynamics: Quantum e↵ects in chemical dynamics from classical trajectories in an extended phase space. Annu. Rev. Phys. Chem., 64:387–413, 2013.
[8] G. Maglia and R. K. Allemann. Evidence for environmentally coupled hydro-gen tunneling during dihydrofolate reductase catalysis. J. Am. Chem. Soc., 125(44):13372–13373, 2003.
[9] R. J. Harris, R. Meskys, M. J. Sutcli↵e, and N. S. Scrutton. Kinetic studies of the mechanism of carbon-hydrogen bond breakage by the heterotetrameric sarcosine oxidase of Arthrobacter sp. 1-IN. Biochemistry, 39(6):1189–1198, 2000.
[10] J. Basran, M. J. Sutcli↵e, and N. S. Scrutton. Deuterium isotope e↵ects during carbon-hydrogen bond cleavage by trimethylamine dehydrogenase— implications for mechanism and vibrationally assisted hydrogen tunneling in wild-type and mutant enzymes.J. Biol. Chem., 276(27):24581–24587, 2001.
[11] J. L. Abad, F. Camps, and G. Fabrias. Is hydrogen tunneling involved in Acyl-CoA desaturase reactions? the case of a 9desaturase that transforms (E )-11-tetradecenoic acid into (Z,E)-9,11-tetradecadienoic acid. Angew. Chem. Int. Ed., 39(18):3279–3281, 2000.
[12] N. Agrawal, B. Y. Hong, C. Mihai, and A. Kohen. Vibrationally enhanced hydrogen tunneling in the Escherichia coli thymidylate synthase catalyzed reaction.Biochemistry, 43(7):1998–2006, 2004.
[13] B. Hong, F. Maley, and A. Kohen. Role of Y94 in proton and hydride transfers catalyzed by thymidylate synthase.Biochemistry, 46(49):14188–14197, 2007.
[14] M. J. Knapp, K. Rickert, and J. P. Klinman. Temperature-dependent iso-tope e↵ects in soybean lipoxygenase-1: Correlating hydrogen tunneling with protein dynamics.J. Am. Chem. Soc., 124(15):3865–3874, 2002.
[16] Z. X. Liang, T. Lee, K. A. Resing, N. G. Ahn, and J. P. Klinman. Thermactivated protein mobility and its correlation with catalysis in thermophilic al-cohol dehydrogenase.Proc. Natl. Acad. Sci. U.S.A., 101(26):9556–9561, 2004.
[17] I. R. Craig and D. E. Manolopoulos. Quantum statistics and classical mechan-ics: Real time correlation functions from ring polymer molecular dynamics.
J. Chem. Phys., 121(8):3368–3373, 2004.
[18] Richard P. Feynman and Albert R. Hibbs.Quantum mechanics and path in-tegrals. International series in pure and applied physics. McGraw-Hill, New York, 1965.
[19] T. F. Miller III. Isomorphic classical molecular dynamics model for an excess electron in a supercritical fluid. J. Chem. Phys., 129(19), 2008.
[20] D. Chandler and P. G. Wolynes. Exploiting the isomorphism between quantum-theory and classical statistical-mechanics of polyatomic fluids. J. Chem. Phys., 74(7):4078–4095, 1981.
[21] M. Parrinello and A. Rahman. Study of an F-center in molten KCl.J. Chem. Phys., 80(2):860–867, 1984.
[22] B. De Raedt, M. Sprik, and M. L. Klein. Computer-simulation of muonium in water. J. Chem. Phys., 80(11):5719–5724, 1984.
[23] E. Wigner. Concerning the excess of potential barriers in chemical reac-tions.Zeitschrift Fur Physikalische Chemie-Abteilung B-Chemie Der Elemen-tarprozesse Aufbau Der Materie, 19(2/3):203–216, 1932.
[24] H. Eyring. The activated complex in chemical reactions. J. Chem. Phys., 3(2):107–115, 1935.
[26] I. R. Craig and D. E. Manolopoulos. A refined ring polymer molecular dynam-ics theory of chemical reaction rates.J. Chem. Phys., 123(3):034102, 2005.
[27] I. R. Craig and D. E. Manolopoulos. Chemical reaction rates from ring poly-mer molecular dynamics.J. Chem. Phys., 122(8):084106, 2005.
[28] W. H. Miller. Improved classical path approximation for boltzmann density matrix. J. Chem. Phys., 58(4):1664–1667, 1973.
[29] R. Collepardo-Guevara, I. R. Craig, and D. E. Manolopoulos. Proton transfer in a polar solvent from ring polymer reaction rate theory. J. Chem. Phys., 128(14):144502, 2008.
[30] A. R. Menzeleev, N. Ananth, and T. F. Miller III. Direct simulation of electron transfer using ring polymer molecular dynamics: Comparison with semiclas-sical instanton theory and exact quantum methods. J. Chem. Phys., 135(7), 2011.
[31] D. Chandler. Statistical-mechanics of isomerization dynamics in liquids and transition-state approximation.J. Chem. Phys., 68(6):2959–2970, 1978.
[32] H. Bennett Charles. Molecular dynamics and transition state theory: The simulation of infrequent events. In Algorithms for Chemical Computations, volume 46 ofACS Symposium Series, pages 63–97. American Chemical Soci-ety, 1977. doi:10.1021/bk-1977-0046.ch004.
[33] G. K. Schenter, B. C. Garrett, and D. G. Truhlar. Generalized transition state theory in terms of the potential of mean force.J. Chem. Phys., 119(12):5828– 5833, 2003.
[34] B. Hess, C. Kutzner, D. van der Spoel, and E. Lindahl. GROMACS 4: Algo-rithms for highly efficient, load-balanced, and scalable molecular simulation.
[35] A. Warshel and R. M. Weiss. An empirical valence bond approach for compar-ing reactions in solutions and in enzymes.J. Am. Chem. Soc., 102(20):6218– 6226, 1980.
[36] P. K. Agarwal, S. R. Billeter, and S. Hammes-Schi↵er. Nuclear quantum e↵ects and enzyme dynamics in dihydrofolate reductase catalysis. J. Phys. Chem. B, 106(12):3283–3293, 2002.
[37] N. Boekelheide, R. Salomon-Ferrer, and T. F. Miller III. Dynamics and dis-sipation in enzyme catalysis. Proc. Natl. Acad. Sci. U.S.A., 108(39):16159– 16163, 2011.
[38] W. F. van Gunsteren, S. R. Billeter, A. A. Eising, P. H. H¨unenberger, P. Kr¨uger Mark, A. E., W. R. P. Scott, and I. G. Tironi. Biomolecular Sim-ulation: The GROMOS96 manual and user guide. Hochschuleverlag AG an der ETH Z¨urich, Z¨urich, Switzerland, 1996.
[39] C. A. Fierke, K. A. Johnson, and S. J. Benkovic. Construction and evalua-tion of the kinetic scheme associated with dihydrofolate-reductase from Es-cherichia coli.Biochemistry, 26(13):4085–4092, 1987.
[40] M. R. Sawaya and J. Kraut. Loop and subdomain movements in the mecha-nism of Escherichia coli dihydrofolate reductase: Crystallographic evidence.
Biochemistry, 36(3):586–603, 1997.
[41] I. V. Khavrutskii, D. J. Price, J. Lee, and C. L. Brooks. Conformational change of the methionine 20 loop of Escherichia coli dihydrofolate reductase modulates pk(a) of the bound dihydrofolate. Protein Sci., 16(6):1087–1100, 2007.
[42] H. J. C. Berendsen, J. R. Grigera, and T. P. Straatsma. The missing term in e↵ective pair potentials.J. Phys. Chem., 91(24):6269–6271, 1987.
J. R. Haak. Molecular-dynamics with coupling to an external bath.J. Chem. Phys., 81(8):3684–3690, 1984.
[44] L. Verlet. Computer experiments on classical fluids I. Thermodynamical prop-erties of Lennard-Jones molecules.Phys. Rev., 159(1):98–103, 1967.
[45] S. Kumar, D. Bouzida, R. H. Swendsen, P. A. Kollman, and J. M. Rosen-berg. The weighted histogram analysis method for free-energy calculations on biomolecules. 1. The method.J. Comput. Chem., 13(8):1011–1021, 1992.
[46] G. M. Torrie and J. P. Valleau. Non-physical sampling distributions in Monte-Carlo free-energy estimation—Umbrella sampling. J. Comput. Phys., 23(2):187–199, 1977.
[47] J. P. Ryckaert, G. Ciccotti, and H. J. C. Berendsen. Numerical-integration of cartesian equations of motion of a system with constraints—Molecular-dynamics of N-alkanes.J. Comput. Phys., 23(3):327–341, 1977.
[48] D. A. Zichi, G. Ciccotti, J. T. Hynes, and M. Ferrario. Molecular-dynamics simulation of electron-transfer reactions in solution.J. Phys. Chem., 93(17):6261–6265, 1989.
[49] D. Frenkel and B. Smit. Understanding molecular simulation: From algo-rithms to applications. Academic Press, San Diego, 2nd edition, 2002.
[50] J. S. Kretchmer and T. F. Miller III. Direct simulation of proton-coupled electron transfer across multiple regimes. The Journal of chemical physics, 138(13):134109–134109, 2013.
[51] P. G. Bolhuis, D. Chandler, C. Dellago, and P. L. Geissler. Transition path sampling: Throwing ropes over rough mountain passes, in the dark. Annu. Rev. Phys. Chem., 53:291–318, 2002.
[52] G. Hummer. From transition paths to transition states and rate coefficients.
[53] J. O. Richardson and S. C. Althorpe. Ring-polymer instanton method for calculating tunneling splittings.J. Chem. Phys., 134(5), 2011.
Chapter 3
Promoting Modes in Lactate Dehydrogenase
3.1
Introduction
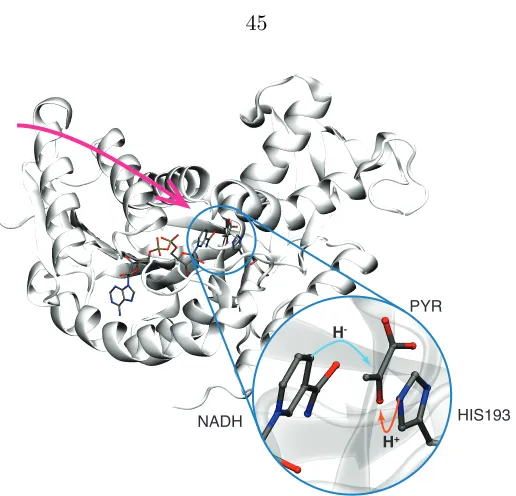
Lactate dehydrogenase (LDH) catalyzes the reversible transfer of a hydride and proton to pyruvate to produce lactate. This reaction controls levels of cellular pyruvate when oxygen is in limited supply. Isozymes of LDH exhibit di↵erent kinetic parameters that fine-tune the regulation of cellular pyruvate to meet the particular metabolic needs of a cell. Understanding the mechanistic origin of the di↵erences in kinetic properties between LDH isozymes motivated one of the first applications of transition path sampling (TPS) in enzyme catalysis [1, 2, 3, 4]. Intriguingly, the ensemble of reactive trajectories determined in these studies re-vealed spatially extensive, sub-picosecond motion in the protein that couples to active site compression during the reaction event (Figure 3.1).
HIS193
H+
PYR
NADH
H
-Figure 3.1: The crystal structure of human heart lactate dehydrogenase isozyme which catalyzes the conversion of pyruvate to lactate by transferring a proton from hisidine 193 and a hydride from NAPH to pyruvate (inset). The reported compressive mode [3] includes residues under the magenta arrow. (Protein Data Bank structure 1I0Z [7]).
3.2
Methods
3.2.1 Ring polymer molecular dynamics
The RPMD equations of motion for the LDH holoenzyme with a quantized proton and a hydride of massesm and withN classical particles are [8, 9]
˙v(P↵) =!n2⇣qP(↵+1)+qP(↵ 1) 2q(P↵)⌘ 1
mrq(P↵)Uext
⇣
qP(↵),qH(↵),Q1, . . . ,QN
⌘ ,
(3.1)
˙v(H↵) =!n2⇣qH(↵+1)+qH(↵ 1) 2q(H↵)⌘ 1
mrq(H↵)Uext
⇣
qP(↵),qH(↵),Q1, . . . ,QN
⌘ ,
(3.2) and
˙ Vj =
1
nMj n
X
↵=1
rQjUext
⇣
qP(↵),qH(↵),Q1, . . . ,QN
⌘
, (3.3)
[image:55.612.177.435.77.325.2]velocity of thejthclassical particle with corresponding massMj, andnis the
num-ber of imaginary time ring-polymer beads. The intra-bead harmonic frequency is !n = n¯h where is the reciprocal temperature. Uext
⇣
qP(↵),qH(↵),Q1, . . . ,QN
⌘
is the potential energy function of the system, q(0)P = q(Pn), and q(0)H = q(Hn). Equa-tions 3.1, 3.2 and 3.3 generate classical dynamics that we employ as a model for the real-time dynamics of the system [10]. In the limit of large n, these dynamics preserve the exact Boltzmann distribution [11, 12, 13].
3.2.2 Calculation details
Quantum mechanical/classical mechanics potential energy function
A quantum mechanical/classical mechanical (QM/MM) potential energy func-tion [14] is used to describe Uext appearing in Equations 3.1, 3.2 and 3.3. The
QM/MM potential is obtained by dividing the system into two regions: A quantum mechanical (QM) subregion whose potential is calculated using a QM Hamiltonian, and a molecular mechanical (MM) region system comprised of the remaining atoms whose potential is calculated using a MM force field. Interactions across the two regions are treated using the electrostatic embedding method [14] with link-atom hydrogens capping the covalent bonds that cross the QM/MM boundary [15]. In the LDH system, the QM region (Figure 3.2) is composed of 39 atoms in the active site including the nicotinamide ring of NADH, the pyruvate molecule, the imia-zole ring and -carbon of histidine-193, and two link-atom hydrogens attached to the N1-nitrogen in the nicotinamide ring and the -carbon of histidine 193. The