© 2019, IRJET | Impact Factor value: 7.211 | ISO 9001:2008 Certified Journal
| Page 21
BIOMASS AND CARBON STOCK ASSESSMENT OF PEAT SWAMP FOREST
ECOSYSTEM; A CASE STUDY IN PERMANENT FOREST RESERVE PEKAN
PAHANG, MALAYSIA
Mohd Afzanizam, M.
1, E.Philip
2, Shahrul,A.B,
3& Mohd Haniff, H
41
Research Officer, Forest Research Institute Malaysia (FRIM), Climate Change and Forestry Program,
52109 Kepong Selangor
2
Head of Program, Forest Research Institute Malaysia (FRIM), Climate Change and Forestry Program,
52109 Kepong Selangor
3
Research Officer, Forest Research Institute Malaysia (FRIM), Climate Change and Forestry Program,
52109 Kepong Selangor
4
Head of Unit, Malaysia Palm Oil Board (MPOB), Tropical Peat Research Institute (TROPI), 6, Persiaran Institusi,
Bandar Baru Bangi, 43000 Kajang Selangor
---***--- Abstract-Calculation of forest biomass is an ongoing requirement. It is in view of monitoring the changes that occur as one of the particular assessment in the forest especially in PSF Pekan. The study was conducted in Compartment 75. The results estimated the total biomass is 415.18 t ha-1, the value of which is almost the same compared to the Compartment 100 in another study which is 414.57 t ha-1. This situation may change in the next 10 to 30 years, because in Compartment 75 indicates that trees with DBH Class 55.0-69.9cm contribute the highest carbon stocks by 87.16 C t ha-1 (36.9%) with basal area 4.47 m2 ha-1, compared with the Compartment 100 where the DBH class of 40.0-54.9cm as the highest biomass contributor with 153.22 C t ha-1 (37%) with a basal area of 11.13 m2 ha-1. Other studies; Compartment 156 and Compartment 200 reported biomass result as 399.21 t ha-1 and 328.14 t ha-1 respectively, shown that Compartment 75 may among the highest in this PSF. This study should be continued in future periods as a series of useful data.
Keyword: carbon stock, stand structure, stocking density, peat swamp, tree biomass
1. INTRODUCTION
[image:1.595.114.482.600.711.2]Forest ecosystem including peat swamps in their natural state play a role as an efficient carbon stores in terrestrial environment. The Intergovernmental Panel on Climate Change identified five carbon pools of the forest ecosystem involving biomass namely the aboveground biomass (AGB), belowground biomass (BGB), litter, woody debris or soil organic matter (SOM). Among all carbon pools, the aboveground biomass constitutes the major portion of the carbons storage in forest. Forest biomass estimation is very crucial for long term monitoring the amount of carbon that is emitted during deforestation and will also project forest's potential to sequester and store carbon in the forest. In Peninsular Malaysia alone, PSF coverage area is 255,080 ha [1]. From this total, 140,830 ha is located in Pahang. Table 1 extracted from Forestry Statistics show PSF coverage area under Permanent Reserve Forest by Forest type in 2014. No value recorded in other states.
Table 1: PSF coverage area in Johor, Pahang, Selangor in 2014 [1].
States Peat Area (ha)
Johor 5,429
Pahang 140,830
Selangor 82,890
Terengganu 25,931* (*using digital satellite data)
Total 255,080
© 2019, IRJET | Impact Factor value: 7.211 | ISO 9001:2008 Certified Journal
| Page 22
Table 2 show carbon stock changes in PSF, Malaysia (tonne per hectare) [5].
Year
Type of Forest
1972 1983 2005
Natural/Undisturbed PSF 88.75 107 110-225
*Logged PSF 61.8 89 90
Degraded PSF 54.7 135
Note: * Study conducted at PSF in Johor and Selangor
According to values of various sources (Table 3), the AGB of logged-over and secondary peat swamp forest in tropical region ranges from 130-334 t/ha (~65-167 t C/ha) [6]. Estimated carbon content of biomass was assumed to be 50% of dry weight biomass (Table 3).
[image:2.595.93.502.473.653.2]Two allometric functions are generally used in describing the standing biomass of a forest stand (i) aboveground biomass (AGB) (ii) belowground biomass (BGB). AGB biomass refers to the biomass of standing trees above the ground which includes the stems, branches, twigs and leaves of the trees. BGB biomass refers to the biomass of the roots of standing trees. The tree biomass is calculated based on the allometric functions developed by measuring the weights of the tree components (stems, branches, leaves and roots) from destructive sampling of trees. For PSF, existing allometric equation were adopted for biomass estimation based on a more similar type of forest in Sumatra [7]. The equations used in this study are as follows:
Table 3: Published values of aboveground biomass (AGB) and aboveground carbon (AGC) in logged-over or degraded peat swamp forest (PSF) [8].
PSF type Province/State AGB (tonne
ha-1) AGC (tonne C ha-1) References
Logged-over Kota Samarahan,
Sarawak 244.28 122.14 [8]
Secondary PSF Jambi 306 153 [9]
Secondary PSF Central
Kalimantan 130 65
Secondary PSF Sumatra 284 142 [10]
Secondary PSF Papua 334 167
Secondary PSF Kalimantan 310 155
In this preliminary study, tree biomass and carbon stock in Pekan FR has been determined. Sequestration or uptake refer
to the process of increasing the carbon content of a carbon pool other than the atmosphere [11].The objective of the study
are :
1. To conduct biomass assessment studies and provide baseline data for peat swamp forest in natural/pristine condition.
© 2019, IRJET | Impact Factor value: 7.211 | ISO 9001:2008 Certified Journal
| Page 23
2. MATERIAL & METHOD
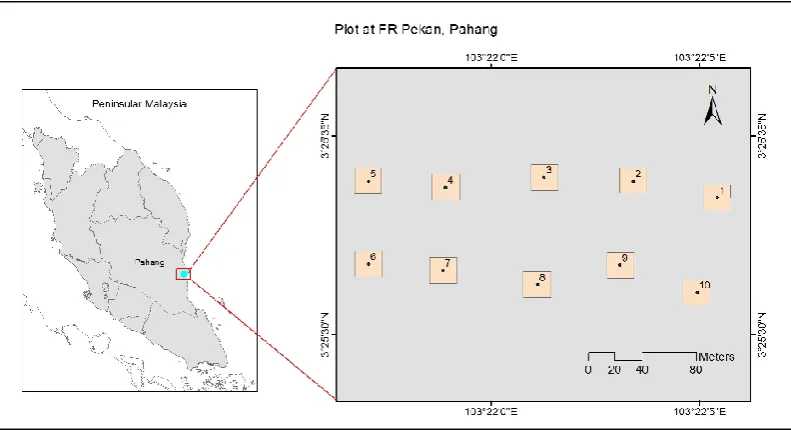
The study site is located at Compartment 75, Pekan FR, in the Southeast of Pahang, Malaysia (Figure 1). The Compartment 75 is a 200-ha area under production forest.
2.1Ecological Plot Establishment
[image:3.595.100.496.216.431.2]Ten plots of 20m x 20m were established for population profile assessments. It is important to acquire information and examine changes in forest structure and species composition through time, and to examine changes in stand density and basal area. All trees ≥10 cm dbh were measured for the stand structure and density.
Figure 1: Permanent plot size establishment of 20 m x 20m in Compartment 75 Pekan FR for tree biomass assessment and carbon stock study.
2.2Tree species diversity and forest structure
All living trees and dead trees were enumerated in the plot. The merchantable height and dbh were recorded and metrics of abundance including basal area and stand density.
Tree basal area and tree volume was calculated as follows;
Basal area, ba =[ π (dbh2)/40000] (unit in m2),
Tree volume, vol; = ba x mht x 0.65 (unit in m3), where mht is merchantable bole height in meters. The 0.65 value is a
presumed form factor that applies to all trees [12]. Only trees with ≥10 cm dbh were analysed
Maximum canopy height of these trees was obtained using a clinometers and their basal circumference (as close to the tree base as possible or immediately above stilt or buttress roots). Characteristics of the trees in each plot were noted to assist in their identification. Local names of trees were assigned; voucher specimens were collected and refereed to FRIM Herbarium and other prominent morphological features were cross-referenced to tropical peat standard works in Sarawak and Brunei [13,14],Peninsular Malaysia, Sabah and Sarawak [15-19].
2.3Tree biomass
Tree biomass is defined as the total amount of living organic matter in trees and express it as oven-dry per unit area,
usually in tonne ha-1 [20]. In this biomass assessment studies, stem diameter which is the most common parameter
© 2019, IRJET | Impact Factor value: 7.211 | ISO 9001:2008 Certified Journal
| Page 24
peat swamp [24]. Common equations used for estimating tropical tree biomass in Malaysia are generally suitable for dry inland forest [21].
Biomass(aboveground), AGB = 0.0145 (dbh3) – 0.4659 (dbh2) + 30.64 (dbh) -263.32 , dbh in cm, R2 = 96
Biomass (belowground), BGB = 20.1% of AGB
Total Plant Biomass = Biomass(aboveground) + Biomass (belowground)
The standing biomass of a stand is the cumulative summation of the calculated tree biomass by the area (hectares). For multiplot assessment, the average value is calculated to represent the standing biomass for this compartment. In general, the basic allometric function of biomass equation includes the stem diameter at breast height (dbh) to establish height-stem dbh relationship [21]. Steps taken in calculating the aboveground biomass from a single tree measurement. This will give biomass carbon of one tree and converted to “per hectare basis” for one plot and up to the average value for standing biomass of an area [22].
2.4 Carbon stock
C estimation using suitable allometric equation were developed for tropical peat swamp forest based on carbon stock estimation study in Riau Indonesia [25]. The carbon stock is converted to a hectare basis by dividing the cumulative sum of the carbon stocks in each DBH class by the area (hectares).
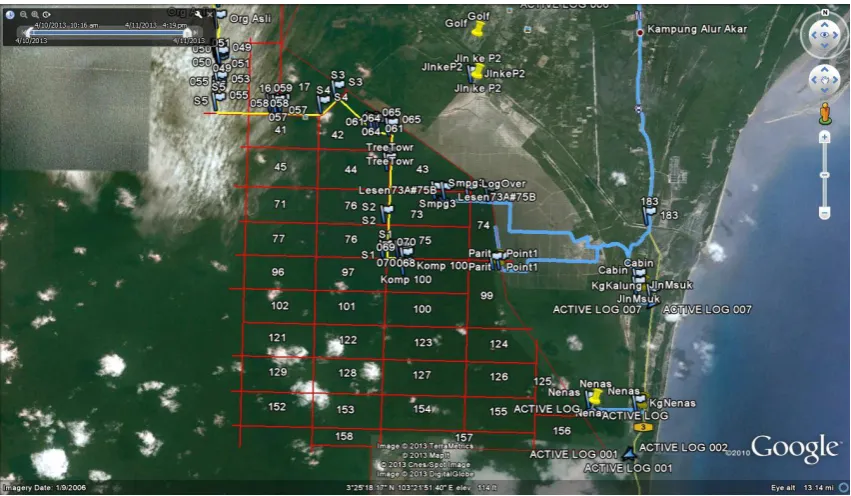
[image:4.595.85.511.360.608.2]C = 0.087*D2.470 , D=dbh in cm, C in kg
Figure 2: Location map shows Compartment 75 in PSF Pekan. Compartment size was 2000m x 1000 m.
3. RESULT AND DISCUSSION
Table 4 shows data on structure of trees ≥ 10 cm dbh in the plot. A total of 173 trees were enumerated in the plot and taxonomic composition for biodiversity assessment.
© 2019, IRJET | Impact Factor value: 7.211 | ISO 9001:2008 Certified Journal
| Page 25
Table 4 shows number of trees according to class height.
Forest layer Class of Height (m) Number of trees Canopy coverage (%)
Undergrowth 0-9.9 7 4.05
Understorey/undercanopy 10-19.9 76 43.93
Canopy 20-29.9 56 32.37
30-39.9 29 16.76
Emergent 40-49.9 5 2.89
≥50 0 0
Total 173 100.00
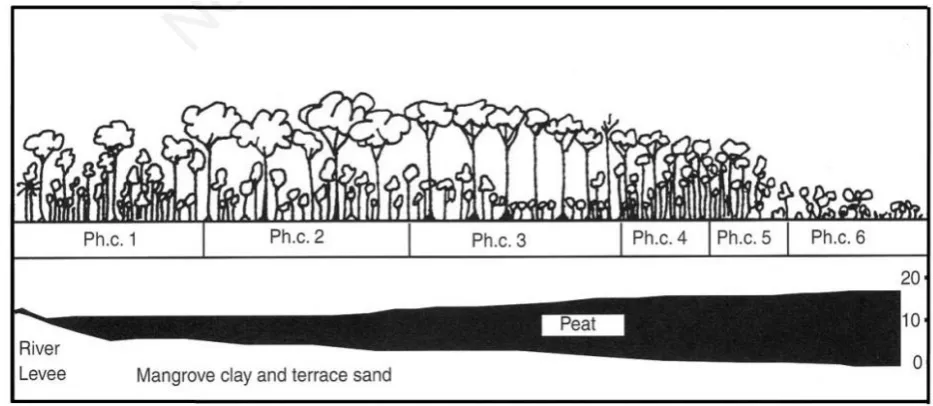
Based on the tropical lowland peat swamp forests in Sarawak, Malaysia and adjacent Brunei show lateral or horizontal changes in vegetation types from its periphery to the centre of the dome-shaped peat swamps and each of the six dominant lateral vegetation zone was previously designated as "Phasic Community'' [3]. Six distinct communities or successive lateral vegetation zones were recognized based on their floristic composition and structure of vegetation in each Phasic Zone [3, 26] and were numbered Phasic Community I at the margin to Phasic Community VI in the centre of the peat swamp.
Figure 3: Six phasic communities, along a gradient, or catena, of decreasing soil fertility and increasing waterlogging, from the periphery (seaward) to the centre (landward). (Adapted from [3,27])
Compartment 75 of Peat Swamp Forest in Pekan classified as mixed peat swamp according to phase of vegetation
[3,27,28] and referred to as phasic community 1. The main tree species association for mixed swamp forest are
Gonystylus-Dactylocladus-Neoscortechinia. This phasic vegetation community closely resembles lowland dipterocarp forest.
Prominent species observed in Compartment 75 are Shoreasp., Calophyllumsp. and Gonystylus sp. For example, Shorea
leprosula (meranti tembaga) & Shorea platycarpa (meranti paya). The presence of one dominant species, Shorea albida or
[image:5.595.61.528.405.608.2]© 2019, IRJET | Impact Factor value: 7.211 | ISO 9001:2008 Certified Journal
| Page 26
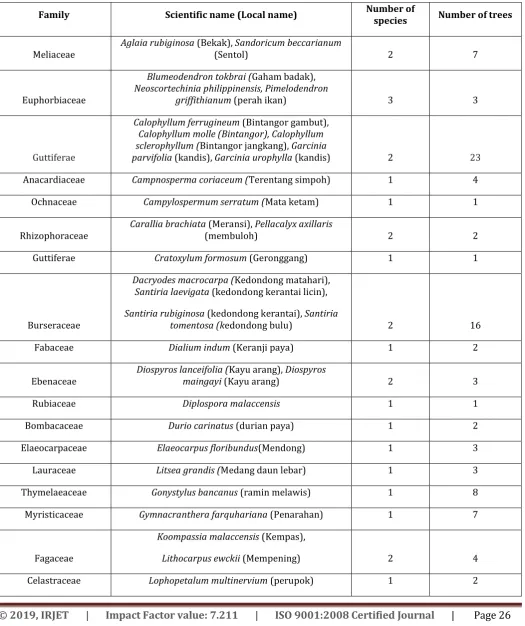
[image:6.595.38.564.171.798.2]In early 60s, a comprehensive study on the ecology of the lowland peat swamp forest in Sarawak and Brunei has inventoried 253 tree species that are mostly confined to the seaward or periphery of the swamp forest [3,27,29]. Most of the plant species that grow in the forests at the centre of the peat domes are usually found on nutrient poorer soils in the heath forest [27]. Table 5 show floristic inventory in Compartment 75 of peat swamp forest in Pekan Pahang.
Table 5: Flora inventory in Compartment 75, Peat Swamp Forest ,Pekan Pahang.
Family Scientific name (Local name) Number of species Number of trees
Meliaceae Aglaia rubiginosa (Bekak),(Sentol) Sandoricum beccarianum 2 7
Euphorbiaceae
Blumeodendron tokbrai (Gaham badak),
Neoscortechinia philippinensis, Pimelodendron
griffithianum (perah ikan) 3 3
Guttiferae
Calophyllum ferrugineum (Bintangor gambut),
Calophyllum molle (Bintangor), Calophyllum sclerophyllum (Bintangor jangkang), Garcinia
parvifolia (kandis), Garcinia urophylla (kandis) 2 23
Anacardiaceae Campnosperma coriaceum (Terentang simpoh) 1 4
Ochnaceae Campylospermum serratum (Mata ketam) 1 1
Rhizophoraceae Carallia brachiata (membuloh)(Meransi), Pellacalyx axillaris 2 2
Guttiferae Cratoxylum formosum (Geronggang) 1 1
Burseraceae
Dacryodes macrocarpa (Kedondong matahari),
Santiria laevigata (kedondong kerantai licin),
Santiria rubiginosa (kedondong kerantai), Santiria
tomentosa (kedondong bulu) 2 16
Fabaceae Dialium indum (Keranji paya) 1 2
Ebenaceae Diospyros lanceifolia (maingayi (Kayu arang)Kayu arang), Diospyros 2 3
Rubiaceae Diplospora malaccensis 1 1
Bombacaceae Durio carinatus (durian paya) 1 2
Elaeocarpaceae Elaeocarpus floribundus(Mendong) 1 3
Lauraceae Litsea grandis (Medang daun lebar) 1 3
Thymelaeaceae Gonystylus bancanus (ramin melawis) 1 8
Myristicaceae Gymnacranthera farquhariana (Penarahan) 1 7
Fagaceae
Koompassia malaccensis (Kempas),
Lithocarpus ewckii (Mempening) 2 4
© 2019, IRJET | Impact Factor value: 7.211 | ISO 9001:2008 Certified Journal
| Page 27
Rutaceae Maclurodendron sp. (Perupok) 1 2
Myristicaceae Myristica lowiana (penarahan arang) 1 1
Sapindaceae Nephelium maingayi (Redan) 1 10
Chrysobalanaceae Parastemon urophyllus (Nyalas) 1 5
Pittosporaceae Pittosporum ferrugineum 1 1
Sapotaceae Pouteria maingayi (Nyatoh nangka merah) 1 5
Dipterocarpaceae Shorea leprosulaplatycarpa ( (meranti tembaga),meranti paya) Shorea 1 8
Stemonuraceae Stemonorus secundiflorus (sampul keris) 1 11
Myrtaceae Syzygium cerinum Syzygium lineatum, Syzygium sp.(kelat gelam), Syzygium kiahii, 1 35
Tetrameristaceae Tetramerista glabra (punah) 1 2
Unidentified
2
Total
36
173
Prominent species observed in Compt .75 are Gonystylus bancanus (Ramin melawis), Calophyllum ferrugineum (Bintangor
gambut), Shorea platycarpa (Meranti paya), Tetramerista glabra (Punah) and Durio carinatus (Durian paya), Koompassia
malaccensis (Kempas). Stand characteristics of tree communities of Ramin-Bintangor forest subtype in Southeast Pahang
peat swamp forest (SEP PSF) are rich with commercial timber species [30](Table 5)
Stocking density was the highest in the DBH class of 10.0-24.9, represented by 97 stems (56.07%). Both basal area and
volume were the largest in the dbh class 55.0-69.9 with 4.47 m2 ha-1 and 75.07 m2 ha-1 respectively. The stocking density
was relatively low at only about 1.73% (3 stems) out of the total. Basal area are useful measure for site occupancy and
forecast future development of tree stand at a given time. Total basal area and volume was 14.02 m2 ha-1 and 190.48 m3
[image:7.595.80.520.618.754.2]ha-1respectively (Table 6).
Table 6: Stand structure of trees by dbh classes in Compartment 75, Pekan FR.
DBH class (cm) Stocking density
(stems ha-1)
Basal area(m2 ha-1) Volume (m3ha-1)
10.0-24.9 97 (56.07%) 1.85 14.72
25.0-39.9 35(20.23%) 2.78 32.96
40.0-54.9 23(13.29%0 3.69 50.77
© 2019, IRJET | Impact Factor value: 7.211 | ISO 9001:2008 Certified Journal
| Page 28
≥70 3 (1.73%) 1.22 16.96
Total 173 (100%) 14.02 190.48
Note; Number in parentheses denotes the percentage value
Table 7 show tree biomass for all trees in the plot at Compartment 75, Pekan FR. Biomass of trees with dbh ≥ 5cm for the
Compartment 75 is shown below. The plot has a total tree biomass value 415.18 tonnes ha-1. The dbh class with the
greatest total plant biomass was 55.0-69.9 cm with 146.93 tonnes ha-1, the smallest was 10.0-24.9 cm with 42.61tonnes ha
-1 (10%) (Table 7). However, stocking density was the highest in dbh class 10.0-24.9 cm, represented by 97 stems (56.07%)
(Table 6). The highest total biomass recorded in dbh class 55-69.9 (146.93 t/ha) due to high number of stems for site occupancy (Table 7). The highest stocking density were recorded for the same dbh class in Compartment 100 in Pekan FR
(182 stems ha-1, 48.4%) with total biomass of 342.62 tonnes ha-1[30]. Highest stocking density also been recorded in
Compartment 156 and Compartment 200 of Pekan FR at 358 stems ha-1 (64.3%) and 425 stems ha-1 (76.6%) respectively
[image:8.595.103.499.321.500.2][31]; In other part of Pekan FR, the highest tree biomass recorded was in dbh class 40.0-54.9 [30]. In general, Compartment 75 has a high amount of tree biomass.
Table 7: Tree biomass for all trees in the plot at Compartment 75, Pekan FR
Table 8 shows comparative biomass estimates between different compartment in Pekan FR at different study period. The
total biomass of Pekan FR were gathered as follow ; Compt. 200 (328.14 t ha-1), Compt. 156 (399.21 t ha-1), Compt. 100
(414.57 t ha-1) and Compt. 75 (415.18 t ha-1). The population abundance shows a wide tree distribution in different DBH
classes. The total tree biomass estimation of 280.12 tonnes ha-1 in the PSF Sumatra [9]; which was relatively lower than
[image:8.595.86.509.598.779.2]the total tree biomass gathered from this study in Pekan FR at different compartment.
Table 8: A comparison of biomass assessment study of Pekan FR in different compartment
Total biomass (t/ha)
DBH class
(cm) Compt. 200 Compt. 156 Compt. 100 Compt. 75
10.0-24.9 72.92 74.2 38.85 42.61
25.0-39.9 63.91 111.3 75.27 76.31
40.0-54.9 60.49 83.78 153.22 104.72
55.0-69.9 20.2 50.09 128.96 146.93
≥70 110.62 79.84 18.26 44.61
Total 328.14 399.21 414.57 415.18
DBH class
(cm) biomass (t/ha) Aboveground biomass(t/ha) Below ground Total biomass (t/ha) Percentage (%)
10.0-24.9 35.48 7.13 42.61 10%
25.0-39.9 63.54 12.77 76.31 18%
40.0-54.9 87.20 17.53 104.72 25%
55.0-69.9 122.34 24.59 146.93 35%
≥70 37.15 7.47 44.61 11%
© 2019, IRJET | Impact Factor value: 7.211 | ISO 9001:2008 Certified Journal
| Page 29
The findings indicate the lowest carbon stock figure was in dbh class 10-24.9 cm (19.27 t C ha-1) while the highest was in
dbh class 55.0-69.9 (87.16 t C ha-1). The total carbon stock quantified from this study was 236.51 tonnes C ha-1 (Table 8)
which is slightly higher than previous study that indicated carbon stock between 110-225 t/ha under natural/undisturbed condition [5]. Compartment 75 mostly consist of undergrowth and understorey trees indicating a young swamp ecosystem
but high potential biomass yield. Another study estimated the total carbon stock in Pekan FR was 205.74 t C ha1 [32].
Global data sourced on carbon stock estimation in undisturbed tropical peat swamp forest were between 182-306 t C/ha
with the average of 243 t C ha-1 [33]. Carbon percentage of tree biomass in tropical peat ranged between 46% and 50%
which is slightly underestimated [20,34,35]. This study quantify carbon percentage are slightly higher (~56%) of total biomass. Carbon content of biomass was assumed to be 50% of dry weight biomass which in this studywas underestimated [6]. A study conducted in different type of forest; hill forest of Gunung Stong, Gunung Basor and Bukit Bakar in Kelantan revealed the carbon stock estimation were 147.13, 156.43 and 169.36 t/ha respectively [36]. This indicates peat swamp forest are able to capture and store carbon efficiently under natural/pristine condition and therefore has high potential in carbon sequestration compared to other forest types.
4. CONCLUSION
Total tree biomass and carbon stock quantified peat swamp forest of Pekan FR under natural condition were 345.69
tonnes ha-1 and 236.51 tonnes C ha-1respectively. Ecological plot for biomass assessment is important to monitor the forest
stand dynamics under natural condition. Continuous carbon stocking in peat swamp forest is crucial to determine the carbon changes over time and justify the role of peat swamp as carbon sink or source under pristine/natural condition. Future works should also look into comparative biomass and carbon stock estimates caused by anthropogenic activities (human intervention/disturbance) under logged-over condition.
5. ACKNOWLEDGEMENT
Authors would like to thank Malaysia Palm Oil Board (MPOB) for providing research grant to undertake “The Study of Carbon Stock Assessment in Permanent Peat Swamp Forest in Pekan Pahang” collaboration project (Vot No. :
51310705006) under the 11th Malaysia Plan Research Budget (2016-2020). Appreciation also goes to the staff of the
Forestry Department of Pahang, Kuantan/Pekan/Maran District Forestry Office and field assistance from FRIM staff for data collection and analysis.
6. REFERENCES
1. Forestry Statistics Peninsular Malaysia (2014) Forestry Department Peninsular Malaysia. 233pp
2. Wyatt-Smith,J. (1995) Manual of Malayan silviculture for inland forest (second edition)Volume2 part 3 Chpaters
9-15 Forest Research Institute Malaysia
3. Anderson, J.A.R. (1961). The ecology and forest types of the peat swamp forests of Sarawak and Brunei in relation
to their silviculture. Ph.D. Thesis, University of Edinburgh, United Kingdom.
4. Philip,E. & Abdul Rahim N, (2009) Forest carbon inventory in Malaysia. Paper presented at 2009 International
Conference on Oil Palm and the Environment, 14th -15th August 2009, Serdang, Selangor. Malaysia.
5. Philip, E., Abd. Rahim, N. and Mohd Rizal, M.K. (2008). Preliminary observations of elevated CO2 and temperatures
on the photochemistry of selected species. Transactions of the Malaysian Society of Plant Physiology 16: 22-26.
6. Basuki TM, Laakea PE, Skidmorea AK, Hussina YA (2009) Allometric equations for estimating the aboveground
biomass in tropical lowland Dipterocarp forests. Journal of Forest Ecology and Management 257(8):1684-1694.
7. Istomo (2006) Phosphorus and calcium contents in soil and biomass of peat swamp forest: A case study at the
concession area of PT Diamond Raya Timber, Bagan Siapi-api, Riau Province, Sumatera. Jurnal Manajemen Hutan Tropika 12(3):38-55
8. C.C Verwer and P.J Van Der Meer (2010) Carbon Pools in tropical peat forests-Towards a reference value for forest
© 2019, IRJET | Impact Factor value: 7.211 | ISO 9001:2008 Certified Journal
| Page 30
9. Ipor, I.B.,C.S.,Tawan and H.S.Mustafa (2006) Floristic structure and tree spesies composition. The biodiversity of a
peat swamp forest in Sarawak (eds F. Abang, and I.Das)pp 61-86. Institute of Environmental Conservation, Universiti Malayasia Sarawak, Kota Samarahan
10. Istomo, H.S. Rahaju, E.Permana, S.I. Suryawan and A.W.Hidayat (2006) Monitoring dan evaluasi delineasi petensi
area projek karbon dan pendugaan cadangan karbon di wilayah kajian taman nasional berbakdan buffer-zone, propinsi Jambi dan area eks-plg,propinsi Kaliamntan tengah. Laporan kerjasama penelitian fakultas perhutanan IPB dan Wetland International Bogor
11. MoFor (2008) Reducing emissions from deforestation and forest degradation in Indonesia. Forestry Research and
Developement Agency (FORDA), Ministry of Forestry of the Republic of Indonesia.
12. IPCC (2000) Land Use, Land-Use Change, and Forestry - Robert T. Watson, Ian R. Noble, Bert Bolin, N. H.
Ravindranath, David J. Verardo and David J. Dokken (Eds.)
13. JPSM (1997) Manual Kerja Luar: Sistem Pengurusan Memilih (Selective Management System).Kuala Lumpur,
Forestry Department of Peninsular Malaysia. 323 pp.
14. Anderson, J.A.R. (1972) Trees of peat swamp forest of Sarawak. Sarawak Forest Department.
15. Ashton, P.S.(1982) Dipterocarpaceae. Flora Malesian 9; 237-552
16. Ng, F.S.P (1978) Tree Flora of Malaya, vol 3, Kuala Lumpur, Longman
17. Ng, F.S.P (1989) Tree Flora of Malaya, vol 4, Kuala Lumpur, Longman
18. Symington, C.F. (1941) Foresters' manual of Dipterocarps. Malayan Forest Records. No.16. Kuala Lumpur.Caxton
Press
19. Whitmore, T.C.(ed) (1972a) Tree Flora of Malaya, vol 1, Kuala Lumpur, Longman
20. Whitmore, T.C. (ed) (1972b) Tree Flora of Malaya, vol 2, Kuala Lumpur, Longman
21. Brown, S (1997) Estimating biomass and biomass change or tropical forests.A Primer. FAO Forestry Paper 134.
Rome: Forest Resource Assessment
22. Kato,R., Tadaki.,Y. and Ogawa., H.(1978) Plant biomass and growth increment studies in Pasoh Forest. Malayan
Nature Journal 30(2); 211-224
23. Chave, J., Condit, R.,Aguilar., S., Perez, R., & Lao,S. (2005b) Error propagation and scaling for tropical forest
biomass estimates. pp155-163 in Philips, O.L. & Malhi, Y. (eds) Tropical Forests and Global Atmospheric Change. Oxford University Press.
24. Komiyama, A., Ong, J.E., Poungparn, S. ( 2007) Allometry, biomass and productivity of mangrove forests: A review.
Aquatic Botany 89;128-137
25. Chave, J., Andalo, C., Brown, S., Cairns, M.A., Chambers, J.Q., Eamus, D., Folster, H., Fromard, F., Higuchi, N., Kira, T.,
Lescure, J.P., Nelson, B.W., Ogawa, H., Puig, H., Riéra, B., Yamakura, T., (2005a) Tree allometry and improved estimation of carbon stocks and balance in tropical forests. Oecologia 145, 87–99.
26. Ujang, S. , Elias,D.D. , & Istomo (2012) Estimasi simpanan karbon total dalam tanah dan vegetasi hutan gambut
dan tropika di Indonesia (Estimation of Total Carbon Stocks in Soil and Vegetation of Tropical Peat Forest in Indonesia), Jurnal Manajemen Hutan Tropika (JMHT) Vol. XVIII, (2);118-128 pp
27. Paramananthan, S. (2011). Keys to the identification of Malaysian soils according to parent materials (Mimeo).
Param Agricultural Soil Surveys, Selangor, Malaysia.
28. Anderson, J.A.R. (1963). The Flora of the Peat Swamp Forests of Sarawak and Brunei, including a catalogue of all
© 2019, IRJET | Impact Factor value: 7.211 | ISO 9001:2008 Certified Journal
| Page 31
29. Anderson, J.A.R. (1964). The structure and development of the peat swamps of Sarawak and B runei. The
Journal of tropical geography, 18, 7-16.
30. Anderson, J.A.R. (1983). The tropical peat swamps of Western Malesia. In: Gore AJP (ed) Ecosystems of the World,
Vol. 4B, Mires: Swamp, Bog, Fen and Moor. Elsevier Scientific Publishing Company, Amsterdam, 181-199.
31. Khali Aziz,H, Ismail, P, Abd Rahman, K.,Che Hashim,H. & Grippin, A (2007) Stand characteristics of one hectare
peat swamp forest ecological plot in Pahang, Malaysia. Unpublished report
32. Ismail, P, Nizam, M.S., Faridah-Hanum,I.,Khali Aziz,H., Shamsudin,I., Samsudin,M., & A.Latiff (2009) Community
structure, diversity and biomass of trees in two forest subtypes of Pekan Forest Reserve, Pahang Malaysia. The Malaysian Forester 72(1):117-133.
33. Blackett, H. and Wollesen, L. (2005) Timber Resource Assessment and Forest Zoning of Pekan Forest Reserve.
DANIDA Peat Swamp Forest Project. Document No. 4 Kuantan: DANIDA (unpublished report)
34. Alterra Report (2010)C.C Verwer & P.J Van Der Meer (eds) Carbon pools in tropical peat forests- Towards a
reference value for forets biomass carbon in relatively undisturbed peat swamp forests in Southeast Asia. Wageningen, The Netherlands. Alterra-report 2108; 64p.
35. Whittaker RH & Linkens GE (1973) Carbon in the biota. In Woodwell GM, Pecan EV, Carbon in the biosphere,
Proceedings of the 24th Brookhaven Symposium in Biology. Upton, New York: United States Atomic Energy Commisiion; 281-302
36. Hairiah K, Rahayu S. (2007). Pengukuran ‘karbon tersimpan’ di berbagai macam penggunaan lahan. Bogor. World
Agroforestry Centre - ICRAF, SEA Regional Office, University of Brawijaya,, Indonesia; 77 p
37. Norashikin,F., Sarah,A. & Latiff, A. (2015).Biomass and Carbon Stock estimation of Hill Dipterocarp Forests in
![Table 1: PSF coverage area in Johor, Pahang, Selangor in 2014 [1].](https://thumb-us.123doks.com/thumbv2/123dok_us/9414891.442985/1.595.114.482.600.711/table-psf-coverage-area-johor-pahang-selangor.webp)
![Table 3: Published values of aboveground biomass (AGB) and aboveground carbon (AGC) in logged-over or degraded peat swamp forest (PSF) [8]](https://thumb-us.123doks.com/thumbv2/123dok_us/9414891.442985/2.595.93.502.473.653/table-published-values-aboveground-biomass-aboveground-carbon-degraded.webp)