Original Article
Establishing reference intervals of gastrin-releasing
peptide precursor by analysis of laboratory-stored data
Li-Yue Zhao1*, Yang-Chun Feng1*, Zhao-Xia Zhang2, Yan-Chun Huang1
1Clinical Laboratory Center, The Tumor Hospital Affiliated to Xin Jiang Medical University, Urumqi 830011, Xinjiang, China; 2Clinical Laboratory Center, The First Affiliated Hospital of Xin Jiang Medical University, Urumqi 830011, Xinjiang, China. *Equal contributors.
Received March 15, 2017; Accepted January 28, 2018; Epub April 15, 2018; Published April 30, 2018
Abstract: Objective: To establish and verify the feasibility of reference intervals (RIs) of gastrin-releasing peptide pre-cursor (ProGRP) by analysis of laboratory-stored data. Methods:The detection results of ProGRP from outpatients and health examinations were collected from the population in the First Hospital and Tumor Hospital Affiliated to Xinjiang Medical University from January 2015 to December 2016. Simultaneously, the general characteristics of the population were collected using a laboratory information management system.A total of 16384 ProGRP cases were collected. All ProGRP tests were measured using Abbott fully automated microparticle luminescence analyzer. The ProGRP RIs of different sexes and ages were established by differentially optimized statistical methods, which included the Hoffmann method, the NLT Hoffmann method (in which the natural logarithm was calculated first and then the Hoffmann method was performed), the Tukey method, the NLT Tukey method (in which the natural loga-rithm was calculated first and then the Tukey method was performed), and the non-parametric method. Results: There were no significant differences in the ProGRP results between males and females (P > 0.05). The ages were positively correlated with the measured value of the ProGRP (R = 0.342, P < 0.05), which could be grouped accord-ing to ages. The established RIs of ProGRP in this study was 8.53-67.575 pg/ml. Conclusion: Accordaccord-ing to different statistical methods, we established the RIs of ProGRP in this study, which will be of certain reference value to the future laboratory studies.
Keywords: Gastrin-releasing peptide precursor, reference intervals
Introduction
Gastrin releasing peptide (GRP) is a neuropep-tide substance similar to bombesin, which is composed of 27 amino acids, but it is extreme-ly unstable [1]. The ProGRP fragment (31-98) obtained from the translation product GRP is currently used for detection [2]. Studies have shown that the ProGRP fragment (31-98) in serum of patients with SCLC was a stable mark-er [3].
The ProGRP RIs recommended by the curr- ent reagent manufacturers is 0-35 pg/ml. The investigators tested samples of 194 healthy individuals who had no lung disease and nephropathy. Including 170 males and 24 fe- males, aged 20-63 years, with an average age of 45.7 years. The results showed that the ProGRP value of 95% samples was less than or equal to 35 pg/ml. However, in our clinical
Materials and methods
Source of sample materials
The general characteristics data used in this study was obtained from the Laboratory In- formation Management System of the First and Third Affiliated Hospital of Xin Jiang Medical University. A total of 16384 ProGRP cases we- re collected. Taking into account that physi- cal examinations were usually a person older than 18-year-olds, therefore, this study only analyzed the indicators of adults over 18 years of age. First, make clear the inclusion and exclusion criteria in this study. The inclusion criteria included the following: complete and accurate laboratory tests, Physical health, ph- ysical examination and outpatients, no previ-ous kidney disease [9], no history of lung dis-ease. The exclusion criteria included the follo- wing: results after the first of multiple tests fol-lowing the same treatment, incomplete person-al information of the patient, or other chronic diseases. The final data included 12380 cases, 7943 males and 4437 females.
Instruments and reagents
This study was used the American Abbott i2000 automatic microparticle chemiluminescence immunoassay analyzer and Abbott support of the ProGRP detection kits and standards [10]. Internal quality control was performed using Bio-Rad’s conventional Tumor Marker Item Control. Daily internal quality control was per-formed using the Westgard Multiple IQC rules, etc. The cumulative coefficient of variation in this lab was 5%.
Research methods
Normality test of data
The data was analyzed and normalized by the skewness-kurtosis (s-k) value method. When the s-k values of the test were less than 1.96 times of the standard deviation, this distribu-tion was considered a normal distribudistribu-tion [11]. For non-normal distributions, the logarithmic data could convert to a normal distribution curve. By plotting the histogram of frequency distribution, the situation of normal distribution was presented visually.
Eliminating outliers
According to the clinical laboratory standard document EP28-A3, the Dixon method is the
recommended method for eliminating outliers. The operation steps are as follows. First, we calculated the range R (the difference between maximum and minimum) and then selected three consecutive measurements, A1, A2 and A3, and performed the following calculation: X1 = |(A2-A1)|/R, X2 = |(A3-A2)|/R. If X1/R > 1/3 or X2/R > 1/3, then the value was removed as an outlier [12]. The loop was screened until all outliers were removed. According to this method, the final data included 11274 cases, of which there were 7178 male cases and 4096 female cases.
Data analysis
The final data included 11274 cases, including 7178 males and 4096 females. The age break-down was as follows: 18-30 years old in 257 cases, 31-50 years old in 3347 cases, 51-70 years old in 5200 cases, and more than 70 years old in 2470 cases. The data was grouped according to sexes, and the non-parametric rank-sum test was used to test whether there were significant differences between the sexes. If there were significant differences, patients were grouped according to gender. Spearman correlation analysis was used to determine whether the measured value was age-related. If there was a correlation, the RIs was estab-lished according to age (Supplementary Data).
Five methods used to establish the RIs
The Hoffmann analysis method: The Hoffmann method was a cumulative frequency probability map that was presented by Hoffmann et al in 1963 and constructed by observing and sele- cting the linear part of the data [13]. According to the literature, the criterion of selecting the linear part of the data was to set a linear devi- ation of 10% as an acceptable error standard [14]. Using ProGRP measurements as the dependent variable Y and the cumulative prob-ability for the independent variable X, fitting the linear regression equation was as follows: Yi = α + βXi + еi. Therefore, X = 2.5%, X = 97.5%, RImin = α + 0.025β and RImax = α + 0.975β. RImin and RImax were the lower and upper limits of the 95% reference interval, respectively [15].
The Tukey analysis method: American statisti-cian John Tukey put forward the Tukey method in 1977. The Tukey method calculated the inter-quartile range (IQR) as the difference between the 25th and 75th percentiles. All values below the 25th percentile minus 1.5 times the IQR were removed, and at the same time, all values above the 75th percentile plus 1.5 times the IQR were removed [16].
NLT Tukey method: The Tukey method was applied herein after calculating the natural log-arithm of the data.
Eliminating outliers
[image:3.612.93.369.73.264.2]By means of the Dixon method, the final data included 11274 cases, of which there were 7178 males and 4096 females. The age break-down was as follows: 18-30 years old in 257 cases, 31-50 years old in 3347 cases, 51-70 years old in 5200 cases, and more than 70 years old in 2470 cases. We used this informa-tion to draw the frequency distribuinforma-tion histo-gram and observe the distribution of the data in Figure 2.
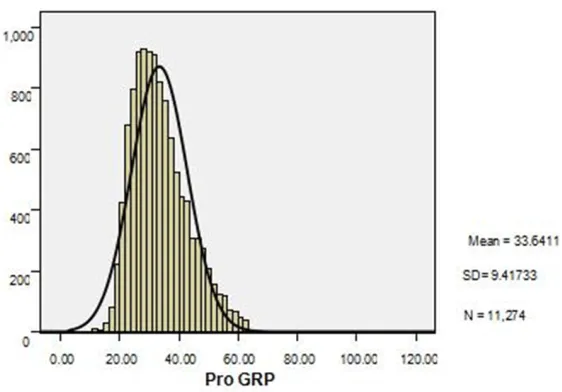
Figure 1. Histogram of 12380 ProGRP cases: horizontal ordinates repre-sent ProGRP test values, and vertical ordinates reprerepre-sent the frequency. The curve is the ProGRP normal distribution curve.
Figure 2. Histogram of 11274 ProGRP cases: horizontal ordinates represent ProGRP test values, and vertical ordinates represent the frequency. The curve is the ProGRP normal distribution curve.
Non-parametric statistical me- thod: After ranking the final data, the non-parametric sta-tistical method was used to calculate the values of 2.5% and 97.5%, respectively.
Statistical analysis
Microsoft Office Excel 2007 and SPSS19.0 software were used for analysis.
Based on biological variability (RCV = 21/2 × Z × [CVA2 +
CVI2]1/2), we calculated whe-
ther the results had significant meaning and compared them with RIs currently used in the lab.
We then used the “1/3” rule of the EP28-A3 document to determine whether the RIs in this study could be accepted [17].
Compared the RIs used at present with the RIs estab-lished in this experiment. Results
Data distribution
[image:3.612.91.372.324.520.2]Detection results of ProGRP in different gen-der
The SPSS software was used to calculate the non-parametric rank sum test, and the results showed that there was no significant differen- ce between males and females (P > 0.05) and the RIs could not be set according to gender.
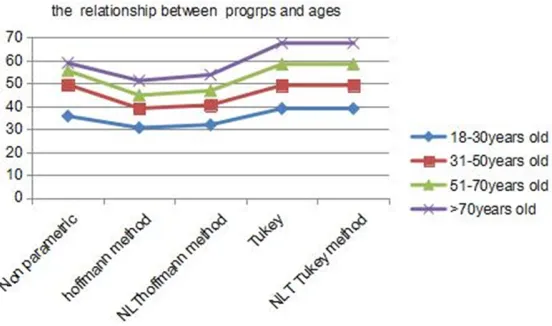
Correlation between the results of ProGRP and ages
Using the Spearman correlation statistical an- alysis, the final data included 11274 cases. According to SPSS and Excel statistical analy-ses, the ProGRP test results and different ag- es have a positive correlation (r = 0.342, P < 0.05).
tion in this lab was 5%. Using the formula RCV = 21/2 × Z × [CVA2 + CVI2]1/2, we were able to
calculate whether the results of this study we- re significant. Z represented a 95% confidence interval, for which 1.96 was used. CVA repre-sented the laboratory cumulative variation coefficient and CVI represented the individual biological variability. In this study, RCV = 21/2 ×
1.96 × [0.052 + 0.147]1/2 = 42.85%. The RIs
currently used in the laboratory is 0-50 pg/ml. Compared the differences in the RIs estab-lished by the different methods and different ages (including RCVmin and RCVmax).
RCVmin = (RImin-RI’min)/RI’min, RI’min is the smaller of two.
[image:4.612.93.370.74.235.2]RCVmax = (RImax-RI’max)/RI’max, RI’max is the larger of two.
Figure 3. Line charts showing lower limits in the RIs of different ages using different statistical methods.
Figure 4. Line charts showing upper limits in the RIs of different ages using different statistical methods.
Establishment of RIs for differ-ent statistical methods
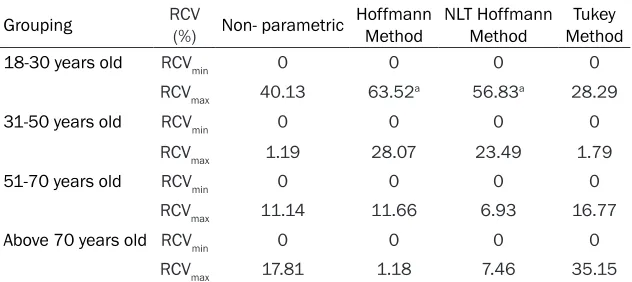
[image:4.612.94.370.288.451.2]varia-Table 1. Comparison of reference change values between RIs of different ages and RIs provided by manufacturer
Grouping RCV (%) Non- parametric Hoffmann Method NLT Hoffmann Method MethodTukey
18-30 years old RCVmin 0 0 0 0
RCVmax 40.13 63.52a 56.83a 28.29
31-50 years old RCVmin 0 0 0 0
RCVmax 1.19 28.07 23.49 1.79
51-70 years old RCVmin 0 0 0 0
RCVmax 11.14 11.66 6.93 16.77
Above 70 years old RCVmin 0 0 0 0
RCVmax 17.81 1.18 7.46 35.15
aEither RCV
min or RCVmax calculated between two reference intervals is larger than the
allow-able RCV.
RCVmin = (11.806-0)/0 × 100% = 0%
RCVmax = (50-35.68)/35.68 × 100% = 40.13% Compared the calculated RCVmin and RCVmax with RCV (42.85%). If RCVmin and RCVmax are smaller than RCV, there is no difference between two RIs; if RCVmin and RCVmax are larger than RCV, there is difference between two RIs. It could be seen from Table 1.
Based on the EP28-A3 document proposed by CLSI to calculate RIs, ProGRP was measured in 80 healthy subjects in different four groups, if the RIs established by different age groups did not exceed the threshold value in more than 3 cases, which could be seen from Table 2 the RIs established by each group can be accepted. The RIs established in this study was validated in this laboratory, and the normal RIs of ProGRP was 8.53-67.575 pg/ml. The lowest value and the highest value are higher than the RIs currently used. From the Table 3 we can see, the RIs established by this study is better able to cover healthy people.
Discussion
Presently, the laboratory method used to establish the RIs is a direct method provided according to EP28-A3. However, it is very diffi-cult to meet the standards in actual operations. Thus, many scholars have considered using an indirect method based on large sample statis- tical analyses such as the Robust method or Bhattacharya method to calculate RIs [19]. Th- is study used five different statistical me- thods to establish the ProGRP RIs.
ne, urea nitrogen and thyrotropin [20]. Dorizzi repeated the RIs for TSH established by this method, and the results were consistent with the results of Katayev. Therefore, this method is recommended by many scholars, both domestic and overseas [21]. The Hoffmann method requires the data to obey the normal distribution, and if the data are not included in the normal distribution, this method may be biased. There are several means to transform data, such as logarithmic, Box-Cox conversion and others. After log transformation, the data is converted to approximate normal distribution conditions (Skewness = 0.7, Kurtosis = 0.3). The most important step for establishing RIs using the Hoffmann method is to select the appropriate method to eliminate abnormal val-ues. The NLT Hoffmann method also need to eliminate abnormal values. The method chosen in this study is the Dixon method, which is rec-ommended by CLSI. Then plot the cumulative probability distribution of the data, but the lin-ear part selected in this step has a certain degree of subjectivity. Based on the cumulative probability distribution curve, visualization or subjective set deviation values of 5%, 10%, 15% or other ranges can be used to choose the appropriate deviation value. Now there is no scientific conclusion and selection method. Studies have shown that 10% deviation using the Hoffman method is the best choice because it may be more reasonable.
First using the natural logarithm and then us- ing the Hoffmann method analysis essentially reduces the variance and the absolute value of the data. Additionally, it is convenient to
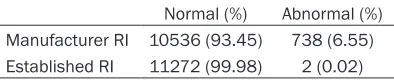
[image:5.612.91.407.97.238.2]Table 3. Change frequencies of normal and abnormal ProGRP with new RI and manufac-turer RI
Normal (%) Abnormal (%) Manufacturer RI 10536 (93.45) 738 (6.55) Established RI 11272 (99.98) 2 (0.02)
culate. Taking the natural logarithm does not change the nature of the data or the correlation between the variables, but the compression scale makes the data more stable. From the results of this study, it can be seen that the RIs (0-51.177 pg/ml) established by Hoffmann method is the most similar to the RIs (0-50 pg/ml) used in the lab presently. This method can be used to obtain a large enough sample size to cover different sexes, ages, and clinical test results that are particularly applicable. RIs were also established by using the Tukey method. The characteristics of the data can be clearly identified and the distribution character-istics (the minimum value, the next four digits, the median, the top four digits and the maxi-mum value) can be displayed intuitively. In this study, the cartographic method was used to compute the RIs across different ages, but this method could not provide precise measure-ments of skewness or weight of the data distri-bution. For statistics using larger data sets, the information reflected by the shape is more ambiguous. There are some limitations in using the median to represent the overall average. Next, we took the natural logarithm first, and then analyzed the data using the Tukey od. Since the RIs calculated by the two meth-ods (Tukey method and NLT Tukey method) are the same, only one set of RIs using the Tukey method is shown in this study. This method is used less often in the literature and is often used as an outlier removal method. It has high
scientific and practical value need to be further explored and studied.
The non-parametric method is a commonly used method to calculate biological RIs. The sample numbers have higher requirements, but the specific distribution of the data is no hard requirements. In this study, the RIs cal- culated using the non-parametric method are higher than the RIs calculated by other meth-ods. Because this method is simple and the metering level is low, it is not as sensitive as the parameter statistical method.
Using the formula for RCV biological variation, we compared the RIs of ProGRP used current- ly and the RIs calculated using the different statistical methods in this study. After statisti-cal analysis, there was no significant statististatisti-cal difference between different statistical meth-ods and the current data. Although there is a large quantity of data in this study, it does not exclude the existence of abnormal physical ex- amination data that may be included. The sta-tistical methods used (the Tukey method in particular) are not popular nor applied by the majority of scholars and need to be further explored. If there is a patient with a ProGRP value slightly higher than the upper limit of the RIs, whether or not the patient has a lung dis-ease is still an issue to be discussed. The upper limits of the RIs depends on the unilateral 95th percentile. In fact, there are some physi-cal examinees who are in good health, but the detection value of ProGRP is really higher than the upper limit of the RIs. Under these circum-stances, the patient should be carefully ana-lyzed to reduce the need for treatment or unnecessary examinations.
[image:6.612.90.287.232.273.2]Over time, hospital information management systems have been gradually improved. The in- direct method is simpler than the direct meth-od, and the price and technical requirements Table 2. Verify the RIs in different ages established in this study
Grouping N manufacturer Reagent (pg/ml)
Reference intervals (in this
study)
Reference intervals validation 18-30 years old 20 0-50 8.53-38.973 8.90-33.610 31-50 years old 20 0-50 10.663-49.413 11.330-32.50 51-70 years old 20 0-50 15.020-58.385 15.74-49.120 Above 70 years old 20 0-50 15.2-67.575 16.930-51.60
are low. The method is especially suitable to establish RIs according to the indexes of labo-ratories in different regions and across differ-ent populations.
Disclosure of conflict of interest
None.
Address correspondence to: Yan-Chun Huang, Cli- nical Laboratory Center, The Tumor Hospital Affi- liated to Xin Jiang Medical University, No.789 Suzhou Street, Urumqi 830011, Xinjiang, China. Tel: 0991-7819420; E-mail: [email protected]
References
[1] Stieber P, Dienemann H, Schalhorn A, Schmitt UM, Reinmiedl J, Hofmann K and Yamaguchi K. Pro-gastrin-releasing peptide (ProGRP)--a useful marker in small cell lung carcinomas. Anticancer Res 1999; 19: 2673-2678. [2] Aoyagi K, Miyake Y and Urakami K. Enzyme
im-munoassay of immunoreactive progastrin-re-leasing peptide (31-98) as tumor marker for small-cell lung carcinoma: development and evaluation. Clin Chem 1995; 41: 537-543. [3] Oh HJ, Park HY, Kim KH, Park CK, Shin HJ, Lim
JH and Kwon YS. Progastrin-releasing peptide as a diagnostic and therapeutic biomarker of small cell lung cancer. J Thorac Dis 2016; 8: 2530-2537.
[4] Aral H, Usta M, Cilingirturk AM, Inal BB, Bilgi PT and Guvenen G. Verifying reference intervals for coagulation tests by using stored data. Scand J Clin Lab Invest 2011; 71: 647-652.
[5] Zhang GM, Guo XX, Zhu BL, Zhang GM, Bai SM, Wang HJ, Ma XB and Zhou YT. Establishing ref-erence intervals of aspartate aminotransfer-ase-to-platelet ratio index for apparently healthy elderly. Clin Lab 2016; 62: 135-140. [6] Henny J. Determiningand verifying reference
intervals in clinical laboratories. Ann Biol Clin 2011; 69: 229-237.
[7] Shaw JL, Cohen A, Konforte D, Binesh-Marvas-ti T, Colantonio DA and Adeli K. Validity of es-tablishing pediatric reference intervals based on hospital patient data: a comparison of the modified Hoffmann approach to CALIPER refer-ence intervals obtained in healthy children. Clin Biochem 2014; 47: 166-172.
[8] Feng Y, Bian W, Mu C, Xu Y, Wang F, Qiao W, Huang Y. Establish and verify TSH reference intervals using optimized statistical method by analyzing laboratory-stored data. J Endocrinol Invest 2014; 37: 277-284.
[9] Molina R, Filella X and Auge JM. ProGRP: a nem biomarker for small cell lung cancer. Clin Biochem 2004; 37: 505-511.
[10] Stieber P, Molina R and Dowell B. Clinical eval-uation of the ARCHITECT ProGRP assay. Tho-racic Oncology 2008; 3: 236.
[11] Zhou JX. Probability and mathematical statis-tics. China Statistics Press 2007; 232-239. [12] Aitkenhead H and Heales SJ. Establishment of
paediatric age-related reference intervals for serum prolactin to aid in the diagnosis of neu-rometabolic conditions affecting dopamine metabolism. Ann Clin Biochem 2013; 50: 156-158.
[13] Katayev A, Balciza C and Seccombe DW. Estab-lishing reference intervals for clinical laborato-ry test results: is there a better way. Am J Clin Pathol Zolo 2010; 133: 180-186.
[14] Katayev A, Fleming JK, Luo D, Fisher AH and Sharp TM. Reference intervals data mining: no longer a probability paper method. Am J Clin Pathol 2015; 143: 134-142.
[15] Hoffmann RG. Statistics in the practice of medicine. JAMA 1963; 185: 864-873.
[16] Strich D, Karavani G, Levin S, Edri S and Gillis D. Normal limits for serum thyrotropin vary greatly depending on method. Clinical Endocri-nology 2016; 85: 110-115.
[17] Gary L, Sousan A, James C, Ferruccio C, Paul H and Amadeo P. Defining, establishing, and ver-ifying reference intervals in the clinical labora-tory; approved guideline-third edition. Clin Lab Standards Institute 2010; 2: 1-59.
[18] Qi Z, Zhang L, Chen Y, Ma X, Gao X, Du J, Zhang F, Cheng X and Cui W. Biological variations of seven tumor markers. Clin Chim Acta 2015; 450: 233-236.
[19] Thygesen K, Alpert JS and White HD. Universal definition of myocardial infarction. J Am Coll Cardiol 2007; 50: 2173-2195.
[20] Horowitz GL. Estimating reference intervals. Am J Clin Pathol 2010; 133: 175-177.