Original Article
Changes in neurochemical metabolism measured by
magnetic resonance spectroscopy and expression of
the ERK signaling pathway in a rat model of depression
Wei Zhang1,2,3, Caixia Yang2, Xianglin Li2, Tongshen Liu2, Huiqiong Luo2, Ning Mao4, Qi Zhang2, Bin Wang1,2
1Shandong Medical Imaging Research Institute, Shandong University, No. 324, Jingwu Road, Huaiyin District, Jinan 250021, Shandong Province, China; 2Binzhou Medical University, No. 346, Guanhai Road, Laishan District, Yantai 264003, Shandong Province, China; 3Dezhou University, No. 566, Daxue West Road, Decheng District, Dezhou 253023, Shandong Province, China; 4Yantai Yuhuangding Hospital, No. 20, Yuhuangding East Road, Zhifu District, Yantai 264000, China
Received June 9, 2019; Accepted October 7, 2019; Epub December 15, 2019; Published December 30, 2019
Abstract: Objective: To explore the neurochemical metabolism in the brain of rats with chronic unpredictable mild stress (CUMS) using magnetic resonance spectroscopy (MRS). Methods: All rats were anesthetized and scanned in axial, sagittal, and coronal positions with a 7.0 T MRI. The signals of N-acetylaspartate (NAA), choline-containing compounds (CHO), glutamate (GLU), and myo-inositol (MI) were determined by PRESS sequence acquisition 1H spectra in the hippocampus and prefrontal cortex. After scanning, the target antigen was detected by immunohis-tochemistry (IHC). Results: The sucrose consumption in the model group was significantly decreased compared with the control group (P<0.05). The level and vertical scores of the model group in an open field experiment were significantly lower than the control group (P<0.05). The ratios of NAA:Cr in the left and right hippocampus, as well as the left and right prefrontal cortex, were decreased in the model group compared with the control group (P<0.05). The ratios of GLU:Cr and CHO:Cr in the left and right hippocampus and the left prefrontal cortex of the model group were both decreased compared with control group (P<0.05). The expression of brain-derived neurotrophic factor (BDNF) and phosphorylated-ERK (p-ERK) were significantly decreased in the model group (P<0.01). Conclusion: Our results showed that the hippocampus and prefrontal cortex are essential in the pathogenesis of depression and that the ERK signaling pathways are important targets for studying the mechanism of action of antidepressants.
Keywords: Depression, rat, magnetic resonance spectroscopy, BDNF, ERK signaling pathway
Introduction
Depression is considered to be the most com-mon mental disorder and comprises a group of mood disorders, which occurs due to various causes, with depressive mood as the main sy- mptom. The pathogenesis underlying depres-sion is complex and involves neural networks and multi-system dysfunction. Although a great deal of research has led to progress, the
spe-cific pathogenesis of depression is still not clar
-ified. Therefore, more research and discussion
regarding depression are valuable.
Magnetic resonance spectroscopy (MRS) is a method of determining molecular composition
and spatial configuration by using the chemical
shift phenomenon in magnetic resonance, and
MRS is the only non-invasive technique avail-able for determining the chemical composition
of a specific tissue in a living body. MRS plays a
sig-Changes in neurochemical metabolism in a rat model of depression
naling pathways generally correlate with each other. An increasing number of studies have fo- cused on the changes in signal transduction pathways [3].
This study was carried out using the accepted chronic unpredictable mild stress (CUMS) rat model with a focus on the hippocampus and the prefrontal lobe as the encephalic regions for study. Changes in intracerebral substance metabolism of depressed rats were observed by MRS. In addition, the pathogenesis of de- pression was analyzed and discussed from the perspective of ERK signaling pathway com-bined with immunohistochemistry (IHC). Material and methods
Animals
Male Sprague Dawley (SD) rats weighing 220-250 g were purchased from the Beijing Belife Bio-Medical Technology (Beijing, China) and provided by theExperimental Animal Center of the Academy of Military Medical Sciences
(cer-tificate number: SCXK [Army] 2012-0004).
Ani-mals were housed in a lighted facility at 18°C± 4°C with water available ad libitum for 3 days. Twenty-six rats were randomly divided into the following 2 groups: 16 rats in the CUMS model group; and 10 in the control (CON) group. Rats in the CON group were given ordinary daily care in a safe and calm environment. This study was approved by the Animal Ethics Committee of our institute.
CUMS procedure
The CUMS model was carried out according to the method of Willner et al. [4]. Rats were exposed to different stressors for 6 weeks, including isolated housing, cold water swim-ming for 5 min at 10°C, overnight illumination, rotation on a shaker for 15 min, tilted cage with 45°C for 24 h, fasting for 24 h, water depriva-tion for 24 h, tail clipping for 1 min at a 1-cm distance from the tail root, and white noise for 24 h. Each stress stimulus was irregular and discontinuous. After 6 weeks, the sucrose
pref-erence and open field tests were performed.
Sucrose preference test
After the stress stimulation test, rats in the two groups were presented with 1% sucrose water. The amount of sucrose consumption was
mea-sured after 1, 2, and 3 h by weighing the water bottles.
Open field test
All rats were tested in an open field, which con -sisted of a black square base (80 cm×80 cm) and black walls (40 cm each). The base was divided into peripheral and central sectors with an equal area of 25 squares. The score of level and vertical activities was recorded for 3 min.
MRI/MRS acquisition
MRI was conducted on a 7.0 T animal MRI scan-ner (70/20 PharmaScan, Bruker Biospin GmbH, city, Germany), using a 38-mm birdcage rat brain quadrature resonator for radiofrequency transmission and reception. Rats were
anes-thetized using isoflurane/O2 (3% for induction and 1.5%-2.5% for maintenance). During the MRI scan, each rat was in a prostrate position on the bed to minimize head motion, whereas respiration was maintained at a rate of 50-60 breaths/min. Scout T2-weighted imaging (T2 WI) was performed in three planes using a TuberRARE sequence. First, an axial scan of the rat head positioning was acquired using the following parameters: repetition time (TR) =
3500 ms; echo time (TE) = 33 ms; field of view
= 32 mm×30 mm; matrix size = 256×256; slice thickness = 0.8 mm; slice gap = 0 mm; and ac- quisition time = 7 min 28 s. Next, coronal and sagittal T2 WI scans were acquired. For single-voxel 1H MRS of the bilateral hippocampus and
prefrontal lobe cortex, a 2 mm×2 mm×2 mm area was selected. After shimming and water suppression, the PRESS sequence acquisition spectrum was as follows: TR = 2000 ms; TE = 35 ms; sampling points to 1024; and total time = 33 min 28 s. All spectra were initially pro-cessed using Topspin 5.0 software provided on the scanner. The data between 0.0 and 4.0 ppm were analyzed in the water-suppressed time domain. Thus, the peaks of the major neu-rometabolites were NAA at 2.0 ppm, Cho at 3.22 ppm, Glu at 2.35 ppm, MI at 3.56 ppm, and Cr at 3.0 ppm based on in vivo1H MRS. The
ratios of NAA:Cr, CHO:Cr, GLU:Cr, and MI:Cr were calculated.
IHC procedure
After MR scanning, all of the rats were
in 10% formaldehyde. After dehydration and wax embedding, the specimens were cut in the
coronal plane (4-μm sections). The sections
were dewaxed and antibodies were added. Fi- nally, all sections were observed under an Oly- mpus microscope (400×) after dehydration and mounting.
Statistical analysis
Data are expressed as the mean ± SEM. Sta- tistical analyses were carried out using SPSS 20.0 software (SPSS, Inc., Chicago, IL, USA). T-tests were used to determine the difference between the model and control groups. The
sig-nificance level was set at a P≤0.05.
Results
Sucrose preference test
The CUMS model group had a significant reduc
-tion in sucrose preference compared with the CON group (54.64±2.81 [CON] vs. 81.12±6.7 [CUMS], P<0.05 [t-test]; Figure 1A).
Open field test
The on-center distance in the CUMS group
(684.43±213.4) was significant compared with
the CON group (1195.91±217.96, P<0.05). The center duration in the CUMS group (5.07±1.25)
was significant compared with the CON
gro-up (8±2.16; P<0.05). The velocity in the CUMS
group (208.72±28.11) was significant
compa-red with the CON group (111.66±18.48, P< 0.01; Figure 1B).
Ratios of NAA:Cr, CHO:Cr, GLU:Cr, and MI:Cr in the hippocampus and prefrontal cortex
The ratios of NAA:Cr in the left and right hippo-campus, and ratios in the left and right
prefron-tal cortex were significantly decreased in
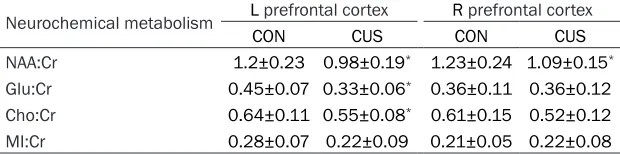
de-pressed rats compared with the CON group (1.19±0.14 [CON] and 1.08±0.1 [CUMS] in the left hippocampus, P<0.05; 1.14±0.67 [CON] and 1.08±0.08 [CUMS] in the right hippocam-pus, P<0.05; 1.2±0.23 [CON] and 0.98±0.19 [CUMS] in the left prefrontal cortex, P<0.05; 1.25±0.22 [CON] and 1.09±0.15 [CUMS] in the right prefrontal cortex, P<0.05). The ratios of GLU:Cr in the left and right hippocampus and ratios in the left prefrontal cortex were signi-
ficantly decreased in depressed rats
compa-red with the CON group (0.41±0.09 [CON] and 0.28±0.1 [CUMS] in the left hippocampus, P< 0.01; 0.38±0.13 [CON] and 0.27±0.05 [CUMS] in the right hippocampus, P<0.01; 0.45±0.07 [CON] and 0.33±0.06 [CUMS] in the left pre-frontal cortex, P<0.01). The ratios of CHO:Cr in
[image:3.612.93.521.69.274.2]the left and right hippocampus were significant -ly decreased in the CUMS group compared with the CON group (0.67±0.12 [CON] and 0.57± 0.11 [CUMS] in the left hippocampus, P<0.05; 0.67±0.15 [CON] and 0.54±0.09 [CUMS] in the right hippocampus, P<0.05; 0.64±0.11 [CON]
Changes in neurochemical metabolism in a rat model of depression
and 0.55±0.08 [CUMS] in the left prefrontal cortex, P<0.05; Tables 1 and 2; Figure 2A and 2B).
Expression of BDNF and p-ERK in the hippo-campus and prefrontal cortex
The expression of brain-derived neurotrophic factor (BDNF) in the hippocampus and the
pre-frontal cortex were significantly decreased in
the CUMS group compared with the CON group (0.001518±0.000572 [CON] and 0.000248± 0.000278 [CUMS] in the hippocampus, P<0.01; 0.005214±0.001569 [CON] and 0.001734± 0.001805 [CUMS] in the prefrontal cortex, P<0.01). The expression of p-ERK in the
hippo-campus and the prefrontal cortex were signifi
-cantly decreased in the CUMS group compa- red with the CON group (0.013495±0.005621 [CON] and 0.000689±0.000564 [CUMS] in the hippocampus, P<0.01; 0.001351±0.001353 [CON] and 0.000106±0.000262 [CUMS] in the prefrontal cortex, P<0.05; Table 3; Figure 3A and 3B).
Discussion
There were several major peak signals in 1H
MRS (NAA, Glu, Cho, and MI). Cr is a symbol of energy metabolism in vivo, and is commonly used as an internal standard to compare the changes in other metabolites [5]. Cr includes
lites in different regions of the prefrontal lobe and hippocampus in patients with depression [7, 8]. Gonul et al. [9] conducted a study focus-ing on the medial frontal cortex of patients with depression, indicating that the NAA:Cr ratio in this region was lower than the normal control group. Therefore, the corresponding results suggest that in patients with depression, the level of frontal cortex neuronal activity is de- creased, followed by a lower level of neuronal viability or density, eventually resulting in dys-function in the encephalic region. Xi et al. [10] reported that the NAA:Cr ratio in the
hippocam-pus of rats was significantly lower than the con -trol group using the CUMS model. In this study
the NAA:Cr ratio significantly decreased in the
left and right hippocampus as well as the left and right prefrontal cortex in depressed rats compared to controls, suggesting neuron dam-age and dysfunction in the hippocampus and prefrontal cortex of the CUMS model.
CHO reflects the storage of total choline in the
brain, which is one of the main components of the cytomembrane phospholipid metabolism. [CHO or choline?] is also the precursor of
neu-rotransmitter acetylcholine and changes reflect
renewal of the cell membrane. At present, there is no consensus on the interpretation of the CHO peak, and there are many contradictory studies. An international study [11] document-Table 1. Comparison of 1H-MRS in hippocampus between the CON and
CUS
Neurochemical metabolism Lhippocampus R hippocampus
CON CUS CON CUS
NAA:Cr 1.19±0.14 1.08±0.1* 1.14±0.67 1.08±0.08* Glu:Cr 0.41±0.09 0.28±0.1* 0.38±0.13 0.27±0.05* Cho:Cr 0.67±0.12 0.57±0.11* 0.67±0.15 0.54±0.09* MI:Cr 0.24±0.05 0.25±0.05 0.26±0.05 0.25±0.04
[image:4.612.91.400.97.178.2]*P<0.05.
Table 2. Comparison of 1H-MRS in prefrontal cortex between the CON
and CUS
Neurochemical metabolism L prefrontal cortex R prefrontal cortex
CON CUS CON CUS
NAA:Cr 1.2±0.23 0.98±0.19* 1.23±0.24 1.09±0.15*
Glu:Cr 0.45±0.07 0.33±0.06* 0.36±0.11 0.36±0.12
Cho:Cr 0.64±0.11 0.55±0.08* 0.61±0.15 0.52±0.12
MI:Cr 0.28±0.07 0.22±0.09 0.21±0.05 0.22±0.08
*P<0.05.
creatine and creatine phosphate, which are stable in various phy- siologic and patholog- ic conditions. NAA has the highest peak within the normal 1H spectrum,
which is primarily locat-ed in neurons and syn-apses and is recognized as a neuronal marker [6]. The NAA level is an indicator of an increase or decrease in the num-ber of neurons. A dec- rease in the NAA:Cr ratio suggests loss of neu-rons or a disorder of ne- urologic function [2]. Va- rious researchers have used 1H MRS to detect
[image:4.612.90.400.238.315.2]metabo-ed that the CHO signal in the hippocampus region of patients with depression was reduced compared with the normal control group, re- vealing the occurrence of abnormal membrane phospholipid metabolism. In addition, this ab- normality could be improved by electric shock
treatment. Based on research involving adoles-cents with depression, Ning et al. [7] found that the CHO:Cr ratio in the white matter of the left dorsolateral prefrontal in the depression group
was significantly lower than the control group.
[image:5.612.92.524.71.462.2]An experimental study by Hong et al. [12] found
Figure 2. A. Voxel areas for the hippocampus. Typical proton MR spectra in the left and right hippocampus of a rat with depression (lower) and a control rat (upper). B. Voxel areas for the prefrontal cortex. Typical proton MR spectra in the left and right prefrontal cortex of a rat with depression (lower) and a control rat (upper).
Table 3. Comparison of BDNF, ERK1/2, and P-ERK1/2 in the hippocampus and prefrontal cortex between the CON and CUS
Hippocampus Prefrontal cortex
CON CUS CON CUS
BDNF 0.001518±0.000572 0.000248±0.000278# 0.005214±0.001569 0.001734±0.001805# ERK1/2 0.004783±0.004454 0.019889±0.018923 0.001648±0.000889 0.001048±0.000817 P-ERK1/2 0.013495±0.005621 0.000689±0.000564# 0.001351±0.001353 0.000106±0.000262*
[image:5.612.91.524.550.618.2]Changes in neurochemical metabolism in a rat model of depression
that the CHO:Cr ratio in the left hippocampus of
depressed rats decreased significantly, which
was considered to be an essential factor in major pathophysiologic changes of depression. In the current study the CHO:Cr ratios of the left and right hippocampus, and the CHO:Cr ratio of
the left prefrontal cortex, were significantly
lo-wer than the CON group, suggesting that the regeneration function of the cell membrane was impaired in the hippocampus and the left prefrontal cortex of depressed rats.
GLU is the most important excitatory neuro- transmitter in the central nervous system and plays a critical role in the differentiation, migra-tion, growth, and survival of neurons. Glutamic acid can modulate the postsynaptic potentials of some neurons, such as dopaminergic neu-rons, which affects the physiologic functions of other neurotransmitters. The normal metabo-lism of glutamic acid depends on the normal function of neurons and neuroglial cells. The- refore, some researchers have suggested that a decrease in glutamic acid levels in the brain of patients with depression coincides with the morphologic changes in the hippocampus and cortex of depressed patients [13], which in- cludes changes in the number of neurons and neuroglial cells, thus indicating dysfunction of the glutamatergic system. Previous results ha-
ve revealed a significant decrease in glutamate
in the hippocampus and prefrontal cortex of CUMS animals [2]. In the current study, the GLU:Cr ratios in the left and right hippocampus,
and GLU:Cr ratio in the left prefrontal cortex
were reduced significantly compared with the
CON group, indicating that dysfunction of gluta-matergic neurons might be the main pathologic change accompanying depression.
As a second messenger, MI can balance the functions among various neurotransmitter
sys-tems, therefore having a great influence on
adjusting nerve signals and downstream cellu-lar and molecucellu-lar responses. In an analysis conducted by Yildiz et al. [14], the MI:Cr ratio of the left dorsolateral prefrontal cortex was
sig-nificantly higher than the control group, sug -gesting that there may be abnormal signal transduction in nerve cells and abnormal phos-pholipid metabolism in the cell membrane. The results of our study showed that the MI:Cr ratios in the hippocampus and left prefrontal cortex were increased in depressed rats,
con-firming that an imbalance of the second mes
-senger system has a role in the pathologic mechanism underlying depression.
[image:6.612.90.530.71.263.2]There is currently an increasing concern about the role of the mitogen activated protein kinase (MAPK)/ERK signaling pathway in the central nervous system. Due to the complex pathogen-esis of depression, further study of the ERK sig-naling pathway may contribute to a deeper understanding, thus providing targets for new diagnostic and therapeutic techniques for the treatment of depression.
Prior evidence has shown that the level of BDNF in the hippocampus and prefrontal cortex is
decreased significantly in patients with depres -sion [15], indicating that BDNF has an antide-pressant effect that is achieved via multiple pathways and action sites. ERK is the earliest known kinase in the MAPK family, and is divid-ed into ERK1 and ERK2, which are collectively known as ERK1/2. At the same time, ERK is a key molecule that transmits signals from the surface receptors to the nucleus and requires a cascade reaction of three enzymes in the MAPK signaling pathway to induce extracellular stimu-lation to cells to stimulate corresponding bio-logical effects [16]. In addition, ERK1/2 acti-vated by phosphorylation is translocated from the cytoplasm to the nucleus, acts on transcrip-tion factors, such as Ets-like-protein 1, activat-ing transcription factor, and nuclear transcrip-tion factor-JB, and promotes the transcriptranscrip-tion and expression of some genes [17, 18]. In addi-tion, Yuan et al. [19]studied the role of the ERK pathway in neuronal plasticity and elasticity in
patients with mental disorders. The findings
indicated that during autopsy, the protein levels of ERK1/2 in the frontal cortex of patients with bipolar disorders and schizophrenia declined considerably compared with the frontal lobes of healthy subjects without mental illness. In addition, Yu et al. [20] reported that the ERK and phosphatidylinositol 3-kinase (PI3K) sig-naling pathways were both mediated [modulat-ed?] in the hippocampus, whereas in the pre-frontal cortex, ERK signaling pathway was pri-marily mediated [modulated?] to assume a neurotrophic role in brain neurons. Therefore, activation of the two pathways has an impact on protecting cranial nerves. In contrast, inhibi-tion of the two pathways may produce or aggra-vate depression. In the current study the results showed that the levels of BDNF, ERK1/2, and p-ERK expression in the hippocampus and
pre-frontal cortex were decreased significantly
compared with the control group, suggesting that a depressed mood is associated with low expression of BDNF, ERK1/2, and p-ERK, and the BDNF-ERK signaling pathway is closely re- lated to depression.
The pathogenesis of depression is complex, involving multiple brain regions in which the hippocampus and frontal lobe can regulate changes in mood and behavior by various me- chanisms [21]. Accordingly, the hippocampus
and frontal lobe were the focus of the current study. The hippocampus is a high-level center of mental activities in animals, as well as a sus-ceptible site of stress injury, suggesting that the hippocampus has a strong relationship with the regulation of emotions. Based on autopsi- es of depressed patients, the hippocampus is atrophied [22]. In addition, Natalia et al. [23] suggested that the nerve regeneration ability of the hippocampus can be restored to normal via short-term stimulation in experimental animals; however, if rats received a long-term unpredict-able stimulus, nerve regeneration of the hippo-campus is damaged without any possibility of restoration. In addition, important hippocampal proteins are involved in the regulation of emo-tion through different signaling pathways. The frontal lobe accounts for approximately 40% of the cerebral cortex and is the executive center of brain activity. Structurally, the frontal lobe can be divided into four parts, among which the prefrontal cortex plays an important role as the emotional center.
In the current study MRS and IHC were used to study the bilateral hippocampus and bilateral prefrontal cortex of depressed rats. The chang-es in spectra were consistent with histologic changes, indicating that both the hippocampus and prefrontal cortex play important roles in the pathogenesis of depression. In addition, the MRS results showed that there was a
spe-cific difference in the allogenic metabolites of
the bilateral prefrontal cortex, which was con-sistent with the results of previous studies. Consequently, this study supports the view of an imbalance in hemispheres underlying the pathophysiologic process of depression. Acknowledgements
pre-Changes in neurochemical metabolism in a rat model of depression
pared the manuscript. Bin Wang reviewed and revised the manuscript.
Disclosure of conflict of interest
None.
Address correspondence to: Bin Wang, Binzhou Medical University, Main Campus, No. 346, Guanhai Road, Yantai 264003, Shandong, China. Tel: +86-535-6913002; Fax: +86-535-6913024; E-mail: bin-wangvip@sina.com
References
[1] Schulz D, Smith D, Yu M, Lee H and Henn FA. Selective breeding for helplessness in rats al-ters the metabolic profile of the hippocampus and frontal cortex: a 1H-MRS study at 9.4 T. Int J Neuropsychopharmacol 2013; 16: 199-212. [2] Hemanth Kumar BS, Mishra SK, Rana P, Singh
S and Khushu S. Neurodegenerative evidenc-es during early onset of deprevidenc-ession in CMS rats as detected by proton magnetic resonance spectroscopy at 7 T. Behav Brain Res 2012; 232: 53-59.
[3] Fernandes A and Li YW. Focused microwave ir-radiation-assisted immunohistochemistry to study effects of ketamine on phospho-ERK ex-pression in the mouse brain. Brain Res 2017; 1670: 86-95.
[4] Willner P, Towell A, Sampson D, Sophokleous S and Muscat R. Reduction of sucrose prefer-ence by chronic unpredictable mild stress, and its restoration by a tricyclic antidepressant. Psychopharmacology (Berl) 1987; 93: 358-364.
[5] Imamura K. Proton MR spectroscopy of the brain with a focus on chemical issues. Magn Reson Med Sci 2003; 2: 117-132.
[6] Brand A, Richter-Landsberg C and Leibfritz D. Multinuclear NMR studies on the energy me-tabolism of glial and neuronal cells. Dev Neu-rosci 1993; 15: 289-298.
[7] Mao N, Fang J, Xie H, Liu X, Jiang X, Wang G, Cui M, Wang B and Liu Q. Correlation between neurochemical metabolism and memory func-tion in adolescent patients with depression: a multi-voxel 1H magnetic resonance spectros-copy study. Psychiatry Clin Neurosci 2016; 70: 167-174.
[8] Bhagwagar Z, Wylezinska M, Jezzard P, Evans J, Boorman E, M Matthews P and J Cowen P. Low GABA concentrations in occipital cortex and anterior cingulate cortex in medication-free, recovered depressed patients. Int J Neu-ropsychopharmacol 2008; 11: 255-260. [9] Gonul AS, Kitis O, Ozan E, Akdeniz F, Eker C,
Eker OD and Vahip S. The effect of
antidepres-sant treatment on N-acetylaspartate levels of medial frontal cortex in drug-free depressed patients. Prog Neuropsychopharmacol Biol Psychiatry 2006; 30: 120-125.
[10] Xi G, Hui J, Zhang Z, Liu S, Zhang X, Teng G, Chan KC, Wu EX, Nie B, Shan B, Li L and Reyn-olds GP. Learning and memory alterations are associated with hippocampal N-acetylaspar-tate in a rat model of depression as measured by 1H-MRS. PLoS One 2011; 6: e28686. [11] Ende G, Brays DF, Walter S, Weber-Fahr W and
Henn FA. The hippocamus in patients treated with electroconvulsive therapy: a proton mag-netic resonance spectroscopic imaging study. Arch Gen Psychiatry 2000; 57: 937-943. [12] Hong ST, Choi CB, Park C, Moon HY, Hong KS,
Cheong C, Chae JH and Choe BY. Specific hip -pocampal choline decrease in an animal mod-el of depression. Br J Radiol 2009; 82: 549-553.
[13] Bremner JD, Narayan M, Anderson ER, Staib LH, Miller HL and Charney DS. Hippocampal volume reduction in major depression. Am J Psychiatry 2000; 157: 115-118.
[14] Yildiz-Yesiloglu A and Ankerst DP. Review of H-magnetic resonance spectroscopy findings in major depressive disorder: a meta analysis. Psychiatry Res 2006; 147: 1-25.
[15] Neumeister A, Wood S, Bonne O, Nugent AC, Luckenbaugh DA, Young T, Bain EE, Charney DS and Drevets WC. Reduced hippocampal volume in unmedicated, remitted patients with major depression versus control subjects. Biol Psychiatry 2005; 57: 935-937.
[16] Atay O and Skotheim JM. Spatial and temporal signal processing and decision making by MAPK pathways. J Cell Biol 2017; 216: 317-330.
[17] Li P, Gan Y, Wang H, Xu Y, Li S, Song L, Zhang C, Ou Y, Wang L and Zhou Q. Role of the ERK1/2 pathway in osmolarity effects on nucleus pulp-osus cell apoptosis in a disc perfusion culture. J Orthop Res 2017; 35: 86-92.
[18] Hooker E, Baldwin C, Roodman V, Batra A, Isa NN, Takano T and Lemay S. Binding and inhibi-tion of the ternary complex factor Elk-4 /Sap1 by the adapter protein Dok-4. Biochem J 2017; 474: 1509-1528.
[19] Yuan P, Zhou R, Wang Y, Li X, Li J, Chen G, Gui-tart X and Manji HK. Altered levels of extracel-lular signal-regulated kinase signaling proteins in postmortem frontal cortex of individuals with mood disorders and schizophrenia. J Af-fect Disord 2010; 124: 164-169.
[21] Wu HF, Zhu CH and Guo JY. Effect of ginsen-oside Rg1 on behaviors and hippocampal ami-no acids in depressive-like rats. Zhongguo Zhong Yao Za Zhi 2012; 37: 3117-3121. [22] McEwen BS. Stress and hippocampal
plastici-ty. Annu Rev Neurosci 1999; 22: 105-22.