Evaluation by Association:
A Systematic Study of Quantitative Word Association Evaluation
Ivan Vuli´c1, Douwe Kiela2, andAnna Korhonen1 1Language Technology Lab, DTAL, University of Cambridge
2Facebook AI Research
{iv250|alk23}@cam.ac.uk [email protected]
Abstract
Recent work on evaluating representation learning architectures in NLP has estab-lished a need for evaluation protocols based on subconscious cognitive measures rather than manually tailored intrinsic similarity and relatedness tasks. In this work, we pro-pose a novel evaluation framework that en-ables large-scale evaluation of such archi-tectures in the free word association (WA) task, which is firmly grounded in cognitive theories of human semantic representation. This evaluation is facilitated by the exis-tence of large manually constructed reposi-tories of word association data. In this pa-per, we (1) present a detailed analysis of the new quantitative WA evaluation protocol, (2) suggest new evaluation metrics for the WA task inspired by its direct analogy with information retrieval problems, (3) evaluate various state-of-the-art representation mod-els on this task, and (4) discuss the relation-ship between WA and prior evaluations of semantic representation with well-known similarity and relatedness evaluation sets. We have made the WA evaluation toolkit publicly available.
1 Introduction
The quality of word representations in semantic models is often measured using intrinsic evalua-tions that capture particular types of relaevalua-tionships (typically semantic similarity and relatedness) be-tween word pairs (Finkelstein et al., 2002; Hill et al., 2015; Schnabel et al., 2015; Tsvetkov et al., 2015, inter alia).
Whereas the notions of semanticsimilarityand
relatednessconstitute key concepts in such evalua-tions, they are in fact vaguely defined (Batchkarov
et al., 2016; Ettinger and Linzen, 2016). The con-struction of ground truth evaluation sets that reflect these relations, such as SimLex-999 (Hill et al., 2015), SimVerb-3500 (Gerz et al., 2016), MEN (Bruni et al., 2014) or Rare Words (Luong et al., 2013), relies on manually constructed guidelines that trigger subjective human interpretation of the task at hand. This in turn introduces inter-annotator variability (Batchkarov et al., 2016) and does not account for the fact that human similarity judge-ments are asymmetric by nature (Tversky, 1977).
What is more, given that humans perform lin-guistic comparisons between concepts on a sub-conscious level (Kutas and Federmeier, 2011), it is at least debatable whether current similar-ity/relatedness evaluation sets fully capture the im-plicit relational structure underlying human lan-guage representation and understanding.
As evidenced by recent workshops on evalua-tion of semantic representaevalua-tions1, the community appears to recognise that current evaluation meth-ods are inadequate. To fill in this gap, recent work has proposed using subconscious cognitive mea-sures of semantic connection instead, as a proxy for measuring the ability of statistical models to tackle various problems in human language un-derstanding (Ettinger and Linzen, 2016; Søgaard, 2016; Mandera et al., 2017).
Motivated by these insights, this work proposes an evaluation framework based on the word associ-ation (WA) task, firmly rooted in and described by the psychology literature, e.g., Nelson et al. (2000) and Griffiths et al. (2007)2. Word associ-ations, provided as simple(cue, response)concept pairs, are naturally asymmetric: they tend to be given as a repository of ranked lists of concepts
col-1E.g. RepEval, https://sites.google.com/site/repevalacl16/ 2The WA task is a free-association task, in which partici-pants are asked to produce the first word that came into their head inresponseto acueorqueryword.
lected as responses (i.e., assocations) given a target cue/query concept. The ranking of the response list is based on the WA strength between the cue and each generated response. WAs are directly tied to language use and the memory systems that sup-port online linguistic processing (Till et al., 1988; Nelson et al., 1998).
We build our WA evaluation framework around a large repository of the University of South Florida (USF) association norms (Nelson et al., 2000; Nel-son et al., 2004). After post-processing, the repos-itory contains ~5K queries, and ~70,000(cue, re-sponse)pairs, making it one of the largest seman-tic evaluation databases available (by contrast, the largest word pair scoring data sets in NLP, SimVerb and MEN, contain 3,500 and 3,000 word pairs re-spectively). This new resource enables comprehen-sive quantitative studies of WA and may be used to guide the future development of representation learning architectures.
While parts of the USF data set have been used for evaluation in NLP before (Michelbacher et al., 2007; Silberer and Lapata, 2012; Kiela et al., 2014; Hill and Korhonen, 2014, inter alia), we conduct the first full study regarding the evaluation on the quantitative WA task. We compare a wide variety of different semantic representation models, discuss various evaluation metrics and analyse the links be-tween word association and semantic similarity and relatedness. In summary, the main contributions of this paper are as follows:3
(C1)We present an end-to-end evaluation frame-work for the WA task, and provide new evaluation metrics and detailed guidelines for evaluating se-mantic models on the WA task.
(C2)We conduct a systematic study and compari-son of current state-of-the-art representation learn-ing architectures on the WA task.
(C3) We present a systematic quantitative analy-sis of the connections between the models’ per-formance on the subconscious WA task and their performance on benchmarking similarity and relat-edness evaluation sets.
2 Motivation: Association and USF
Implicit Cognitive Measures: Means of Seman-tic Evaluation? Several studies have shown clear correspondence between implicit cognitive 3All evaluation scripts and detailed evaluation guidelines are freely available at:
https://github.com/cambridgeltl/wa-eval/
measures (most notablysemantic priming) and se-mantic relations encountered in vector space mod-els (VSMs) (McDonald and Brew, 2004; Jones et al., 2006; Pad´o and Lapata, 2007; Herda˘gdelen et al., 2009), suggesting that some of the implicit relation structure in the human brain is already re-flected in current statistical models of meaning.
These findings encouraged Ettinger and Linzen (2016) to propose a preliminary evaluation frame-work based on semantic priming experiments (Meyer and Schvaneveldt, 1971).4 They demon-strate the feasibility of such an evaluation using a subconscious language processing task. They use the online database of the Semantic Priming Project (SPP), which compiles priming data for over 6,000 word pairs.
Here, we go one step further and demonstrate that another subconscious language processing task, with much more available data, can also be used to evaluate representations. We construct an evaluation framework based on the USF free word association (WA) norms quantifying the strength of association between cue and response concepts for more than 70,000 concept pairs.
Word Association WA has been a long-standing research topic in cognitive psychology, as evi-denced by the following statement (Deese, 1966):
Are there any more fascinating data in psychology than tables of association? (Deese, 1966)
Word association still remains one of the funda-mental questions in cognitive psychology, as em-phasised by e.g. Griffiths et al. (2007):
Association has been part of the theoretical ar-mory of cognitive psychologists since Thomas Hobbes used the notion to account for the struc-ture of our “trayne of thoughts” in 1651.
These insights illustrate how WA can provide a useful benchmark for evaluating models of human semantic representation. WA norms are commonly used in constructing memory experiments (Dennis and Humphreys, 2001; Steyvers and Malmberg, 2003), and statistics derived from them have been shown to be important in predicting cued recall
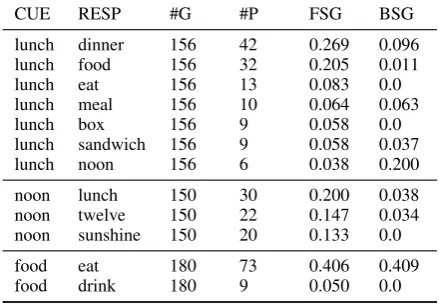
CUE RESP #G #P FSG BSG lunch dinner 156 42 0.269 0.096
lunch food 156 32 0.205 0.011
lunch eat 156 13 0.083 0.0
lunch meal 156 10 0.064 0.063
lunch box 156 9 0.058 0.0
lunch sandwich 156 9 0.058 0.037
lunch noon 156 6 0.038 0.200
noon lunch 150 30 0.200 0.038
noon twelve 150 22 0.147 0.034
noon sunshine 150 20 0.133 0.0
food eat 180 73 0.406 0.409
[image:3.595.71.291.64.216.2]food drink 180 9 0.050 0.0
Table 1: Example(cue, response)pairs of free word association from the USF data set. #G stands for the number of participants serving in the group norming the word, while #P denotes the number participants producing a particular response.
and recognition (Nelson et al., 1998), and false memories (Roediger et al., 2001).5
WA Evaluation Set: USF The USF norms data set (hereafterUSF) is the largest database of free word association collected for English (Nelson et al., 2004). It was generated by presenting human subjects with one of5,000cue concepts and ask-ing them to write the first word comask-ing to their mind that is associated with that concept. Each cue concept was normed by at least 100 participants, resulting in a set of associates (orresponses) for each cue, for a total of ∼72,000 (cue, response)
pairs. A sample of the USF data is presented in Tab. 1. The data are accessible online.6
For each such pair, the proportion of participants that produced the responsewrwhen presented with cue wordwccan be used as a proxy for the strength of association between the two words (FSG in Tab. 1). BSG denotes the backward association strength, when the roles of a cue and a response are reversed, shows that the WA relation is inherently asymmetrical.
5From another viewpoint, the WA evaluation aims to an-swer a different question than a typical intrinsic evaluation on data sets such as SimLex-999, MEN, WordSim-353, or SimVerb-3500. The goal of the latter is to assess the quality of learned text representations as a proxy towards downstream NLP tasks. The goal of the former is to assess the capability of representation learning and NLP architectures to help in ad-vancing our understanding and modeling of human cognitive processes (occurring on a sub-conscious level), while at the same time it could still be used as a proxy evaluation in NLP.
6http://w3.usf.edu/FreeAssociation/
3 Evaluation Protocol
Terminology Wc = {wc
1, . . . , wci, . . . , w|Wc C|}
denotes a set of|Wc|cueornormedwords (more generally, concepts) in the evaluation set. For each cue word wc
i, the data set contains aranked list of concepts orresponses Ri sorted according to the strength of forward association, from cue to response (i.e., the FSG field in Tab. 1). The list
Ri contains entries of the format wr,j : fsgi,j, wherewr,j is thejth most associated concept in the ranked list, and fsgi,j is the accompanying strength of forward association between cue wc i and responsewr,j. LetRgi refer to the ground truth ranked list forwc
i, which contains only responses wherefsgi,j > 0in the USF data, andRs
i to the ranked list retrieved by an automatic system.
The vocabulary or search space from which re-sponses for all cues are drawn is labeledVr. Note thatVrmay also contain words fromWcand that
Vrmay contain words that do not occur in any of the ground truth listsRgi.
Why Evaluate on Word Association? A stan-dard evaluation protocol with word pair scoring evaluation sets such as SimLex-999 or MEN is to compute Spearman’s ρ correlations between the ranking obtained by an automatic system and the ground truth ranking. This protocol, however, is not directly applicable to the USF test data. First, the evaluated relation of WA isasymmetric, and the pairs(X, Y) and(Y, X)may differ dramatically in their WA scores (see the difference in FSG and BSG values from Tab. 1). Second, instead of one global list of pairs, the data comprises a series of ranked lists conditioned on the cue/normed word
wc(see Tab. 1 again). Finally, unlike with SimLex-999 or MEN scores where it is difficult to inter-pret “what a similarity/relatedness of 7.69 exactly means” (Batchkarov et al., 2016; Avraham and Goldberg, 2016), the USF FSG scores have a direct meaningful interpretation (i.e.,F SG= #P/#G). To fully capture all aspects of the ground truth USF data set, an evaluation protocol should ideally be based not only on response rankings, but also on the actual scores, i.e., the association strength.
2016, inter alia). Sect. 3.2 draws inspiration from research on evaluation in information retrieval (IR). We show that the problem of evaluating USF asso-ciation lists may be naturally framed as an ad-hoc IR task (Manning et al., 2008). This enables the application of standard IR evaluation methodology.
3.1 Rank Correlation Evaluation
Averaged Standard Spearman’s Correlation
The first protocol, labeled ρ-std, first computes the standard Spearman’sρcorrelation betweenRgi
andRs
i. The system listRsi is pruned so that it con-tains only those items that also occur inRgi. The two lists are then correlated to obtain the scoreρi for cuewc
i.
Following that, the correlation scores are aver-aged. First, we apply the Fisherz-transformation (Fisher, 1915) and then average over the trans-formed scores:
zi= 12ln
1 +ρi
1−ρi
= arctanh(ρi) (1)
zavg=
|Wc|
X
i=1
zi (2)
The final output score is obtained by applying the inversez-transformation onzavg:
ρavg= tanh(zavg) (3)
Averaged Weighted Spearman’s Correlation
The previous protocol treats all ranks equally, de-spite the fact that the system should be rewarded more for getting the strongest responses correct (and penalised when failing to do so). Therefore, we also experiment with weighted rank correlation measures, which weigh the distance between two ranks, and assign more importance to higher ranks (i.e., in our setting, to stronger associates).
Several weighted correlation metrics have been proposed (Blest, 2000; Pinto da Costa and Soares, 2005; Dancelli et al., 2013; Pinto da Costa, 2015). We show results with the weighted Spearman’s correlation (further labelled ρ-w) from Pinto da Costa (2015).7 Let us de-note Q1 = [Q1,1, Q1,2, . . . , Q1,n] and Q1 =
[Q2,1, Q2,2, . . . , Q2,n] two vectors of ranks ob-tained on a sample of sizen. The weighted rank correlationρbetween the vectors is computed as:
7We also experimented with other weighted variants, but detected similar trends in reported model rankings.
1−
6 n
X
i=1
(Q1,i−Q2,i)((n−Q1,i+ 1) + (n−Q2,i+ 1))
n4+n3−n2−n
(4) We refer the interested reader to the relevant lit-erature (Pinto da Costa, 2015) for further details, theoretical implications and property proofs related to Eq. (4).ρiscores for all cue wordsWcare then obtained using Eq. (4), and the averaged scoreρavg is computed as before, see Eq. (1)-Eq. (3).
While the two metrics are intuitive and capture the ability of models to correctly rank (a subset of) associates/responses, note that they have deficien-cies. They only evaluate the rankings of words oc-curring inRgi, which effectively reduces the search spaceVr to the small subset{w1, . . . , w
|Rgi|} ⊂
Vr. This effectively means that the final score simply ignores incorrect responses that are ranked highly by a system but that do not occur inRgi. It also does not take into account the actual strength of association.
3.2 IR-Inspired Evaluation
Intuition Another set of evaluation metrics is in-spired by the resemblance of the USF data structure to the typical output of ad-hoc IR systems (Man-ning et al., 2008; Pound et al., 2010). That is, each cue wordwccan be thought of as an inputquery issued against sometarget concept collectionVr, where the goal of ourassociation retrieval system
is to rank items from the target collection according to theirrelevance(i.e., their association strength) to the issued query. The output of the system is the ranked list Rs
i of length|Vr|, with ground truth relevance assessments provided inRgi.
MRR and MAP The first two metrics assume non-weighted or binary relevance: the retrieved re-sponse is either relevant to the issued cue (labeled 1) or it is non-relevant (0). We assume that all re-sponses found in the ground truth listsRgi where
fsgi,j > t are relevant responses, where t is a threshold.8 We label this reduced set of relevant responsesRRgi.
2009). The reciprocal rank of a query response is the multiplicative inverse of the rank of the first rel-evant answer, and the final score is then averaged over all|Wc|queries/cues. More formally:
MRR(Wc) = 1
|Wc|
|Wc|
X
i=1
1
ranki (5)
whererankiis the rank position of the first relevant response (i.e., the first response found in the set
RRgi) for the cue wordwc i.
Since MRR cannot assess multiple correct an-swers and their ranking in the retrieved list, an al-ternative metric is Mean Average Precision (MAP):
MAP(Wc) = 1
|Wc|
|Wc|
X
i=1
AP(wc
i) (6)
AP(wc i) =
PN
k=1Pk·irelk
|RRg
i| (7)
Here, AP(wc
i) denotes Average Precision for query/cuewc
i,N ≤ |Vr|denotes the number of responses retrieved by the system.Pkis the preci-sion at cut-offkin the list, andirelkis an indica-tor function which ’turns on’ only if the response at rankkis the relevant response (i.e., present in
RRgi). The average is computed over all relevant responses, and the non-retrieved relevant responses fromVrget a precision score of 0.N <<|Vr|is typically used (e.g., standard values areN = 100 orN = 1000) to reduce the execution time of the evaluation procedure, since it is expected that a good retrieval system should obtain a majority of relevant responses in the firstN responses.
Compared to measures from Sect. 3.1, MRR and MAP are better estimators of the model’s ability to capture word association, as they operate over the entire search spaceVrfor each cue word. This effectively means that systems get rewarded if they are able to consistently rank relevant responses higher than non-relevant responses. However, these metrics still rely on binary non-weighted relevance judgements, and are therefore unable to reward models that rank highly relevant responses (i.e., strongly associated responses, see Tab. 1) higher than weakly relevant responses.
NDCG@k In other words, the most expressive evaluation metric should be able to distinguish that cue-response pairs such as(lunch, dinner)and
(lunch, food)should be ranked higher than weakly associated pairs such as (lunch, box) or (lunch,
sandwich). In addition, the metric should still re-ward models that rank relevant responses higher than non-relevant ones.
An IR metric which takes all these aspects into account is Discounted Cumulative Gain (DCG) (J¨arvelin and Kek¨al¨ainen, 2002). DCG operates with weighted relevance values: in the USF sce-nario, these are forward association strengths, i.e., scoresfsgi,j. The main idea behind using DCG is that highly relevant responses appearing lower in a ranked list should be penalised. The penalty is implemented by reducing the weighted relevance value logarithmically proportional to the position of the particular response. We opt for a more re-cent variant of DCG which puts more emphasis on retrieving relevant responses (Burges et al., 2005). DCG@k, the DCG score accumulated at a particu-lar rank positionkis computed as follows:
DCG@k=Xk
i=1
2wreli−1
log2(i+ 1) (8)
wreli is the graded relevance of the response at rankigiven by the ground truth data, i.e.,fsgi,jif the cue-response pair occurs inRgi, or 0 otherwise.
To make results comparable across different queries, a normalised variant of DCG is typically used. First, all relevant responses are sorted by their graded relevance value, producing the maximum possible DCG at each position k. The score of the ideal ranking at rank k is called Ideal DCG (IDCG@k). NDCG@k for a single query is then:
NDCG@k=IDCGDCG@@kk (9)
Finally, the mean NDCG@k is produced for the entire collectionWcby averaging over all single NDCG@k values. In all experiments we rely on a standard choice fork: NDCG@100, while similar trends are observed with NDCG@10.
4 Experimental Setup and Models
LDA-Based Approach First, we evaluate an ap-proach based on latent topic modeling, rooted in the psychology literature (Steyvers et al., 2004; Grif-fiths et al., 2007; Steyvers and GrifGrif-fiths, 2007).9 The following quantitative model of word associa-tion has been proposed (Griffiths et al., 2007):
P(wr|wc) =XM
i=1
P(wr|to
i)P(toi|wc) (10)
where wc is a cue word, wr ∈ Vr any concept from the search space, andtoiis theithlatent topic from the set ofM topics induced from the corpus data (using LDA). We label this modelLDA-assoc. The probability scoresP(wr|toi)select words that are highly descriptive for each particular topic.
P(toi|wc)scores are computed as in prior work, by assuming topic independence and applying Bayes’ rule on the LDA output per-topic word distributions
P(·|toi)(Steyvers and Griffiths, 2007; Vuli´c and Moens, 2013).10We train LDA with 1,000 topics using suggested parameters (Griffiths et al., 2007).
Count-Based Models We evaluate the best per-forming reduced count-based model from (Baroni et al., 2014). We label this model count-ppmi-500d.11 For a more detailed description of the model’s training data and setup we refer the reader to the original work and supplementary material.
Vector Space Models We also compare the performance of prominent representation mod-els on the WA USF task. We include: (1) un-supervised models that learn from distributional information in text, including Glove (Penning-ton et al., 2014) with d = 50 and d = 300 dimensions (glove-6B-50d and glove-6B-300d), the skip-gram negative-sampling (SGNS) 300-dimensional vectors (Mikolov et al., 2013) with var-ious contexts (bow= bag-of-words;deps= depen-dency contexts) as in (Levy and Goldberg, 2014) and (Schwartz et al., 2015) (sgns-pw-bow-w2,
sgns-pw-bow-w5, sgns-pw-deps, sgns-8b-bow-w2), and the symmetric-pattern based vectors by Schwartz et al. (2015) (sympat-500d); (2) Models that rely on linguistic hand-crafted resources or cu-rated knowledge bases. Here, we use vectors fine-tuned to a paraphrase database (paragram-25d, 10The generative model closely resembles the actual pro-cess in the human brain (Griffiths et al., 2007) - when we generate responses, we first tend to associate that word with a related semantic/cognitive concept, i.e., a latent topic (the factorP(toi|wc)), and then, after establishing the concept, we output a list of words that we consider the most promi-nent/descriptive for that concept (words with high scores in the factorP(wr|to
i)).
11We have also experimented with simple count-based asymmetric association measures proposed by Michelbacher et al. (2007), estimated using the same corpus as the count-ppmi-500d model. We do not report the results with these measures, as they show a very poor performance when com-pared to all other models in our comparison.
paragram-300d, (Wieting et al., 2015)) further re-fined using linguistic constraints ( paragram+cf-300d, (Mrkˇsi´c et al., 2016)); (3) Multilingual em-bedding models from Luong et al. (2015) ( biskip-256d) and Faruqui and Dyer (2014) (bicca-512d). More detailed descriptions of all VSM models are available in the listed papers and supplementary material attached to this work.
USF Data Processing and Parameters Only USF pairs where both words are single word ex-pressions were retained, and the rest was discarded. This yields 4,992 single word queries in total. The total number of finally retained USF pairs is ≈
70,000. Note that this evaluation set is by an or-der of magnitude larger than current benchmarking word pair scoring datasets such as MEN (3000 word pairs in total), SimVerb (3500), SimLex (999) and Rare Words (2034), and thus allows for a truly comprehensive evaluation of quantitative WA mod-els. Only responses generated by at least 3 human subjects in each list of responses are taken as rele-vant in all experiments (see Foot. 7 in Sect. 3.2), all other(cue, response)pairs and pairs not present in the USF data are considered non-relevant.12 5 Results and Discussion
Exp. I: Making the Evaluation Tractable
Computational complexity is not an issue for stan-dard semantic benchmarks such as SimLex-999 or MEN: these data sets require only Ngt sim-ilarity computations in total, where Ngt is the number of word pairs in each benchmark (999 or 3000). However, complexity plays a major role in the USF evaluation: the system has to com-pute|Wc| · |Vr|similarity scores, where|Wc| ≈ 5,000, and |Vr| is large for large vocabularies (typically covering > 100K words). In addition, each list of|Vr|has to be sorted according to the WA strength: this means that the complexity is
O(|Wc| ·(|Vr|+|Vr|log|Vr|)).
Since this is prohibitively expensive, our so-lution is to restrict the search space Vr only to words (both cues and responses) occurring in USF:
Vr= 100K Vr=USF
Model MRR MAP NDCG MRR MAP NDCG
glove-6B-50d[4988] 0.233 (4) 0.072 (3) 0.190 (3) 0.318 (5) 0.105 (5) 0.249 (5) glove-6B-300d[4988] 0.303 (1) 0.112 (1) 0.280 (1) 0.473 (1) 0.183 (1) 0.380 (1) sgns-pw-bow-w2[4970] 0.177 (6) 0.047 (7) 0.129 (6) 0.315 (6) 0.098 (6) 0.226 (6) sgns-pw-bow-w5[4970] 0.235 (3) 0.066 (5) 0.176 (5) 0.372 (3) 0.122 (4) 0.278 (4) sgns-pw-deps[4953] 0.164 (8) 0.041 (8) 0.107 (8) 0.281 (8) 0.081 (8) 0.187 (8) sgns-8b-bow-w2[4982] 0.239 (2) 0.078 (2) 0.218 (2) 0.452 (2) 0.169 (2) 0.358 (2) paragram-25d[4902] 0.174 (7) 0.048 (6) 0.121 (7) 0.309 (7) 0.092 (7) 0.198 (7) paragram+cf-300d[4971] 0.221 (5) 0.067 (4) 0.179 (4) 0.371 (4) 0.130 (3) 0.284 (3) Table 2: The effects of reducing the search spaceVrto speed up the evaluation process. The numbers in parentheses are relative rankings of each model (1-8) according to the particular evaluation metric. The numbers in square brackets report the coverage of each model (the total number of USF queries is 4992).
Model ρ-std ρ-w MRR MAP NDCG
LDA-assoc 0.230 0.221 0.153 0.048 0.128 count-ppmi-500d 0.255 0.249 0.294 0.094 0.226 glove-6B-50d 0.280 0.277 0.318 0.105 0.249 glove-6B-300d 0.337 0.339 0.473 0.183 0.380
sgns-pw-bow-w2 0.263 0.259 0.315 0.098 0.226 sgns-pw-bow-w5 0.283 0.280 0.372 0.122 0.278 sgns-pw-deps 0.240 0.234 0.281 0.081 0.187 sgns-8b-bow-w2 0.322 0.324 0.452 0.169 0.358 sympat-500d 0.194 0.189 0.221 0.069 0.180 paragram-25d 0.222 0.217 0.309 0.092 0.198 paragram-300d 0.302 0.298 0.388 0.138 0.300 paragram+cf-300d 0.265 0.268 0.372 0.067 0.179 biskip-256d 0.255 0.253 0.283 0.091 0.212 bicca-512d 0.311 0.310 0.371 0.132 0.303
Table 3: Results on the USF WA task using differ-ent evaluation metrics proposed in Sect. 3.Vr =
USF for all models. The best results per column are in bold, second best in italic.
therefore, their results are directly comparable as the data coverage bias should be largely mitigated.
To fully support this choice, we perform a simple experiment using a subset of models from Sect. 4. In the first evaluation,Vr contains the most fre-quent100Kwords for all models, where frequency was computed on their respective training data. In the second evaluation,Vr contains only the USF vocabulary words. The results with IR-style metrics are shown in Tab. 2, and similar trends are observed with Spearman’sρcorrelations.
The results support several conclusions. (i) Cov-erage over cue words is very high for all models (the model with the lowest coverage from Tab. 2 has a coverage of98.2%). This, along with the same search space (the USF vocabulary) indicates a fair comparison of different models. (ii) Different IR metrics produce consistent model rankings, with a slight variation in the middle of the rankings. Inter-estingly, the best scoring model is Glove, a model which uses document-level co-occurrence, which steers it towards learning topical similarity. On the
other hand, the worst performing model relies on dependency-based contexts which better capture functional similarity (Levy and Goldberg, 2014) and outperform other context choices in word sim-ilarity tasks on SimLex and SimVerb (Melamud et al., 2016; Gerz et al., 2016). (iii) Most impor-tantly, the reduction ofVragain yields consistent rankings with all metrics, which are also fairly con-sistent with the rankings obtained in the ten times larger100Ksearch space. Therefore, in all further experiments we use the USF vocabulary as our search space.
Exp. II: Results on USF WA Next, we evaluate all models from Sect. 3 on the WA task. The results with different metrics are summarised in Tab. 3. The results suggest that all proposed evaluation metrics indeed reflect the ability of different models to capture WA. We observe strong correlations of the models’ rankings with all five metrics (Tab. 4).
ρ-w is a slightly more conservative metric thanρ -std on average, but it does not affect model rankings at all (see also Tab. 4).
Further, the LDA-based WA model (Griffiths et al., 2007) is largely outperformed by VSM-based approaches. As expected, similar VSMs with more dimensions are more expressive and score higher (e.g., note the scores withgloveandparagram mod-els). Additionally, models trained on larger corpora are also able to improve the overall results (e.g., note the scores withsgnstrained on the Polyglot Wikipedia (PW, 2B tokens) vs. the 8Bword2vec corpus). Theparagrammodels specialised for simi-larity tasks are unable to match unsupervised VSMs that train on running text (e.g.,paragram+cf-300d
obtains a SimLex score of 0.74 compared to 0.46 withsgns-8b-bow-w2).
0.2 0.25 0.3 0.35 0.4 0.45
1 2 5 10 15 20 25 30
Window size
SimLex-999 MEN USF (ρ)
(a) Spearman’sρcorrelations
0.05 0.1 0.15 0.2 0.25 0.3 0.35 0.4
1 2 5 10 15 20 25 30
Window size
USF (MRR) USF (MAP) USF (NDCG@100)
[image:8.595.79.517.61.223.2](b) Other USF evaluation metrics
Figure 1: Influence of the window size on the ability of vector space models to capture Similarity (evaluated on SimLex-999), Relatedness (MEN), and Association (USF) (a) Spearman’sρ-std correlations on all three data sets; (b) Behaviour of other evaluation metrics used in the USF evaluation. All tested models are SGNS,d= 300, and the only varied hyper-parameter is the window size.
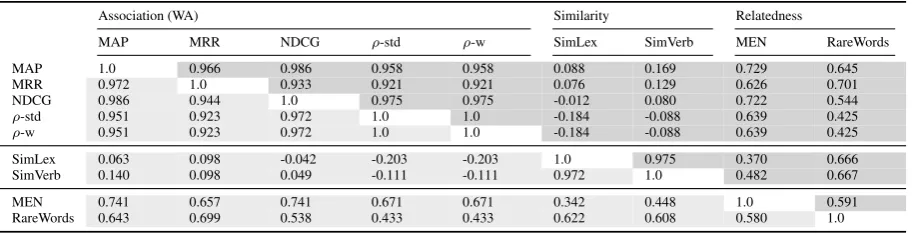
Association (WA) Similarity Relatedness
MAP MRR NDCG ρ-std ρ-w SimLex SimVerb MEN RareWords
MAP 1.0 0.966 0.986 0.958 0.958 0.088 0.169 0.729 0.645
MRR 0.972 1.0 0.933 0.921 0.921 0.076 0.129 0.626 0.701
NDCG 0.986 0.944 1.0 0.975 0.975 -0.012 0.080 0.722 0.544
ρ-std 0.951 0.923 0.972 1.0 1.0 -0.184 -0.088 0.639 0.425
ρ-w 0.951 0.923 0.972 1.0 1.0 -0.184 -0.088 0.639 0.425
SimLex 0.063 0.098 -0.042 -0.203 -0.203 1.0 0.975 0.370 0.666
SimVerb 0.140 0.098 0.049 -0.111 -0.111 0.972 1.0 0.482 0.667
MEN 0.741 0.657 0.741 0.671 0.671 0.342 0.448 1.0 0.591
RareWords 0.643 0.699 0.538 0.433 0.433 0.622 0.608 0.580 1.0
Table 4: Spearman’sρcorrelations between different evaluation protocols for vector space models divided into (a)Association, (b)Similarity, and (c)Relatedness. The correlation scores are based on the rankings of all the evaluated models (see Sect. 4.1) in each experiment. The lower-left part of the table (below the main diagonal, in lighter gray) reports standard Spearman’sρ-std correlations between different model rankings, whileρ-w is reported in the upper-right part (in darker gray). We report model rankings based on the 5 different metrics introduced for the WA USF evaluation. Model rankings for Similarity and Relatedness experiments are according to theρ-std correlation on the respective ground truth data sets.
best performing monolingual models: however, we plan to further analyse the influence of bilingual information in the WA task in future work.
Finally, a comparison of sgns-pw-* models (where the only varied parameter is the context used in training) reveals that (i) larger windows im-prove WA scores (we test this phenomenon further in Exp. III), (ii)sgns-pw-deps, which captures func-tional similarity through dependency-based con-texts, yields lower WA scores, while it improves on SimLex-999 compared to the other two mod-els. This insight leads us to further investigate this phenomenon in Exp. IV.
Exp. III: Window Size In the next experiment, we analysed the effect of the window size on
[image:8.595.72.529.307.424.2]win-dows (leading to topical similarity) lead to better WA estimates. This also provides the first hint that WA and semantic similarity capture two completely distinct semantic phenomena.
Exp. IV: WA vs. Similarity vs. Relatedness We delve deeper into this conjecture by computing cor-relations between model rankings on the WA task and two prominent similarity and relatedness data sets. The results from Tab. 4 indicate the following. First, semantic relatedness and similarity are cor-related although they clearly refer to two distinct semantic phenomena as emphasised in prior work (Hill et al., 2015). The correlations between differ-ent metrics proposed for the WA task are very high (e.g., the lowest correlation score among any of the two isρ= 0.921). Second, WA and similarity capture very distinct relations (this is evident from low, even negativeρcorrelation scores). Third, WA and relatedness are strongly correlated,14but the correlation is not as high as expected, given that the two are often considered equivalent, e.g., (Kiela et al., 2015). Future work should investigate whether the difference originates from inadequate evalua-tion data and protocols (see Fig. 1(a)-1(b) again), or whether the difference is fundamental.
6 Conclusion and Future Work
We have proposed and released a new end-to-end evaluation framework for the task of free word as-sociation (WA). We have also provided new evalu-ation metrics inspired by research in IR, and guide-lines for evaluating semantic representation models on the quantitative WA task.
Besides serving as a gold standard in NLP, the comprehensive WA evaluation resource and accom-panying evaluation protocol should enable the de-velopment of data-driven automatic systems that can capture the notion of word association, and further analysis on how humans perceive (types of) semantic relatedness and similarity (Spence and Owens, 1990; Maki and Buchanan, 2008; De Deyne et al., 2013). These systems, as discussed in this paper, may additionally facilitate research in cognitive psychology pertaining to human semantic representation and memory.
14Although it comes as slightly counter-intuitive, research in statistics has shown that transitivity between correlation coefficients does not hold in general (Langford et al., 2001; Castro Sotos et al., 2009). Therefore, the observed behaviour is possible: Relatedness indeed correlates both with Association and with Similarity, while at the same time we do not observe any correlation between Association and Similarity.
In future work, we plan to test the portability of the evaluation protocol and apply it to other repositories of word association data in English (De Deyne et al., 2016), as well as in other lan-guages, using existing WA tables in, e.g., German (Schulte im Walde et al., 2008), Dutch (De Deyne and Storms, 2008; Brysbaert et al., 2014), Italian (Guida and Lenci, 2007), Japanese (Joyce, 2005), or Cantonese (Kwong, 2013).15
In another line of future work, we will experi-ment with other “cognitively plausible” evaluation data such as N400 (Kutas and Federmeier, 2011; Ettinger et al., 2016), and will analyse the similar-ities and differences between WA and other such “cognitive” evaluation protocols, as the one relying on semantic priming (SPP) (Hutchison et al., 2013; Ettinger and Linzen, 2016).
All evaluation scripts and detailed guidelines related to this work are freely available at:
github.com/cambridgeltl/wa-eval/
Acknowledgments
This work is supported by ERC Consolidator Grant LEXICAL (no 648909). The authors are grateful to the anonymous reviewers for their helpful com-ments and suggestions.
References
Rami Al-Rfou, Bryan Perozzi, and Steven Skiena. 2013. Polyglot: Distributed word representations for multilingual NLP. InCoNLL, pages 183–192.
Oded Avraham and Yoav Goldberg. 2016. Improving reliability of word similarity evaluation by redesign-ing annotation task and performance measure. In
REPEVAL, pages 106–110.
Marco Baroni, Georgiana Dinu, and Germ´an
Kruszewski. 2014. Don’t count, predict! A
systematic comparison of context-counting vs. context-predicting semantic vectors. InACL, pages 238–247.
Miroslav Batchkarov, Thomas Kober, Jeremy Reffin, Julie Weeds, and David Weir. 2016. A critique of word similarity as a method for evaluating distribu-tional semantic models. InREPEVAL, pages 7–12.
David C. Blest. 2000. Theory & methods: Rank cor-relation - an alternative measure. Australian & New Zealand Journal of Statistics, 42(1):101–111.
Elia Bruni, Nam-Khanh Tran, and Marco Baroni. 2014. Multimodal distributional semantics. Journal of Ar-tificial Intelligence Research, 49:1–47.
Marc Brysbaert, Micha¨el Stevens, Simon De Deyne, Wouter Voorspoels, and Gert Storms. 2014. Norms of age of acquisition and concreteness for 30,000 Dutch words. Acta psychologica, 150:80–84.
Christopher J. C. Burges, Tal Shaked, Erin Renshaw, Ari Lazier, Matt Deeds, Nicole Hamilton, and Gre-gory N. Hullender. 2005. Learning to rank using gradient descent. InICML, pages 89–96.
Ana Elisa Castro Sotos, Stijn Vanhoof, Wim Van Den Noortgate, and Patrick Onghena. 2009. The transitivity misconception of Pearsons correlation coefficient. Statistics Education Research Journal, 8(2):33–55.
Nick Craswell. 2009. Mean reciprocal rank. In Ency-clopedia of Database Systems, pages 1703–1703.
Livia Dancelli, Marica Manisera, and Marika Vezzoli. 2013. On two classes of weighted rank correlation measures deriving from the Spearman’sρ. Statisti-cal Models for Data Analysis, pages 107–114. Dmitry Davidov and Ari Rappoport. 2006. Efficient
unsupervised discovery of word categories using symmetric patterns and high frequency words. In
ACL, pages 297–304.
Simon De Deyne and Gert Storms. 2008. Word asso-ciations: Norms for 1,424 Dutch words in a contin-uous task. Behavior Research Methods, 40(1):198– 205.
Simon De Deyne, Daniel J. Navarro, and Gert Storms. 2013. Better explanations of lexical and semantic cognition using networks derived from continued rather than single-word associations. Behavior Re-search Methods, 45(2):480–498.
Simon De Deyne, Amy Perfors, and Daniel J. Navarro. 2016. Predicting human similarity judgments with distributional models: The value of word associa-tions. InCOLING, pages 1861–1870.
James Deese. 1966. The Structure of Associations in Language and Thought.
Simon Dennis and Michael S. Humphreys. 2001. A context noise model of episodic word recognition.
Psychological Review, 108(2):452–478.
Allyson Ettinger and Tal Linzen. 2016. Evaluating vector space models using human semantic priming results. InREPEVAL, pages 72–77.
Allyson Ettinger, Naomi H. Feldman, Philip Resnik, and Colin Phillips. 2016. Modeling N400 ampli-tude using vector space models of word representa-tion. In Proceedings of the Annual Meeting of the Cognitive Science Society.
Manaal Faruqui and Chris Dyer. 2014. Improving vector space word representations using multilingual correlation. InEACL, pages 462–471.
Manaal Faruqui, Jesse Dodge, Sujay Kumar Jauhar, Chris Dyer, Eduard Hovy, and Noah A. Smith. 2015. Retrofitting word vectors to semantic lexicons. In
NAACL-HLT, pages 1606–1615.
Lev Finkelstein, Evgeniy Gabrilovich, Yossi Matias, Ehud Rivlin, Zach Solan, Gadi Wolfman, and Ey-tan Ruppin. 2002. Placing search in context: The concept revisited. ACM Transactions on Informa-tion Systems, 20(1):116–131.
Ronald A. Fisher. 1915. Frequency distribution of the values of the correlation coefficient in samples from an indefinitely large population. Biometrika, 10(4):507–521.
Juri Ganitkevitch, Benjamin Van Durme, and Chris Callison-Burch. 2013. PPDB: The paraphrase database. InIn NAACL-HLT, pages 758–764.
Daniela Gerz, Ivan Vuli´c, Felix Hill, Roi Reichart, and Anna Korhonen. 2016. SimVerb-3500: A large-scale evaluation set of verb similarity. InEMNLP.
Thomas L. Griffiths, Mark Steyvers, and Joshua B. Tenenbaum. 2007. Topics in semantic representa-tion. Psychological Review, 114(2):211–244.
Annamaria Guida and Alessandro Lenci. 2007. Se-mantic properties of word associations to Italian verbs. Italian Journal of Linguistics, 19(2):293– 326.
Amac¸ Herda˘gdelen, Katrin Erk, and Marco Baroni. 2009. Measuring semantic relatedness with vector space models and random walks. In Proceedings of the 2009 Workshop on Graph-based Methods for NLP, pages 50–53.
Felix Hill and Anna Korhonen. 2014. Learning ab-stract concept embeddings from multi-modal data: Since you probably can’t see what I mean. In
EMNLP, pages 255–265.
Felix Hill, Roi Reichart, and Anna Korhonen. 2015. SimLex-999: Evaluating semantic models with (gen-uine) similarity estimation. Computational Linguis-tics, 41(4):665–695.
Keith A. Hutchison, David A. Balota, James H. Neely, Michael J. Cortese, Emily R. Cohen-Shikora, Chi-Shing Tse, Melvin J. Yap, Jesse J. Bengson, Dale Niemeyer, and Erin Buchanan. 2013. The seman-tic priming project. Behavior Research Methods, 45(4):1099–1114.
Michael N. Jones, Walter Kintsch, and Douglas J.K. Mewhort. 2006. High-dimensional semantic space accounts of priming. Journal of Memory and Lan-guage, 55(4):534–552.
Terry Joyce. 2005. Constructing a large-scale database of Japanese word associations. Corpus Studies on Japanese Kanji (Glottometrics 10), pages 82–98. Douwe Kiela and Stephen Clark. 2014. A
system-atic study of semantic vector space model parame-ters. InProceedings of the 2nd Workshop on Contin-uous Vector Space Models and their Compositional-ity, pages 21–30.
Douwe Kiela, Felix Hill, Anna Korhonen, and Stephen Clark. 2014. Improving multi-modal representa-tions using image dispersion: Why less is sometimes more. InACL, pages 835–841.
Douwe Kiela, Felix Hill, and Stephen Clark. 2015. Specializing word embeddings for similarity or re-latedness. InEMNLP, pages 2044–2048.
Marta Kutas and Kara D. Federmeier. 2011. Thirty years and counting: Finding meaning in the N400 component of the event related brain potential (ERP).
Annual Review of Psychology, 62:621–647.
Oi Yee Kwong. 2013. Exploring the Chinese mental lexicon with word association norms. In PACLIC, pages 153–162.
Thomas K. Landauer and Susan T. Dumais. 1997. Solutions to Plato’s problem: The Latent Semantic Analysis theory of acquisition, induction, and rep-resentation of knowledge. Psychological Review, 104(2):211–240.
Eric Langford, Neil Schwertman, and Margaret Owens. 2001. Is the property of being positively correlated transitive? The American Statistician, 55(4):322– 325.
Omer Levy and Yoav Goldberg. 2014. Dependency-based word embeddings. InACL, pages 302–308. Thang Luong, Richard Socher, and Christopher
Man-ning. 2013. Better word representations with re-cursive neural networks for morphology. InCoNLL, pages 104–113.
Thang Luong, Hieu Pham, and Christopher D. Man-ning. 2015. Bilingual word representations with monolingual quality in mind. InProceedings of the 1st Workshop on Vector Space Modeling for Natural Language Processing, pages 151–159.
William S. Maki and Erin Buchanan. 2008. Latent structure in measures of associative, semantic, and thematic knowledge. Psychonomic Bulletin & Re-view, 15(3):598–603.
Paweł Mandera, Emmanuel Keuleers, and Marc Brys-baert. 2017. Explaining human performance in psy-cholinguistic tasks with models of semantic similar-ity based on prediction and counting: A review and
empirical validation. Journal of Memory and Lan-guage, 92:57–78.
Christopher D. Manning, Prabhakar Raghavan, and Hinrich Sch¨utze. 2008. Evaluation in informa-tion retrieval. Introduction to Information Retrieval, pages 151–175.
Scott McDonald and Chris Brew. 2004. A distribu-tional model of semantic context effects in lexical processing. InACL, pages 17–24.
Oren Melamud, David McClosky, Siddharth Patward-han, and Mohit Bansal. 2016. The role of context types and dimensionality in learning word embed-dings. InNAACL-HLT, pages 1030–1040.
David E. Meyer and Roger W. Schvaneveldt. 1971. Fa-cilitation in recognizing pairs of words: Evidence of a dependence between retrieval operations. Journal of Experimental Psychology, 90(2):227–234. Lukas Michelbacher, Stefan Evert, and Hinrich
Sch¨utze. 2007. Asymmetric association measures. InRANLP.
Tomas Mikolov, Ilya Sutskever, Kai Chen, Gregory S. Corrado, and Jeffrey Dean. 2013. Distributed repre-sentations of words and phrases and their composi-tionality. InNIPS, pages 3111–3119.
Nikola Mrkˇsi´c, Diarmuid ´O S´eaghdha, Blaise Thom-son, Milica Gaˇsi´c, Lina Maria Rojas-Barahona, Pei-Hao Su, David Vandyke, Tsung-Hsien Wen, and Steve J. Young. 2016. Counter-fitting word vec-tors to linguistic constraints. InNAACL-HLT, pages 142–148.
Douglas L. Nelson, Vanessa M. McKinney, Nancy R. Gee, and Gerson A. Janczura. 1998. Interpreting the influence of implicitly activated memories on recall and recognition. Psychological review, 105(2):299– 324.
Douglas L. Nelson, Cathy L. McEvoy, and Simon Den-nis. 2000. What is free association and what does it measure? Memory and Cognition, 28(6):887–899. Douglas L. Nelson, Cathy L. McEvoy, and Thomas A.
Schreiber. 2004. The University of South Florida free association, rhyme, and word fragment norms.
Behavior Research Methods, Instruments, & Com-puters, 36(3):402–407.
Sebastian Pad´o and Mirella Lapata. 2007.
Dependency-based construction of semantic space models. Computational Linguistics, 33(2):161–199. Ellie Pavlick, Pushpendre Rastogi, Juri Ganitkevitch, Benjamin Van Durme, and Chris Callison-Burch. 2015. PPDB 2.0: Better paraphrase ranking, fine-grained entailment relations, word embeddings, and style classification. InACL, pages 425–430. Jeffrey Pennington, Richard Socher, and Christopher
Joaquim Pinto da Costa and Carlos Soares. 2005. A weighted rank measure of correlation. Australian & New Zealand Journal of Statistics, 47(4):515–529.
Joaquin Pinto da Costa. 2015. Rankings and Pref-erences: New Results in Weighted Correlation and Weighted Principal Component Analysis with Appli-cations.
Jeffrey Pound, Peter Mika, and Hugo Zaragoza. 2010. Ad-hoc object retrieval in the Web of data. InWWW, pages 771–780.
Henry L. Roediger, Jason M. Watson, Kathleen B. Mc-Dermott, and David A. Gallo. 2001. Factors that determine false recall: A multiple regression analy-sis.Psychonomic Bulletin & Review, 8(3):385–407.
Tobias Schnabel, Igor Labutov, David Mimno, and Thorsten Joachims. 2015. Evaluation methods for unsupervised word embeddings. InEMNLP.
Sabine Schulte im Walde, Alissa Melinger, Michael Roth, and Andrea Weber. 2008. An empirical char-acterisation of response types in German association norms. Research on Language and Computation, 6(2):205–238.
Roy Schwartz, Roi Reichart, and Ari Rappoport. 2015. Symmetric pattern based word embeddings for im-proved word similarity prediction. InCoNLL, pages 258–267.
Carina Silberer and Mirella Lapata. 2012. Grounded models of semantic representation. In EMNLP, pages 1423–1433.
Anders Søgaard. 2016. Evaluating word embeddings with fMRI and eye-trackings. InREPEVAL, pages 116–121.
Donald P. Spence and Kimberly C. Owens. 1990. Lex-ical co-occurrence and association strength. Journal of Psycholinguistic Research, 19(5):317–330.
Mark Steyvers and Tom Griffiths. 2007. Probabilistic topic models. Handbook of Latent Semantic Analy-sis, 427(7):424–440.
Mark Steyvers and Kenneth J. Malmberg. 2003. The effect of normative context variability on recogni-tion memory. Journal of Experimental Psychology: Learning, Memory, and Cognition, 29(5):760–766.
Mark Steyvers, Richard M. Shiffrin, and Douglas L. Nelson. 2004. Word association spaces for predict-ing semantic similarity effects in episodic memory.
Experimental Cognitive Psychology and its Applica-tions, pages 237–249.
Robert E. Till, Ernest F. Mross, and Walter Kintsch. 1988. Time course of priming for associate and in-ference words in a discourse context. Memory & Cognition, 16(4):283–298.
Yulia Tsvetkov, Manaal Faruqui, Wang Ling, Guil-laume Lample, and Chris Dyer. 2015. Evaluation of word vector representations by subspace alignment. InEMNLP, pages 2049–2054.
Amos Tversky. 1977. Features of similarity. Psycho-logical Review, 84(4):327.
Ellen M. Voorhees. 1999. The TREC-8 question an-swering track report. InTREC, pages 77–82. Ivan Vuli´c and Marie-Francine Moens. 2013.
Cross-lingual semantic similarity of words as the similarity of their semantic word responses. InNAACL-HLT, pages 106–116.
Ivan Vuli´c, Daniela Gerz, Douwe Kiela, Felix Hill, and Anna Korhonen. 2016. HyperLex: A large-scale evaluation of graded lexical entailment. CoRR, abs/1608.02117.
Supplementary Material
Vector Space Models
We evaluate a suite of pre-trained vector space mod-els readily accessible online. We note that these models typically use different training data and other additional resources, and have a varying cov-erage of the English lexicon, but the evaluation score still reveals their ability to effectively capture word association. As mentioned in the paper, we have aimed at making the comparison fair by eval-uating all models using the USF vocabulary as the search space for each model in our comparison.
(0) We evaluate a traditional count-based repre-sentation model which uses positive PMI weight-ing and SVD dimensionality reduction. This is the best performing reduced count-based model from (Baroni et al., 2014). The model was trained on concatenated ukWaC, the English Wikipedia and the British National Corpus with the window size 2, and dimensionality after SVD is set to
d= 500. Vectors were obtained online.16We label this modelcount-ppmi-500d.
(1) Two sets of Glove vectors (Pennington et al., 2014) were used (d = 50 and d = 30) trained on the 6B corpus of concatenated Wikipedia and GigaWord:17glove-6B-50dandglove-6B-300d.
(2) Pre-trained vectors obtained using skip-gram with negative sampling (SGNS) (Mikolov et al., 2013). We use SGNS vectors from (Levy and Goldberg, 2014):sgns-pw-bow-w2and sgns-pw-bow-w5denote vectors trained with bag-of-words (BOW) contexts on the Polyglot Wikipedia (PW) (Al-Rfou et al., 2013) with window sizes 2 and 5, respectively;sgns-pw-depsdenotes vectors trained with dependency-based contexts. All vectors are 300-dimensional.18For more details including the preprocessing procedure and the specification of the used dependency parser, we refer the reader to the original work. We evaluate another SGNS-BOW model trained on a large 8B corpus with the window size2andd= 500to measure the poten-tial gains stemming from the use of larger training
16 http://clic.cimec.unitn.it/composes/semantic-vectors.html
17http://nlp.stanford.edu/projects/glove/ 18https://levyomer.wordpress.com/publications/
corpora.19 This model was used as a baseline in (Schwartz et al., 2015):sgns-8b-bow-w2.
(3) A template-based approach to vector space modeling introduced by Schwartz et al. (2015). Vectors are trained based on co-occurrence of words in symmetric patterns (Davidov and Rap-poport, 2006). We use pre-trained dense vectors (d= 500) trained on the 8B corpus available on-line:20sympat-500d.
(4) Models that use additional linguistic reposi-tories to build semantically specialised improved word vectors. Wieting et al. (2015) use the Para-phrase Database (PPDB) (Ganitkevitch et al., 2013) to learn word vectors which emphasise para-phrasability. They do this by fine-tuning, also known as retro-fitting (Faruqui et al., 2015), SGNS vectors using an objective function designed to in-corporate the PPDB semantic similarity constraints. We test two variants of the Paragram model (d= 25 and d = 300) available online:21
paragram-25dandparagram-300d.
Another variant of the fine-tuning procedure called counter-fitting (CF) was recently proposed by Mrkˇsi´c et al. (2016). The model further improves the Paragram vectors by injecting antonymy con-straints from PPDB v2.0 (Pavlick et al., 2015) into the final vector space.d= 300. We label this model
paragram+cf-300d.22
(5) Two multilingual pre-trained embedding mod-els, aiming to test whether multilingual supervi-sion can help in capturing word association the same way it helps semantic similarity tasks. We use pre-trained vectors of (Luong et al., 2015) ( biskip-256d) which rely on word-aligned parallel data,23 and CCA-based vectors of Faruqui and Dyer (2014) (bicca-512d) which require readily available trans-lation lexicons.24As bilingual representations are not the main focus of this work, for further training details, we refer the reader to the literature.
19 code.google.com/p/word2vec/source/browse/trunk/demo-train-big-model-v1.sh
20http://homes.cs.washington.edu/∼roysch/papers/ sp embeddings/sp embeddings.html