LABOUR
MARKET
COMPETITIVENESS
Executive Summary
3
1. Background
13
1.1 Action Plan for Jobs 2013 13
1.2 Importance of Labour Costs to Enterprise 15
1.3 Structure of Report 15
2. Labour Market Context
16
2.1 Introduction 17
2.2 Overview of Labour Market Trends 17
2.3 Focus on Unemployed 18
2.4 Focus on Labour Market Participation 21
3. Labour Costs and Earnings Data Analysis
22
3.1 Impact of high costs 22
3.2 Overview of Labour Costs Data 23
3.3 Focus on Unit Labour Costs 27
3.4 Recent Developments in Earnings in Ireland 28
4. Social Welfare and Replacement Rates
37
4.1 Introduction to Replacement Rates 38
4.2 Overview of Replacement Rate Data 39
4.3 Policy Considerations 43
4.4 Labour Market Activation 48
5. Sectoral Wage Setting Mechanisms
51
5.1 Introduction to Sectoral Wage Setting Mechanisms 51
5.2 Reform of the Sectoral Wage Setting Mechanisms 53
5.3 Impact of Reforms 55
5.4 Focus on Key Sectors 60
5.5 Conclusions on Reform Agenda 68
6. National Minimum Wage
70
6.1 Introduction to the National Minimum Wage 70
6.2 Overview of Minimum Wage Data 74
7. Labour Tax Competitiveness
81
7.1 Introduction to Labour Taxes 81
7.2 Labour Taxes in Context 84
7.3 Policy Considerations 90
Appendix One: Forfás Board Members
94
Appendix Two: Recent Forfás Publications
95
Executive Summary
Building of the Forfás review of the Costs of Doing Business in Ireland1, this paper focuses on labour costs. As one of the major cost components for firms, labour costs are a key
determinant of both firm-level and national competitiveness. In the absence of exchange rate policy, in order to enhance Ireland’s international competitiveness and job creation, it is necessary to achieve an internal devaluation and to maximise productivity growth. Of course, since international competitiveness is a relative measure, improved cost competitiveness can also be achieved by maintaining lower wage growth than our competitors.
The OECD have pointed out that continued wage restraint over the medium term is required and is of particular importance for traditional, labour intensive sectors whose exports tend to be more labour intensive than MNC-dominated sectors2. The ESRI’ Medium Term review also outlines the negative impact of a loss of labour cost competitiveness on economic activity, employment and the public finances in the medium term3.
Despite some evidence of reductions in Irish labour costs being recorded over recent years, wage rates have proven relatively sticky4. Indeed, despite the reductions, labour costs in Ireland remain above both the OECD and euro area averages. Further, Irish labour costs are once again on an upward trajectory - in the last two quarters of 2012, Irish labour costs increased by more than both the EU27 and the euro area-16 averages. These increases are occurring in the context of an unemployment rate of 13.7 per cent in Q1 2013.
1 Forfás, Costs of Doing Business in Ireland 2012, April 2012
2 Pina, Á., Structural Reforms to Reduce Unemployment and Restore Competitiveness in Ireland, OECD Economics Department Working Papers No. 910, December 2011
3 FitzGerald, J. and Kearney, I. (Editors), Medium-Term Review 2013-2020 ESRI July 2013
Quarterly Change in Labour Costs, Q1 2010 – Q4 2012
Source: Eurostat
OECD research finds that labour market reform can support labour cost competitiveness and employment growth. For example, Germany, having implemented significant labour market reforms in the years preceding the current crisis, has weathered the unemployment crisis relatively well5.
To this end, APJ 2013 commits the Government to taking further steps to address labour cost competiveness in 2013. A range of important initiatives are also underway to enhance individuals skills and competencies and to support people to find work. Two specific actions are outlined in APJ 2013, namely6:
115
Assess the impact of reforms to sectorial wage-setting mechanisms (Industrial Relations (Amendment) Act 2012) in terms of promoting labour market competitiveness.
(Forfás/DJEI)
117
Assess the potential for further actions to support improvements in labour market competitiveness.
(Forfás, DJEI, DSP, D/Finance)
5 Hüfner, F. and C. Klein, The German Labour Market: Preparing for the Future, OECD Economics Department Working Papers, No. 983
6 Action 115 is also required as part of the EU/IMF Programme for Ireland.
-3.0 -2.0 -1.0 0.0 1.0 2.0 3.0 4.0
Q1
2
010
Q2
2
010
Q3
2
010
Q4
2
010
Q1
2
011
Q2
2
011
Q3
2
011
Q4
2
011
Q1
2
012
Q2
2
012
Q3
2
012
Q4
2
012
Perc
enta
ge c
ha
nge
co
mp
ared
to
corr
es
pond
ing
period
of
the
pre
vi
ous
y
ea
r
Ultimately, this report aims to ensure that labour market policy and regulation, and the taxation and social welfare systems support competitive labour costs and job creation. Following a broader review of labour market costs by Forfás in 2010, this paper focuses on a number of key issues, specifically:
Social welfare and replacement rates; Sectoral employment agreements; National minimum wage (NMW); Labour taxes.
The bulk of the State’s interventions in the labour market affect those who are either unemployed or on low or average incomes. Each of the policy areas listed above represents a lever through which the State can influence labour costs. Of course, these policy areas also have other important goals – in particular, ensuring that people have a basic level of income. It is important to note, however, that despite these levers the State has limited influence over wage levels. In most of the economy, wage levels are set by the market and through a wage bargaining process between employers and employees.
Labour Market and Earnings Context
Price and wage competitiveness can be defined as ‘a state in which medium term full employment is achieved and the return on capital matches the global risk-adjusted cost of capital”. Despite significant improvement, the need for further gains in cost competitiveness is still evident through high levels of unemployment and low levels of investment. While a range of factors influence employment and unemployment levels and trends, an analysis of the labour market provides an important assessment of where cost competitiveness may be out of line.
There was an increase in employment of 1.1 per cent or 20,500 in the year to the first quarter of 2013, bringing total employment to 1,845,600. While full-time employment fell by 3,700 (-0.3%), this decrease was offset by an increase in part-time employment of 24,200 (+5.6%). Over the course of the recession, the incidence of both temporary and casual employment has increased significantly.
Unemployment decreased by 29,900 (-13.1%) in the year to Q1 2013 bringing the total number of persons unemployed to 292,000. The long-term unemployment rate (more than 1 year) decreased from 9.5 per cent to 8.4 per cent over the year to Q1 2013. All of this however, must be set against the backdrop of falling labour participation rates.
Labour costs represent the single largest location sensitive cost for most firms and sectors. High costs in general, and high labour costs specifically, damage enterprise development and employment creation.
Looking at earnings data, Ireland has the 17th highest total labour costs level in the OECD-32 and the 11th highest net wage level in the OECD-32. Following three years of competitiveness gains vis-à-vis our key competitors, in the two most recent quarters of 2012, Irish labour costs increased by more than both the EU27 and the euro area average.
manufacturing (-1.1%). In 2012, however, growth in labour costs resumed, particularly in manufacturing (+2.6%) and wholesale and retail trade (+1.8%).
On a more positive note, real Irish unit labour costs (ULCs) fell by 4.3 per cent in 2010 and 3.4 per cent in 2011. The European Commission expect this trend to continue out to 2014, driven by Irish productivity improvements. By comparison, moderate increases (or smaller decreases) are forecast for the EU and euro area. The improvement in overall ULCs, however, is
primarily driven by a small number of high productivity exporting sectors and employment losses in lower productivity sectors.
Firms can control labour costs in a number of ways – through reductions in employment, changes in hours worked or through reductions in hourly wages. Where they have occurred, observed decreases in hourly rates are relatively modest. Instead, many firms have continued to reduce numbers employed and/or contracted hours worked, more consistently and to a greater extent, than adjusting pay rates.
Firms are generally very reluctant to cut hourly wages given the impact of reductions on morale and productivity. It is not surprising, therefore, that there is little evidence of wage reductions either in the general economy or in the sectors most impacted by the reforms to the sectoral wage setting mechanisms (e.g. parts of the retail, accommodation and
construction sectors).
This paper focuses primarily on the financial costs related to employment. Other factors such as ease of hiring and other labour market regulations are not considered. In this regard, the four policy areas covered relate to social welfare and replacement rates; sectoral wage-setting mechanisms; the national minimum wage; and labour taxes. Each of these topics is addressed below.
Social Welfare and Replacement Rates
The replacement rate measures the proportion of out-of-work benefits received when unemployed against take home pay if in work. In general, a replacement rate in excess of 70 per cent is considered to act as a disincentive to work (i.e. if an individual can receive more than 70 per cent of in-work income in benefits, they will demand a higher wage in the market to retain a monetary incentive to work).
Replacement rates vary significantly by individual and family circumstances. For example, a couple with two children and one earner on the average industrial wage has a replacement rate of 66 per cent compared with a replacement rate of 37 per cent for a single individual earning the same amount. While some Irish replacement rates appear high relative to those in other countries, it is important to note that there are relatively small numbers of people with replacement rates significantly above 70 per cent and that where high replacement rates are recorded they are generally a result of either family size and/or entitlements to
Recommendation: Reform the social welfare system so that unemployment benefits (and
consequently replacement rates) decline in line with the length of time a person is out of work.
Responsibility:Department of Social Protection
Recommendation: Undertake a comprehensive review of secondary benefits retention
arrangements for those in receipt of Jobseekers Benefit or Jobseekers Assistance, with a view to establishing whether or not they are effective in the long term in removing barriers to the take up of employment.
Responsibility: Department of Social Protection
Recommendation: The rollout of the Housing Assistance Payment (i.e. decoupling housing
support from social welfare payments) is an essential element in removing barriers to
employment and reducing replacement rates. Once fully implemented, the impact of HAP on replacement rates should be monitored to ensure that the payment successfully reduces barriers to employment, whilst protecting living standards.
Responsibility:Department of Environment, Community and Local Government
Recommendation: Review social welfare supports for part time workers to ensure that they
have a significant financial incentive to avail of an employment opportunity.
Responsibility:Department of Social Protection
Continued action on ensuring that replacement rates do not create impediments to the take up of employment must occur in tandem with improved activation and up-skilling.
Recommendation: There should be wider adoption of activation programmes which are
linked directly to identified enterprise needs; have significant employer engagement in course development, selection of candidates, and programme delivery; and which offer internships to participants.
Responsibility: Department of Education and Skills / Department of Social Protection
Given the collapse in demand for labour over the course of the recession, a series of
Recommendation: The design of the JobsPlus programme should enable clear communication
of the benefits of the initiative, be easily accessible and create limited administrative burden for business. This will require a well-resourced media campaign to provide information and support take-up.
Responsibility: Department of Social Protection
Sectoral Wage Setting Mechanisms
Sectoral wage setting mechanisms (Employment Regulation Orders and Registered Employment Agreements) deal with the pay and working conditions of the employees concerned and may be included in an employee’s contract of employment. Employers of workers covered by EROs and REAs are obliged to pay the wage rates and provide the conditions of employment prescribed by the collective agreement. In 2009, it was estimated that between 212,000 and 284,000 workers were covered by either EROs or REAs.
Following the introduction of the Industrial Relations (Amendment) Act, Ireland agreed to “report to the staff of the European Commission, the IMF, and the ECB on the impact on the labour market of reforms to sectoral wage-setting mechanisms” by the end of the second quarter of 2013. This action was subsequently included in the Action Plan for Jobs 2013 (Action 115) and was assigned to DJEI/ Forfás. A report was submitted to the Minister in June. Separately, a series of legal actions to test the constitutionality of EROs and REAs have been brought forward over recent years. From July 2011, following a High Court ruling, all
Employment Regulation Orders ceased to have statutory effect. In a similar case, REAs were struck down by the Supreme Court in May 2013. The Government is currently studying the rationale and implications of the latter decision.
Within the sectors where sectoral employment agreements operate, Employment Regulation Orders collapsed as a result of the High Court ruling of July 2011. Therefore, the pay and conditions of employees who started work after 7th July 2011 were governed by employment legislation such as the minimum wage. Existing employees who were covered by an ERO had existing contracts of employment, which governed their pay and conditions of work. There is little evidence that hourly wages in the sectors covered by EROs have declined as a result of their abolition. Given that we have less than three quarters of data since the commencement of the Industrial Relations (Amendment) Act, it is not possible to determine what influence, if any, the new Act has had from the available data.
A further factor militating against any major impact from the reform process on wage levels is the fact that much of the reform agenda has not yet been fully implemented or utilised. While the legislative underpinning for sectoral agreements has now changed, new Joint Labour Committees have yet to be established. It is only as the various parties come together under the new JLC arrangements to negotiate and agree new Employment Regulation Orders that we can expect to see an impact on labour competitiveness. Likewise, other elements of the reform agenda (e.g. the finalisation of the overtime and Sunday working codes of practice) could have an impact upon labour competitiveness once completed.
Recommendation: The analysis of the impact of the reforms to the sectoral wage setting
mechanisms should be repeated in due course when sufficient data is available for analysis (i.e. approximately 18 months after all elements of the reform process have been
completed).
Responsibility: Department of Jobs, Enterprise and Innovation
Recommendation: The remaining elements of the wage setting mechanisms reform
programme need to be agreed and implemented. Specifically:
The recommendations contained in the Labour Courts’ review of JLCs should be implemented with a view to minimising administrative costs for enterprise; Outstanding reforms to overtime, Sunday working and the derogation for financial
difficulty need to be concluded quickly with a strong emphasis on enhancing labour cost competitiveness;
Utilisation of the new wage setting mechanisms needs to be progressed quickly given on-going labour cost concerns and Ireland’s unemployment crisis. Renegotiation of agreed rates offers the most impactful method of achieving improved wage competitiveness.
Responsibility: Department of Jobs, Enterprise and Innovation, Labour Relations Commission
National Minimum Wage
The minimum wage is intended to deliver a socially preferable distribution of income than would occur through a free market solution. In general, therefore, the success or otherwise of minimum wage policy is usually measured against its impact on poverty levels. It is important to note that the imposition of a minimum wage can have significant impacts on income and employment levels as well as poverty, and impacts on both firm level and national
competitiveness.
Overall, relatively few employees earn the minimum wage in Ireland - the NMW is most prevalent (in terms of the number of employees earning less than €8.65) in sectors such as hotels and restaurants; wholesale and retail; construction; and other services. Employees earning the NMW are more likely to be employed in sales, craft, personal service or other occupations; are most likely to be between the ages of 15 and 24 years; tend to be female; have relatively low levels of educational attainment (i.e. less than upper secondary); and are more likely to be nationals from the EU Accession States.
In both euro and purchasing power standard terms, the monthly minimum wage in Ireland is relatively high: of the 21 countries for which data is available, Ireland had the 5th highest minimum wage in PPS terms and 4th highest in euro terms, When expressed as a percentage of average wages (44.5%), Ireland has the 8th highest minimum wage out of 20 EU countries examined.
workers. There is a somewhat stronger consensus that NMW can impact on employment levels of young and inexperienced workers, which is reflected in differentiated minimum wage rates in Ireland and elsewhere.
It is recommended that the main NMW rate of €8.65 is maintained at the existing level until there is a significant improvement in the labour market. Consideration should be given to amending the NMW rate for younger cohorts, given the high levels of youth unemployment and evidence that this cohort is most affected by a higher NMW. Currently a rate of €6.06 exists for workers less than 18 years of age. Consideration should be given to introducing a rate lower than €8.65 for all workers aged over 18 and under 21 or 25 years of age. This would:
Reflect current rules governing the payment of Jobseekers Assistance which provide for lower weekly payments to those under the age of 25 years.
Target a cohort of the labour market where the negative consequences of long term unemployment are most pronounced (in terms of future earnings and likelihood of finding employment).
Increase the attractiveness to employers of hiring additional workers.
Recommendation: Consideration should be given to extending the lower NMW rate for
younger workers. Currently a rate of €6.06 exists for workers less than 18 years of age. Recognising high levels of youth unemployment, and to enhance employability, consideration might be given to introducing a rate lower than €8.65 for all workers aged over 18 and under 21 or 25 years of age.
Responsibility: Department of Jobs, Enterprise and Innovation
At present, while the National Minimum Wage Act 2000 provides a range of conditions under which the NMW may be reviewed, it does not mandate that a review should occur at
particular fixed intervals – if such a timeline was in place, this would provide greater certainty for both employers and employees.
Recommendation: Consideration should be given to requiring that a comprehensive review of
the NMW be completed every four to five years, with the other years requiring a streamlined process.
To ensure that any revisions to the NMW are reflective of economic circumstances, and to provide certainty to workers and employers, potential exists to set out a methodology to calculate changes to the NMW (e.g. NMW should reflect changes in monthly median wages, youth unemployment, productivity etc.)
Responsibility: Department of Jobs, Enterprise and Innovation
rates of non-compliance with National Wage legislation7 in the businesses that were selected for inspection. Of the 969 inspections conducted with respect to the NMW over the period January to September 2012, there was a compliance rate of 50 per cent.
From an enforcement perspective, ensuring adherence to employment legislation can be seen as a complementary to the control and activation measures built into the social welfare system – both serve to minimise disincentives to the take up of employment offers.
Recommendation: Continued efforts are required to monitor and enforce compliance with all
aspects of employment law.
Responsibility: Department of Jobs, Enterprise and Innovation / National Employment Rights
Authority
Labour Tax Competitiveness
The tax wedge8 increases labour costs which can have a negative influence on the employer’s decision to retain or hire individuals. A higher tax wedge can also reduce the take-home pay of workers. As a result, workers increase the pre-tax wage they bargain for in wage
negotiations. Higher labour taxes also increase replacement rates (i.e. make work less attractive vis-à-vis social welfare), reduce take home pay, weaken domestic demand and risk stimulating the informal economy. A competitive tax wedge is vital to encourage employment growth across all income categories and is a key factor in attracting and retaining highly skilled and internationally mobile workers.
In general, the Irish taxation system has been broadly supportive of labour market efficiency. Since the onset of the recession while measures were introduced in successive Budgets to widen the tax base and improve the yield while still seeking to maintain progressivity and support employment. There has also been an increase in levels of personal taxation which has eroded cost competitiveness and the incentive to work. As a result, while Ireland’s tax wedge is still relatively low for many lower paid workers, the wedge is much less competitive for higher earners (e.g. earning 167 per cent of the average wage), although not out of line with the OECD average.
To support job creation and enterprise growth, labour taxes should be shielded from any further increases. In this context, the OECD’s hierarchy of taxation provides an essential guide to policymakers. There is also considerable room to raise revenues without increasing the already elevated marginal tax rates (i.e. through reductions in the entry point for income tax).
Recommendation: While recognising the need for fiscal consolidation, in order to support job
creation and enterprise growth, labour taxes should be shielded from any further increases to the extent possible. Efforts to increase Government revenue should focus on alternative sources. Revenues from alternative tax-streams such as the property tax should be used to
7 National Employment Rights Authority, Quarterly Update, Issue 3 2012
support a tax strategy which circumvents the need for further increases in the labour tax wedge and the marginal rates.
Responsibility: Department of Finance
The level at which individuals start paying the higher rate of tax in Ireland (€32,800 for single individuals) is low relative to other countries. The higher rate of tax actually impacts on individuals earning less than the average wage, meaning that marginal tax rates (i.e. the tax paid on an individual’s last euro of income) are now in excess of 50 per cent for single individuals earning €32,800 per annum. High marginal tax rates create a disincentive for workers already in employment to work longer hours. High marginal tax rates also discourage entry into the Irish labour market and may also act as a disincentive for entrepreneurship and risk-taking - the effective marginal rate is 55 per cent for individuals with non-PAYE income over €100,000.
Recommendation: As well as ensuring that, to the extent possible, there are no further
increases in marginal tax rates, it would be beneficial to provide certainty regarding future marginal labour tax rates. Consideration should also be given to flagging when it will be feasible to reduce marginal labour rates below 50 per cent.
Responsibility:Department of Finance/ Department of Social Protection
In addition to direct taxes, other factors add to the costs of employment.
Recommendation: The introduction of further costs on employment (e.g. changes to sick pay
policy, pensions policy, health insurance, etc.) should be considered carefully from a labour cost competitiveness perspective given the scale of our unemployment crisis.
1. Background
1.1 Action Plan for Jobs 2013
The Action Plan for Jobs (APJ) 2013 notes that in order to generate sustainable, broad-based export-led growth, Ireland’s international competitiveness needs to continue to improve. Cost competitiveness is a critical foundation of international competitiveness. Labour costs
represent the single biggest location sensitive cost for most employers. In the absence of exchange rate policy, wage restraint represents one of the key domestic strategies to enhance cost competitiveness. To this end, APJ 2013 commits the Government to taking further steps to address labour and broader cost competiveness in 2013. A range of important initiatives are also underway to enhance individuals skills and competencies and to support people to find work.
Two specific actions are outlined in APJ 2013, namely9:
115
Assess the impact of reforms to sectorial wage-setting mechanisms (Industrial Relations (Amendment) Act 2012) in terms of promoting labour market competitiveness.
(Forfás/DJEI)
117
Assess the potential for further actions to support improvements in labour market competitiveness.
(Forfás, DJEI, DSP, D/Finance)
Such reforms are not unique to Ireland. The OECD10 has noted that OECD countries have sought to raise labour utilisation especially by cutting labour taxes, delaying effective retirement ages, reforming disability schemes and strengthening active labour market policies.
At the onset of the recession, most OECD countries sought to improve the safety net for job losers by boosting unemployment benefit generosity and expanding coverage to new groups of workers. At the same time, more than two-thirds of OECD countries raised resources for job-search assistance and training programmes in order to facilitate employment and re-deployment. To stimulate labour demand, work-sharing arrangements were introduced or expanded in two-thirds of OECD countries, labour taxes were cut and new job or hiring subsidy schemes were introduced, often targeting marginal job seekers such as youth, older workers, or the long-term unemployed. Some temporary measures were subsequently phased out, and difficult labour market reforms were implemented in the areas of retirement schemes, job protection, minimum wages and wage bargaining systems, especially in the context of the European debt crisis.
Objectives
Ultimately, this project aims to ensure that labour market policy and regulation, and the taxation and social welfare systems support competitive labour costs and job creation. In undertaking these actions, a number of questions/issues need to be considered, including:
How do Irish wage levels compare internationally;
How have wage levels in Ireland evolved over the last 5 years? Has the recession led to reductions in wage rates?
What impact do wage rates have on economic growth and international competitiveness?
How does the social welfare system / replacement rates impact upon labour supply; What (if any) impact has ERO/JLC reform had on sectoral wages and employment? What impact does the national minimum wage (NMW) have on labour costs and
employment creation?
What impact does taxation have on the labour market – both in terms of impact on cost and in terms of the incentive effect on labour supply;
Are there other barriers preventing labour costs from adjusting, are these barriers damaging employment creation and what steps are required to address these issues?
The bulk of the State’s interventions in the labour market affect those who are either unemployed or on low or average incomes. The policy recommendations herein, therefore, largely focus on these areas. However, it is important to bear in mind that to the greatest extent possible the market should set wage levels, and interventions should be designed with this in mind11.
Labour market expectations and wage demands are not divorced from happenings elsewhere in the economy. A study to assess the costs of living in Ireland and its impact on wage expectations is currently underway12.
The paper also focuses primarily on the direct financial costs related to employment.
Additional factors such as the cost of childcare are not considered but obviously impact upon individual replacement rates and decisions relating to the take up of employment. Other factors such as ease of hiring and other labour market regulations are not considered. Publications such as the World Bank’s Doing Business 2013 and the IMD’s World Competitiveness Yearbook benchmark consider many of these regulations.
11 The IMF have pointed out that the State’s role in employment creation is somewhat limited and that the vast majority of jobs are created in the private sector. In additional to supporting fundamentals for job creation (through macroeconomic stability and policies to enhance the general business
environment), they note that one of the primarily goals of labour policy should be to “not undermine job creation and instead enhance the development payoffs from jobs”. The State also has a role in identifying selected policy interventions that remove barriers to private sector job creation (e.g. through taxation, spending on social welfare etc.). For further details see International Monetary Fund, Jobs and Growth: Analytical and Operational Considerations for the Fund, March 2013
1.2 Importance of Labour Costs to Enterprise
[image:16.595.98.436.202.426.2]Figure 1 highlights that labour costs represent a relatively high proportion of total input costs across a range of sectors.
Figure 1: Labour Costs as a Percentage of Total Input Costs by Sector, 200913
Depending on the labour intensity of individual sectors, the proportion of total costs accounted for by labour varies. The importance of a range of location sensitive costs for a range of sectors (with a particular focus on exporting sectors) is explored in more detail in the recent Forfás report on the Costs of Doing Business14.
Source: CSO, Supply and Use Tables 2009
1.3 Structure of Report
Chapter 2 provides an analysis of labour market trends, Chapter 3 focuses on labour costs, while Chapters 3-7 examine some of the key factors which influence labour competitiveness, and set out a series of policy recommendations to improve labour market efficiency. While there are a variety of drivers of labour competitiveness (as assessed in Forfás’ 2010 review of labour costs15), this paper focuses on a number of key issues, specifically:
Reductions in high replacement rates;
Reform of the sectoral employment agreements; Modifications to the national minimum wage (NMW); Labour tax competitiveness.
In addition, other issues such as activation and training policies are briefly considered - these are dealt with in greater detail in Pathways to Work, the Action Plan for Jobs 2013, etc.
13 Chart is derived from Table 2 in the CSO’s Supply and Use Tables for Ireland. Inputs are composed of ‘total intermediate consumption of goods and services at purchasers prices’ plus ‘compensation of employees’. 14 Forfás, Costs of Doing Business in Ireland 2012, April 2012
15 In 2010, Forfás conducted a review of labour cost competitiveness - this paper builds upon the existing knowledge base. See Forfás, Review of Labour Cost Competitiveness, October 2010
72.3 71.8 54 .9 52.0 42 .2 38.5 36.7
31.7 30.3 30.1
27.3 26.9 26.8 24.6 23.4 21.3
2. Labour Market Context
Key Findings
Price and wage competitiveness can be defined as “a state in which medium term full employment is achieved and the return on capital matches the global risk-adjusted cost of capital”
An economy is under-competitive, if the levels of prices and wages are sufficiently high to generate an increase in the current or future unemployment rate and/or capital dis-investment – the need for further improvements in Ireland’s cost competitiveness is evident through high levels of unemployment and low levels of investment. In Q4 2012 the broad unemployment rate, which includes part-time underemployed, discouraged workers, passive job seekers and other marginally attached remained high at 23 per cent
There was an increase in employment of 1.1 per cent or 20,500 in the year to the first quarter of 2013, bringing total employment to 1,845,600. Full-time employment fell by 3,700 (-0.3%) but this decrease was offset by an increase in part-time employment of 24,200 (+5.6%). The incidence of temporary employment has also increased
significantly
Unemployment decreased by 29,900 (-13.1%) in the year to Q1 2013 bringing the total number of persons unemployed to 292,000. The long-term unemployment rate (more than 1 year) decreased from 9.5 per cent to 8.4 per cent over the year to Q1 2013 Younger workers, particularly those with lower levels of educational attainment are
most likely to be unemployed. In more detail:
The unemployment rate in Q1 2013 for those with primary education or below is 26.5 per cent; for those with lower secondary is 22 per cent; and for those with a third level honours degree or above is 6.3 per cent
The under-25’s account for 18.4 per cent of total unemployment even though they represent less than 10 per cent of the total labour force
Males (15.9%) are more likely to be unemployed than females (11%)
In Q1 2013 almost 62 per cent of those classified as unemployed were unemployed for more than 12 months. Those most vulnerable to long-term unemployment are those who have: a recent history of long-term unemployment; previous participation on the Community Employment (CE) scheme; advanced age; relatively high number of children; relatively low education; literacy/numeracy problems; are located in urban areas; a lack of personal transport; and low rates of recent labour market engagement Labour participation rates are also falling
2.1 Introduction
Price and wage competitiveness can be defined as ‘a state in which medium term full employment is achieved and the return on capital matches the global risk-adjusted cost of capital”. An economy is under-competitive in cost terms, if the levels of prices and wages are sufficiently high to generate an increase in the unemployment rate and/or capital
disinvestment16. While a range of factors influence employment levels and trends, an analysis of the labour market provides an important assessment of where cost competitiveness may be out of line.
2.2 Overview of Labour Market Trends
[image:18.595.105.449.333.575.2]The analysis in this section draws on the most recent data available from the CSO’s Quarterly National Household Survey (i.e. Quarter 1 2013)17.
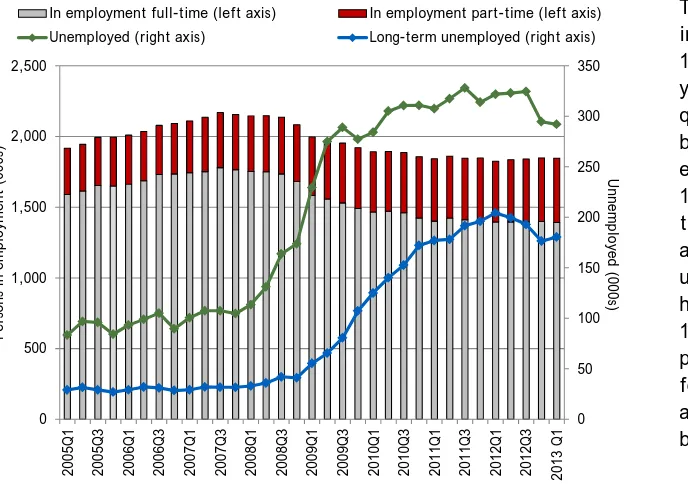
Figure 2: Labour Market Overview, 2005-2013
There was an increase in employment of 1.1% or 20,500 in the year to the first quarter of 2013, bringing total employment to 1,845,600. As a result, the seasonally
adjusted
unemployment rate has decreased to 13.7% - the number of persons unemployed fell by 29,900 also on a seasonally adjusted basis.
Source: CSO, Quarterly National Household Survey
16 By this definition, an economy is over-competitive if prices and wages are so low that the economy is in overheating territory and employment growth is only achievable via significant levels of net
immigration. See Lane, P., Assessing Ireland’s Price and Wage Competitiveness, National Competitiveness Council, 2004
17 Once the results from the 2011 Census of Population became available, the CSO began to revise the QNHS population estimates from Q3 2006 on, based on the new benchmark population totals for 2011. This process will be fully in effect as of Q4 2013. The original population estimate for the second quarter of 2011 for the working age population was 3,502,700. The revised benchmark population estimate for the same period is now 3,599,100, a difference of 2.8 per cent. This difference was not split evenly across all sub-groups within the population. In addition to the updated population estimates, the CSO has introduced some changes to the processes, definitions and weightings.
0 50 100 150 200 250 300 350 0 500 1,000 1,500 2,000 2,500 20 05Q 1 20 05Q 3 20 06Q 1 20 06Q 3 20 07Q 1 20 07Q 3 20 08Q 1 20 08Q 3 20 09Q 1 20 09Q 3 20 10Q 1 20 10Q 3 20 11Q 1 20 11Q 3 20 12Q 1 20 12Q 3 20 13 Q 1 U nne mp lo ye d (0 00 s) Per son s in e m pl oy me nt ( 000s)
Full-time employment fell by 3,700 (-0.3%) over the year but this decrease was offset by an increase in part-time employment of 24,200 (+5.6%). There has been a notable increase in the incidence of part-time employment over the course of the recession compared with the employment peak of Q3 2007 - overall, part-time employment has increased from 18 per cent of total employment to 24.6 per cent; the increase for males (from 7.4 per cent to 14.8 per cent) has been particularly significant.
The incidence of temporary employment has also increased and this has primarily impacted upon younger cohorts18. In Q1 2007, 13.8 per cent of those aged 15-24 years and in
employment where classified as temporary workers, compared with 5.5 per cent of those aged 15-64 years. By Q1 2013 over 32 per cent of the 15-24 years of age cohort were engaged in temporary employment, compared with 9.6 per cent of those aged 15-64 years. The incidence of temporary working in Ireland, however, remains below the euro area average for all age cohorts.
2.3 Focus on Unemployed
While the rise in unemployment is primarily a result of the collapse in demand, both domestically and internationally, demand for labour is intricately linked with the cost of labour.
Unemployment decreased by 29,900 (-13.1%) in the year to Q1 2013 bringing the total number of persons unemployed to 292,000. The long-term unemployment rate decreased from 9.5 per cent to 8.4 per cent over the year.
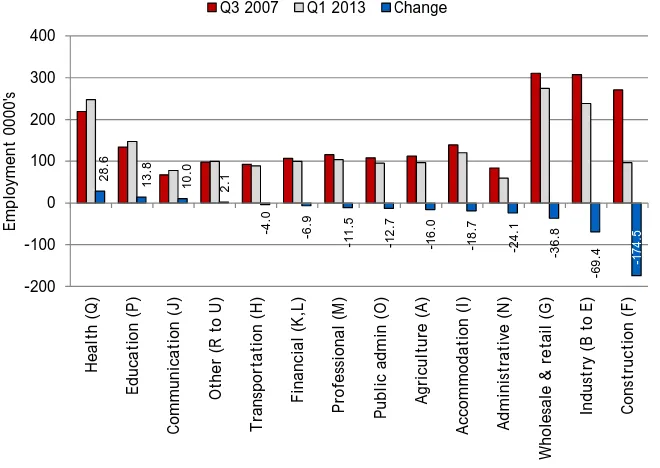
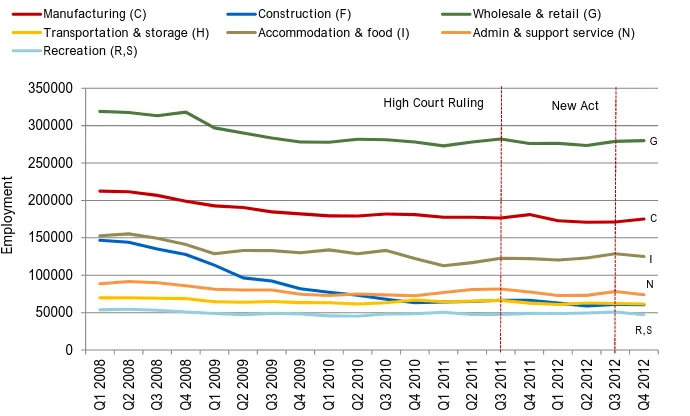
Figure 3: Change in Employment by Sector, Q3 2007 – Q4 2012
Figure 3 examines the change in employment by sector. Since the peak, the greatest reductions in employment have occurred in
construction, industry and the wholesale and retail sector.
Source: CSO, Quarterly National Household Survey
Looking at the most recent CSO data, employment fell in six of the fourteen economic sectors over the year to Q1 2013. The greatest rates of decline were recorded in construction (-6.7% or -7,000); administration and support services (-4.8% or 3,000); and public administration and defence and compulsory social security (-4.3% or -4,300), and transportation and storage (-4.0% or -3,700) sectors. Employment grew in eight of the fourteen sectors - the largest rate of increase was recorded in agriculture, forestry and fishing (+19.5% or +15,700).
Looking in more detail at the unemployment data, males (15.9%) are more likely to be
unemployed than females (11%). The construction sector, which is a male dominated sector in employment terms, was the first to be hit by the effects of the recession. Female
unemployment remained relatively constant until early 2009 – thereafter it increased rapidly. As with male unemployment, there is a strong sectoral dimension to female unemployment - reductions in female employment account for the majority of employment reductions in sectors such as accommodation, wholesale and retail trade and administration.
Educational attainment is highly linked to current prospects in the labour market; the unemployment rate in Q1 2013 for those with primary education or below is 26.5 per cent while the rate for those with lower secondary is 22 per cent, compared with a rate of 6.3 per cent for those with a third level honours degree or above.
Age is also a strong determinant of unemployment. The under-25’s accounts for 18.4 per cent (53,800) of total unemployment even though this cohort only represents less than 10 per cent of the total labour force.
28.6 13.8 10.0
2. 1 -4 .0 -6 .9
-11.5 -12.7 -16.
0 -18.7 -24. 1 -36.8 -69. 4 -174. 5 -200 -100 0 100 200 300 400 He al th (Q ) Ed uc at io n ( P) Commu nicatio n ( J) Oth er ( R to U) Tr an sp ort ation ( H ) Fi na nc ia l (K ,L ) Pr of es sion al ( M ) Pu bl ic a dm in (O ) Agr icu lt ur e ( A ) Acc om m od at io n ( I) Ad min istr ativ e ( N ) W hole sa le & re ta il ( G) In du st ry (B to E ) Co ns tr uc tion (F) Em pl oy me nt 0 000' s
However, further analysis shows that the unemployment profile is more nuanced than single characteristics such as age, gender, or qualifications. Previous analysis by Forfás identified four key cohorts of the labour market with particular and specific characteristics19:
20-54 year olds with no formal/primary level of educational attainment.
15-19 year olds with lower secondary/upper secondary/ PLC educational attainment. 20-24 year olds with PLC, Third Level Non-Degree and Third Level Degree and above
Educational Attainment.
20-24 year olds with Lower and Upper Secondary, 25-34 year olds with Lower
Secondary, Upper Secondary and PLC, 35-44 year olds with Lower Secondary and PLC, 45-54 with Lower Secondary.
2.2.1 Focus on Long-term Unemployment
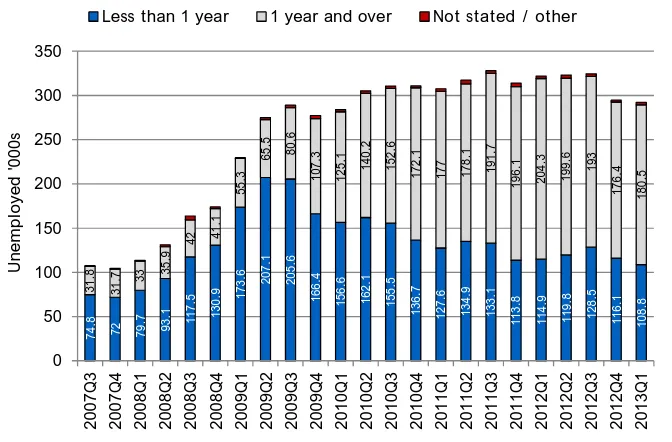
[image:21.595.86.422.409.630.2]Notwithstanding recent reductions, long-term unemployment (more than 1 year) continues to be a cause for concern – and is likely to persist well into the future given (a) the lack of demand for labour and (b) the difficulty experienced by long term unemployed in returning to work.
Figure 4: Duration of Unemployment in Ireland, Q3 2007 – Q4 2012
This chart shows the increase in long term unemployment over the course of the recession – both in terms of absolute numbers and as a proportion of total unemployment. In Q1 2013 almost 62% of those classified as unemployed were unemployed for more than 12 months.
Source: CSO, Quarterly National Household Survey
Those most vulnerable to long-term unemployment have been identified by the ESRI as those with a recent history of long-term unemployment, previous participation on the Community Employment (CE) scheme, advanced age, relatively high number of children, relatively low
19 Forfás, Profile of Employment and Unemployment, February 2010
74.
8
72 79.7 93 .1 117.
5
13
0.9 173 .6 207.1 205.6
16 6.4 156. 6 16 2.1 155. 5 136 .7 127. 6 134. 9 13 3.1 11 3.8 11 4.9 11 9.8 12 8.5 116 .1 10 8. 8 31 .8 31.
7 33 35
.9 42 41. 1 55 .3 65. 5 80 .6 10 7.3 125
.1 140.
2 15 2. 6 17 2.1 177 178. 1 19 1. 7 19 6. 1 20 4.3 19 9. 6 19 3 176. 4 18 0.5 0 50 100 150 200 250 300 350 20 07Q 3 20 07Q 4 20 08Q 1 20 08Q 2 20 08Q 3 20 08Q 4 20 09Q 1 20 09Q 2 20 09Q 3 20 09Q 4 20 10Q 1 20 10Q 2 20 10Q 3 20 10Q 4 20 11Q 1 20 11Q 2 20 11Q 3 20 11Q 4 20 12Q 1 20 12Q 2 20 12Q 3 20 12Q 4 20 13Q 1 U nemplo yed ' 00 0s
education, literacy/numeracy problems, located in urban areas, lack of personal transport, low rates of recent labour market engagement, and spousal earnings20.
Long-term unemployment is, therefore, determined by a number of variables which can be addressed through appropriate labour market interventions (for example, upskilling,
literacy/numeracy interventions, job search supports, traineeships, work placements, specific skills training).
2.4 Focus on Labour Market Participation
The total number of persons in the labour force in the first quarter of 2013 was 2,137,500. This represents a decrease of 9,400 (-0.4%) over the year. The number of persons not in the labour force in Q1 2013 was 1,457,000, an increase of 10,100 (+0.7%) over the year.
The number of persons in the labour force is influenced by changes in the size of the working age population (demographic effect) and by the labour force participation rate.
Up to the start of 2008, the demographic effect had been adding 65,000 or more to the labour force on an annual basis, primarily driven by net inward migration. With the decline in inward migration the positive demographic effect started to fall in the second half of 2007 and continued to decline throughout 2008 and 2009 before becoming negative in Q4 2009. In Q1 2013 this negative demographic effect contributed 12,000 to the overall decline in the labour force and is almost exclusively concentrated in the 20-24 and 25-34 age groups.
As mentioned, the size of the labour force is also impacted by changes in participation. While a relatively low decrease in the participation rate was recorded overall (falling by 0.3 per cent over to year to 59.5 per cent), participation rates differ according to age category - decreases were recorded for the 25-34, 15-19 and 20-24 age groups while the greatest increases were recorded for the 60-64 and 55-59 age groups.
In an international context, the Irish participation rate in Q4 2012 (59.6%) is slightly above EU27 (57.8%) and euro area (57.2%) averages. However, the declining trend is of concern. High levels of unemployment, youth unemployment and long-term unemployment allied to falling participation rates pose a significant challenge to society, to Government and to enterprise.
3. Labour Costs and Earnings Data Analysis
Key Findings
This section examines labour costs across countries, trends in labour costs and unit wage costs to determine whether Irish pay rates are out of line with pay rates in our key competitors
Ireland has the 17th highest total labour costs level in the OECD-32. Ireland has the 11th highest net wage level in the OECD-32 (almost 12 per cent above the OECD average), partly a result of the relatively small gap between before and after-tax wages in Ireland. In terms of hourly compensation costs in manufacturing in 2011, Ireland ($39.83) was more expensive than the OECD average ($33.58), the euro area-13 average (€33.57) and the US (€35.53)
Following 3 years of competitiveness gains versus the euro area, in 2012 labour costs rose by 1.9 per cent in Ireland – close to the EU and euro area averages. In Q3 and Q4 of 2012, Irish labour costs increased by more than both the EU27 and the euro area 16 average
Unit labour costs (ULC) measure the average cost of labour per unit of output. The reduction in Irish ULCs relative to ULC’s in our key competitors in recent years represents a significant competitiveness gain for Ireland. The European Commission expect this trend to continue out to 2014. However, improvements in overall ULCs are primarily driven by a small number of high productivity exporting sectors and
employment losses in lower productivity sectors
Firms can control labour costs in a number of ways – through reductions in employment, changes in hours worked or through reductions in hourly wages. Since 2008, levels of employment have declined dramatically. As of Q1 2013, earnings per week have declined by 1.1 per cent and the average number of weekly hours worked has fallen by 4.6 per cent. Average hourly earnings have increased by 3.6 per cent
Where they have occurred, observed decreases in hourly rates are relatively modest. Instead, many firms have continued to reduce numbers employed and/or contracted hours worked, more consistently and to a greater extent, than adjusting pay rates This finding is not surprising - there is a body of research which indicates that firms are
reluctant to introduce nominal hourly wage reductions. It is more likely that new firms will take advantage of current market conditions. However, given weak domestic demand and low rates of entrepreneurship, it will take time for this cohort to impact on aggregate labour costs and employment growth
3.1 Impact of high costs
High costs damage enterprise development and employment creation. A high cost environment impacts on enterprise development across a range of areas:
productivity growth in these sectors and the containment of unit labour costs, the profile of FDI projects that Ireland has traditionally won has changed (e.g. the labour intensity of investment projects). For the existing FDI base, as some product markets are becoming increasingly commoditised (e.g. electronics in the past decade,
pharmaceuticals as products are coming off patent), it is becoming more challenging to sustain value added (i.e. productivity) and cost competitiveness. That fact that Ireland has priced itself back in the market for previously unattainable FDI projects is only in part a result of reductions in wage costs. Perhaps of more relevance to prospective employers is the confidence that they will not be facing significant earnings growth over the medium term. This more positive outlook relating to future labour costs, allied to falling property costs, the availability of skilled workers, reductions in employee churn and the spill over effects resulting from the international economic recovery makes investment in Ireland a more attractive proposition.
Indigenous Enterprise Base: The performance of our indigenous exports remains closely tied to the UK where labour costs are generally lower. For example, this is evidenced by a very strong trading relationship with Ireland exporting 44 per cent of its estimated €7.12 billion food and drink exports to the UK and importing €2.3 billion or 52 per cent of its total food and live animal imports from the UK. Ireland’s higher cost base and the appreciation of the euro against sterling places the food and drink sector under
pressure both at home, in the UK and in third markets where Irish produce competes with UK produce.
Sub-Supply Base to Exporters: While internationally trading sectors account for a significant share of national value added, they represent a much smaller share of national employment. The more employment intensive locally trading sectors have generally faced a significant rise in unit labour costs – pay costs adjusted for
improvements in productivity. Increases in the broader cost environment damage the costs competitiveness of exporting firms as they source essential goods and services. High local costs reduce the multiplier benefits of export driven growth if international trading firms are driven to source a higher proportion of their raw materials and services overseas.
At a firm level, high costs encourage companies to minimise the use of expensive resources such as labour. This can make marginal business opportunities unviable which results in lost output and employment. In cases where high prices are a genuine
reflection of market demand and supply (e.g. scarcity), prices serve an important role in ensuring the best use of scarce resources. However, if prices remain high (despite the potential availability of resources – labour, property, etc.), enterprise development and broader economic development (tackling unemployment, building vacancy rates, etc.) is impeded. If firms seek to reduce numbers employed and and/or hours worked as a means of managing high labour costs, the loss of human capital may impede their ability to compete for additional business when demand improves.
3.2 Overview of Labour Costs Data
In general, total labour costs relate to the cost to the employer of hiring an employee. Eurostat define labour costs as core expenditure borne by employers for the purpose of employing staff. This includes employee compensation, with wages and salaries in cash and in kind, employers' social security contributions and employment taxes regarded as labour costs minus any subsidies received.
[image:25.595.90.419.287.501.2]Also in terms of methodological issues, it is necessary to note that the changing composition of the labour market impacts on wage data – for example, if relatively more low-paid workers have lost their jobs than high paid workers, then this would serve to force average wage levels up.
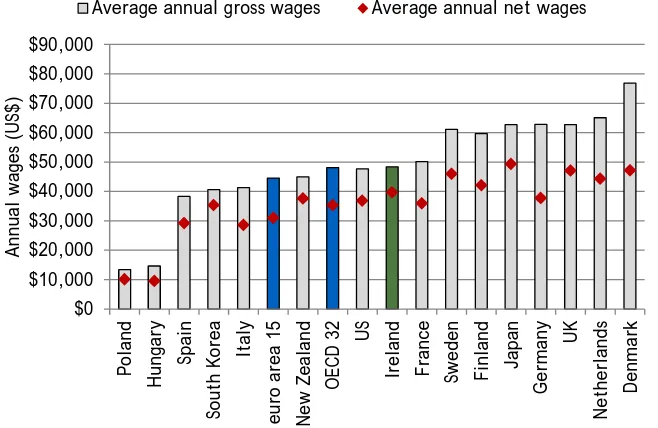
Figure 5: Average Total Labour Costs and Net Wages, 2012
Ireland has the 17th highest total labour costs level in the OECD-3221. The chart also shows average net wage levels. Ireland has the 11th highest net wage level in the OECD-32 (almost 12% above the OECD average), partly a result of the
relatively small gap between before and after-tax wages in Ireland.
OECD, Taxing Wages 2013
21 Total labour costs include wages, taxes on income and employer and employee social security contributions (and in Ireland, the Universal Social Charge which came into effect on 1st January 2011).
$0 $10,000 $20,000 $30,000 $40,000 $50,000 $60,000 $70,000 $80,000 $90,000 Po la nd Hung ar y Spa in So ut h Ko re a It aly eu ro a re a 1 5 Ne w Zea lan d OECD 32 US Ir el an d Fr an ce Sw ed en Fin la nd Ja pa n Ge rman y UK Ne th er la nd s Den m ar k Ann ua l wa ge s (U S$ )
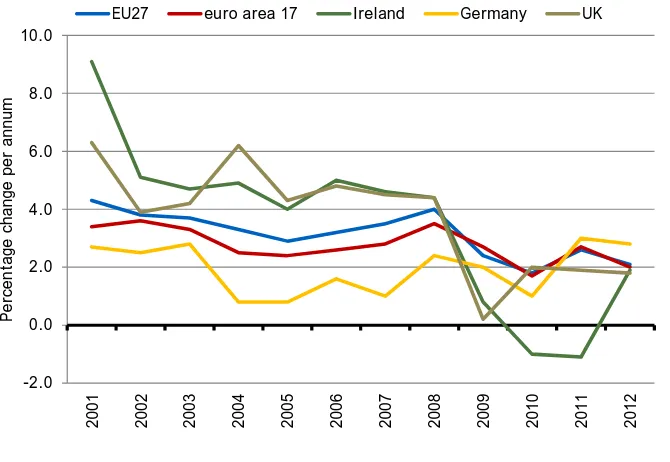
Figure 6: Annual Change in Labour Costs, 2001-2012
This indicator shows the trend in labour cost growth in Ireland compared with the euro area-16 and EU-27. From a high of 9.1% growth in 2001, Irish labour costs have fallen in both 2010 (-1%) and 2011 (-1.(-1%). This represents a gain in competitiveness as labour costs rose in the EU and euro area. In 2012, labour costs rose by 1.9% in Ireland – close to the EU and euro area averages.
Source: Eurostat
Figure 7: Quarterly Change in Labour Costs, Q1 2010 – Q4 2012
Looking at more recent quarterly data, it is clear that Irish labour costs are once again on an upward trajectory. In the last 2 quarters of 2012, Irish labour costs increased by more than both the EU27 and the euro area-16. Due to methodological differences, the quarterly and annual data do not match up exactly. Source: Eurostat -2.0 0.0 2.0 4.0 6.0 8.0 10.0 20 01 20 02 20 03 20 04 20 05 20 06 20 07 20 08 20 09 20 10 20 11 20 12 Pe rce nt ag e c ha ng e per an num
EU27 euro area 17 Ireland Germany UK
-3.0 -2.0 -1.0 0.0 1.0 2.0 3.0 4.0 Q1 20 10 Q2 20 10 Q3 20 10 Q4 20 10 Q1 20 11 Q2 20 11 Q3 20 11 Q4 20 11 Q1 20 12 Q2 20 12 Q3 20 12 Q4 20 12 Percenta ge ch an ge co mp ared to co rres po ndi ng per io d o f the pr ev io us y ea r
[image:26.595.99.442.459.692.2]Figure 8: Average Growth Rate in Labour Costs in Ireland by Sector, 2005-2012
In 2010 and 2011, average growth rates in labour costs fell across most sectors in Ireland. The biggest declines occurred in construction (-5.9%), finance (-2.2%) and manufacturing (-1.1%). In 2012, however, growth in labour costs resumed, particularly in the manufacturing (+2.6%) and trade sectors (+1.8%).
Source: Eurostat
Figure 9: Hourly Compensation Costs in Manufacturing22 (US$), 2011
In terms of hourly compensation costs in manufacturing in 2011, Ireland ($39.83) was more expensive than the OECD average ($33.58), the euro area-13 average (€33.57) and the US (€35.53).
Compensations costs, however, were lower in Ireland than in the Netherlands,
Germany, and the Scandinavian countries.
Source: U.S. Bureau of Labor Statistics
22 Compensation costs relate to all employees in manufacturing and include (1) direct pay, (2) employer social insurance expenditures and (3) labour-related taxes. OECD 28 excludes Chile, Iceland,
Luxembourg, Mexico, Slovenia and Turkey; euro area 13 excludes Cyprus, Luxembourg, Malta and Slovenia. -8.0 -6.0 -4.0 -2.0 0.0 2.0 4.0 6.0 8.0 10.0
2005 2006 2007 2008 2009 2010 2011 2012
Percenta ge cha nge fro m prev io us yea r
Business economy Manufacturing Construction Trade Finance & insurance Public admin
$0 $10 $20 $30 $40 $50 $60 $70 Pola nd Hung ary South Kore a Si ng ap or e N ew Ze al and Spain UK
euro area 1
3.3 Focus on Unit Labour Costs
Unit labour costs (ULC) measure the average cost of labour per unit of output23. ULCs
represent a direct link between productivity and the cost of labour used in generating output. Increasing labour costs driven by increases in productivity drive higher national living
standards. However, a rise in labour costs higher than the rise in labour productivity may be a threat to an economy's cost competitiveness, if other costs are not adjusted in compensation. ULCs should not be interpreted as a comprehensive measure of competitiveness, but as a reflection of cost competitiveness. ULC measures deal exclusively with the cost of labour, which though important, should also be considered in relation to changes in the cost of capital, especially in advanced economies.
[image:28.595.109.465.358.590.2]Cross-country evidence suggests that strong growth in unit labour costs in the years leading up to the crisis is related to employment losses during the crisis. German ULCs fell from 2000 to 2007 - having implemented significant labour market reforms in the years preceding the current crisis, Germany has weathered the unemployment crisis relatively well24.
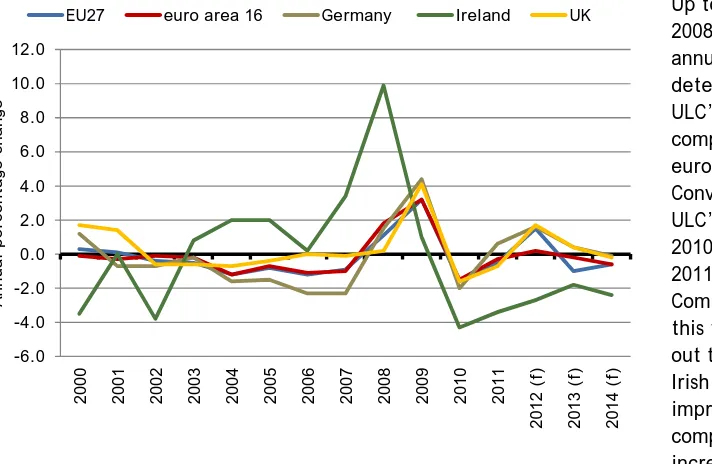
Figure 10: Annual Change in Real Unit Labour Costs, 2001-2014 (f)
Up to and including 2008, significant annual increases (i.e. deterioration) in Irish ULC’s were recorded compared with EU and euro area averages. Conversely, real Irish ULC’s fell by 4.3% in 2010 and 3.4% in 2011. The European Commission expect this trend to continue out to 2014, driven by Irish productivity improvements. By comparison, moderate increases (or smaller decreases) are forecast for the EU and euro area.
Source: Eurostat, Unit Labour Costs Annual Data
23 Nominal unit labour costs are defined as total wage compensation per unit of output. This is equal to the nominal wage rate per worker divided by labour productivity. Real unit labour costs are dividing nominal unit labour costs by the price level and are therefore identical with the wage share in GDP. 24 Hüfner, F. and C. Klein, The German Labour Market: Preparing for the Future, OECD Economics Department Working Papers, No. 983, 2012
-6.0 -4.0 -2.0 0.0 2.0 4.0 6.0 8.0 10.0 12.0
20
00
20
01
20
02
20
03
20
04
20
05
20
06
20
07
20
08
20
09
20
10
20
11
20
12 (f
)
20
13 (f
)
20
14 (f
)
Annua
l percent
age
cha
nge
Figure 11: Real Unit Labour Costs Index, 2012(f) (2008 = 100)
The reduction in Irish ULCs relative to ULC’s in our key competitors represents a
significant
competitiveness gain for Ireland. Figure 11 shows the scale of this gain – relative to 2008 levels, Irish ULCs have declined by over 8% while ULCs in both the euro area and EU27 have marginally increased over the same period.
Source: Eurostat, Unit Labour Costs Annual Data
As outlined in Forfás’ Review of Ireland’s Competitiveness Performance25, improvements in overall ULCs have primarily been driven by a small number of high productivity exporting sectors26. Further, the real improvement in Irish ULCs is likely to be weaker than those reported due to sectoral changes in the economy (i.e. as lower productivity sectors contract as a result of the impact of the recession). A number of sectors experienced decreases in ULCs from 2009 to Q1 2011 (the most up-to-date data available) with decreases in
manufacturing the most significant. However, ULCs in both the construction and financial services sectors increased during this period indicating a loss of cost competitiveness.
3.4 Recent Developments in Earnings in Ireland
This section examines recent earnings trends in Ireland and relies upon data from the CSO’s Earnings, Hours and Employment Costs Survey (EHECS)27 - the most comprehensive and timely
25 See Forfás, Review of Ireland’s Competitiveness Performance 2013, May 2013
26 The ESRI, analysing Irish data from 2006-2009 based on the National Employment Survey, have found that despite an unprecedented fall in output and rise in unemployment, both average earnings and average labour costs increased marginally over the period. Their analysis suggests that a good deal of the downward wage rigidity observed within Irish private sector employment has been driven by factors consistent with continued productivity growth. See Bergin, A., Kelly, E., & McGuinness, S., Explaining Changes in Earnings and Labour Costs During the Recession, Renewal Series Paper 9, ESRI, April 2012 27 The Earnings, Hours and Employment Costs Survey (EHECS) replaced the four-yearly Labour Cost Survey, and also replaced all other CSO short-term earnings inquiries. The EHECS results are comparable across sectors and include more detail on components of earnings and labour costs than was previously available.
91
.6
1
01.5 101.8
earnings data available. It is important to note that firms can control labour costs in a number of ways – through reductions in employment, changes in hours worked or through reductions in hourly wages.
While the rapid increase in unemployment has garnered most attention, over the course of the recession there has been much anecdotal news of significant downward adjustment in earnings and rates of pay. However, the observed decreases in hourly rates and weekly rates, based on CSO data are relatively modest, as illustrated in Table 1 below and the subsequent charts, which focus on aggregate data (i.e. for the entire economy). The analysis does not take account of the impact of compositional changes in employment (i.e. changes in the proportions of high and low paid workers in employment)28.
Table 1: Summary of Earnings Data, Q1 2008 - Q1 2013
Hourly Earnings excluding irregular bonuses
Hourly earnings including irregular bonuses
Earnings per week
Hours per week
Quarterly Change to Q1 2013 1.1 1.9 0.7 -1.3
Annual Change to Q1 2013 1.2 0.7 0.0 -1.0
Change Q1 2008 to Q1 2013 4.5 3.6 -1.1 -4.6
Source: CSO, EHECS Earnings Hours and Employment Costs Survey
28 In their 2009 analysis of composition effects, the CSO noted that “one difficulty typically faced in analysis of short-term earnings data is that the lack of data on the composition of employment within an organisation does not allow the effect of changes in the composition of employment to be estimated. For example, if within an enterprise a group of high paid workers were hired at a point in time then the average earnings for that enterprise will rise, not because of any change in pay-rates but solely due to the compositional effect of having a greater proportion of workers on higher pay scales”. In the period Q3 2008 to Q3 2009 the compositional effect was +1 per cent (i.e. changes in composition of
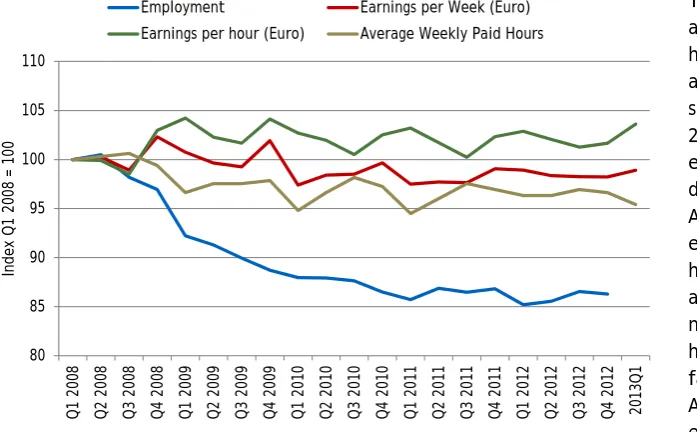
Figure 12: Earnings per Week, Earnings per Hour and Hours Worked, Q1 2008 – Q1 2013
This chart tracks average earnings and hours worked, as well as total employment since 2008. Since 2008, levels of employment have declined dramatically. As of Q1 2013,
earnings per week have declined by 1.1% and the average number of weekly hours worked has fallen by 4.6%. Average hourly earnings have increased by 3.6%.
Source: CSO, EHECS Earnings Hours and Employment Costs Survey
As well as weekly and hourly measurements, it is possible to examine earnings data according to economic sector, occupational grouping, and firm size, as well as differentiating between public and private sector earnings. The main hourly and weekly trends are summarised below.
3.4.1 Hourly Earnings Trends
Over the last year, hourly earnings rose in 6 of 13 sectors, with the largest increases in administrative and support services (+9.4%). The largest decline was recorded in the professional sector (-3.1%). Figure 14, however examines sectoral data over a longer time horizon. 80 85 90 95 100 105 110 Q1 2 00 8 Q2 2 00 8 Q3 2 00 8 Q4 2 00 8 Q1 2 00 9 Q2 2 00 9 Q3 2 00 9 Q4 2 00 9 Q1 2 01 0 Q2 2 01 0 Q3 2 01 0 Q4 2 01 0 Q1 2 01 1 Q2 2 01 1 Q3 2 01 1 Q4 2 01 1 Q1 2 01 2 Q2 2 01 2 Q3 2 01 2 Q4 2 01 2 20 13Q1 In de x Q 1 2008 = 100
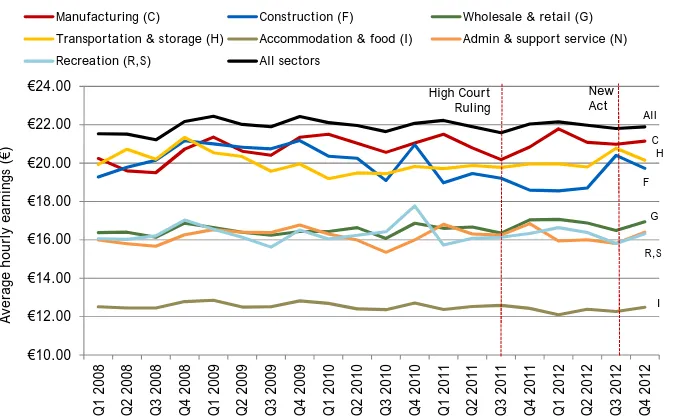
Figure 13: Average Hourly Earnings, Industry Sector, Q1 2008 – Q1 2013
As highlighted in Table 1, aggregate hourly earnings in Q1 2013 were 3.6 per cent above their Q1 2008 level. Since Q1 2008, hourly wages increased in the majority of sectors. Notable exceptions are electricity 11.1%), finance 8.4%), public admin (-4.5%) and construction (-3.8%).
Source: CSO, EHECS Earnings Hours and Employment Costs Survey
Looking at firm size, hourly earnings increased across all firm categories since Q1 200829. Hourly earnings increased by 2.6 per cent in small firms, by 4.0 per cent in medium sized firms and by 3.0 per cent in large firms. There was, however, significant variation between sectors. In sectors such as financial services where a significant proportion of hourly wages were accounted for by irregular bonuses, much of the hourly decline arose as a result of significant reductions in these payments – financial service bonuses fell by over 50 per cent since their peak.
3.4.2 Weekly Earnings Trends
At an aggregate level, average weekly earnings (average hourly wages * average hours worked per week) were virtually unchanged in the year to Q1 2013. Across the economic sectors average weekly earnings increased in 6 of the 13 sectors in the year to Q1 2013, with the largest percentage increase in the administrative and support services sector (+3.3%). The largest percentage sectoral decrease in weekly earnings was recorded in the professional, scientific and technical sector (-3.7%). Figure 14 looks at the change in weekly earnings over the course of the recession.
29 EHECS breaks firms into three categories: under 50 employees, 50-250 employees and above 250 employees. Data on earnings by occupations were discontinued after Q1 2010.
€0 €5 €10 €15 €20 €25 €30 €35 €40 Ed uc at io n ( P) Fi nan ci al (K, L) Co mm un ic at ion ( J) Public admin (O ) Pr ofe ss iona l ( M ) He al th (
Q) All
Figure 14: Earnings per Week (Euro), Industry Sector, Q1 2008 – Q1 2013
Primarily driven by changes in hours worked, reductions in weekly wages were recorded in 11 out of the 15 sectors analysed. The largest reductions were recorded in accommodation 16.4%), electricity 12.1%), construction (-9.6%) and financial services (-7.6%). Increases were recorded in a number of other sectors including
communications (+5%) and manufacturing (+3.6%).
Source: CSO, EHECS Earnings Hours and Employment Costs Survey
In terms of firm size, weekly earnings in small firms declined by 5 per cent between Q1 2008 and Q4 2012. Reductions of 3.1 per cent were recorded in medium sized firms while weekly earnings in large firms increased by 1.5 per cent over the same period.
3.4.3 Public and Private Sector Wage Developments
Employment in the public sector declined by 1.3 per cent over the year to Q1 2013 bringing the total to 383,500 (including semi-state bodies). The reduction in numbers in the public sector over the four years from Q1 2009 to Q1 2013 now stands at 37,500 (-8.9%). In the year to Q1 2013 numbers fell in all areas across the public sector with the largest percentage decrease recorded in the Health sector (-6.3%).
Figure 15: Average Weekly Public and Private Sector Earnings, Q1 2009 – Q1 2013
Weekly earnings the public sector declined by 0.5% in the year to Q1 2013 compared with a private sector increase of 0.7%. In the four years to Q1 2013 average weekly public sector earnings have fallen by -2.2%, compared with a decrease of -0.6% in private sector earnings.
Source: CSO, EHECS Earnings Hours and Employment Costs Survey
3.4.4 Trends in Weekly Paid Hours
Average weekly paid hours were 31.2 in Q1 2013, down by 1 per cent over the year. This represented a 4.6 per cent decline on weekly paid hours in Q1 2008. In the public sector average weekly paid hours decreased by 0.6 per cent over the year to Q1 2013, from 31.7 hours to 31.5 hours.
Looking at a longer time horizon, since Q1 2008, public sector hours have decreased marginally (-0.3%) while paid hours in the private sector have fallen by 6 per cent.
€631.82
€934.00
€709.55
€628.
26
€913
.25
€696.59
€0 €100 €200 €300 €400 €500 €600 €700 €800 €900 €1,000
Private sector Public sector All sectors
Av
era
ge w
eek
ly
e
ar
ni
ng
s