Proceedings of the 2019 Conference on Empirical Methods in Natural Language Processing and the 9th International Joint Conference on Natural Language Processing, pages 6005–6011,
6005
S
UM-QE: a BERT-based Summary Quality Estimation Model
Stratos Xenouleas1, Prodromos Malakasiotis1,
Marianna Apidianaki2 and Ion Androutsopoulos1
1 Department of Informatics, Athens University of Economics and Business, Greece
2 CNRS, LLF, France and University of Helsinki, Finland
[email protected], [email protected] [email protected], [email protected]
Abstract
We propose SUM-QE, a novel Quality Es-timation model for summarization based on BERT. The model addresses linguistic qual-ity aspects that are only indirectly captured by content-based approaches to summary evalu-ation, without involving comparison with hu-man references. SUM-QE achieves very high correlations with human ratings, outperform-ing simpler models addressoutperform-ing these loutperform-inguis- linguis-tic aspects. Predictions of the SUM-QE model can be used for system development, and to in-form users of the quality of automatically pro-duced summaries and other types of generated text.
1 Introduction
Quality Estimation (QE) is a term used in machine translation (MT) to refer to methods that measure the quality of automatically translated text without relying on human references (Bojar et al., 2016, 2017). In this study, we address QE for summa-rization. Our proposed model, SUM-QE, success-fully predicts linguistic qualities of summaries that traditional evaluation metrics fail to capture (Lin, 2004;Lin and Hovy,2003;Papineni et al.,2002; Nenkova and Passonneau, 2004). SUM-QE pre-dictions can be used for system development, to inform users of the quality of automatically pro-duced summaries and other types of generated text, and to select the best among summaries out-put by multiple systems.
SUM-QE relies on the BERT language repre-sentation model (Devlin et al., 2019). We use a pre-trained BERT model adding just a task-specific layer, and fine-tune the entire model on the task of predicting linguistic quality scores manually assigned to summaries. The five cri-teria addressed are given in Figure 1. We pro-vide a thorough evaluation on three publicly avail-able summarization datasets from NIST shared
Q1 – Grammaticality: The summary should have no datelines, system-internal formatting, capitalization errors or obviously ungrammatical sentences (e.g., fragments, missing components) that make the text difficult to read.
Q2 – Non redundancy:There should be no unnecessary repetition in the summary.
Q3 – Referential Clarity: It should be easy to identify who or what the pronouns and noun phrases in the sum-mary are referring to.
Q4 – Focus:The summary should have a focus; sentences should only contain information that is related to the rest of the summary.
Q5 – Structure & Coherence: The summary should be well-structured and well-organized. The summary should not just be a heap of related information, but should build from sentence to sentence to a coherent body of informa-tion about a topic.
Figure 1: SUM-QE rates summaries with respect to five linguistic qualities (Dang,2006a). The datasets we use for tuning and evaluation contain human assigned scores (from 1 to 5) for each of these categories.
tasks, and compare the performance of our model to a wide variety of baseline methods capturing different aspects of linguistic quality. SUM-QE achieves very high correlations with human rat-ings, showing the ability of BERT to model lin-guistic qualities that relate to both text content and form.1
2 Related Work
Summarization evaluation metrics like Pyramid (Nenkova and Passonneau, 2004) and ROUGE (Lin and Hovy, 2003; Lin, 2004) are recall-oriented; they basically measure the content from a model (reference) summary that is preserved in peer (system generated) summaries. Pyra-mid requires substantial human effort, even in its more recent versions that involve the use of word embeddings (Passonneau et al.,2013) and a lightweight crowdsourcing scheme (Shapira et al.,
1Our code is available at https://github.com/
2019). ROUGE is the most commonly used eval-uation metric (Nenkova and McKeown,2012; Al-lahyari et al., 2017; Gambhir and Gupta, 2017). Inspired by BLEU (Papineni et al., 2002), it re-lies on common n-grams or subsequences be-tween peer and model summaries. Many ROUGE versions are available, but it remains hard to de-cide which one to use (Graham, 2015). Being recall-based, ROUGE correlates well with Pyra-mid but poorly with linguistic qualities of sum-maries. Louis and Nenkova (2013) proposed a regression model for measuring summary quality without references. The scores of their model cor-relate well with Pyramid and Responsiveness, but text quality is only addressed indirectly.2
Quality Estimation is well established in MT (Callison-Burch et al., 2012; Bojar et al., 2016, 2017;Martins et al.,2017;Specia et al.,2018). QE methods provide a quality indicator for translation output at run-time without relying on human ref-erences, typically needed by MT evaluation met-rics (Papineni et al.,2002;Denkowski and Lavie, 2014). QE models for MT make use of large post-edited datasets, and apply machine learning meth-ods to predict post-editing effort scores and quality (good/bad) labels.
We apply QE to summarization, focusing on linguistic qualities that reflect the readability and fluency of the generated texts. Since no post-edited datasets – like the ones used in MT – are available for summarization, we use instead the ratings assigned by human annotators with respect to a set of linguistic quality criteria. Our proposed models achieve high correlation with human judg-ments, showing that it is possible to estimate sum-mary quality without human references.
3 Datasets
We use datasets from the NIST 05, DUC-06 and DUC-07 shared tasks (Dang, 2006a,b; Over et al., 2007). Given a question and a clus-ter of newswire documents, the contestants were asked to generate a 250-word summary answer-ing the question. DUC-05 contains 1,600 sum-maries (50 questions x 32 systems); in DUC-06, 1,750 summaries are included (50 questions x 35
2
[image:2.595.308.527.62.204.2]In the Responsiveness annotation instructions, anno-tators were asked to assess the linguistic quality of the summary only if it interfered with the expression of in-formation and reduced the amount of conveyed infor-mation. See https://duc.nist.gov/duc2005/ responsiveness.assessment.instructions
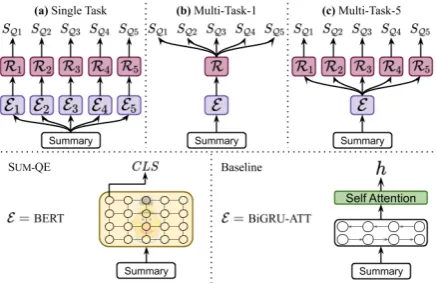
Figure 2: Illustration of different flavors of the investi-gated neural QE methods. An encoder (E) converts the summary to a dense vector representationh. A regres-sorRi predicts a quality scoreSQi using h. E is ei-ther a BiGRU with attention (BiGRU-ATT) or BERT (SUM-QE).Rhas three flavors, one single-task (a) and two multi-task (b, c).
systems); and DUC-07 has 1,440 summaries (45 questions x 32 systems).
The submitted summaries were manually eval-uated in terms of content preservation using the Pyramid score, and according to five linguistic quality criteria (Q1, . . . ,Q5), described in Fig-ure1, that do not involve comparison with a model summary. Annotators assigned scores on a five-point scale, with 1 and 5 indicating that the sum-mary is bad or good with respect to a specificQ. The overall score for a contestant with respect to a specific Q is the average of the manual scores assigned to the summaries generated by the con-testant. Note that the DUC-04 shared task in-volved sevenQs, but some of them were found to be highly overlapping and were grouped into five in subsequent years (Over et al., 2007).3 We ad-dress these five criteria and use DUC data from 2005 onwards in our experiments.
4 Methods
4.1 The SUM-QE Model
In SUM-QE, each peer summary is converted into a sequence of token embeddings, consumed by an encoder E to produce a (dense vector) summary representationh. Then, a regressorR predicts a quality scoreSQas an affine transformation ofh:
SQ=R(h) =WRh+bR (1)
Non-linear regression could also be used, but a
linear (affine) R already performs well. We use BERT as our main encoder and fine-tune it in three ways, which leads to three versions of SUM-QE.
Single-task (BERT-FT-S-1): The first version of SUM-QE uses five separate estimators, one per quality score, each having its own encoder Ei (a separate BERT instance generating hi) and re-gressor Ri (a separate linear regression layer on top of the corresponding BERT instance):
SQi=Ri(hi), i= 1. . .5 (2)
Multi-task with one regressor (BERT-FT-M-1): The second version of SUM-QE uses one estima-tor to predict all five quality scores at once, from a single encodinghof the summary, produced by a single BERT instance. The intuition is thatE will learn to create richer representations so thatR(an affine transformation ofhwith 5 outputs) will be able to predict all quality scores:
SQi =R(h)[i], i= 1. . .5 (3)
whereR(h)[i]is thei-th element of the vector re-turned byR.
Multi-task with 5 regressors (BERT-FT-M-5): The third version of SUM-QE is similar to BERT-FT-M-1, but we now use five different linear (affine) regressors, one per quality score:
SQi =Ri(h), i= 1. . .5 (4)
Although BERT-FT-M-5 is mathematically equiv-alent to BERT-FT-M-1, in practice these two ver-sions of SUM-QE produce different results be-cause of implementation details related to how the losses of the regressors (five or one) are combined.
4.2 Baselines
BiGRUs with attention: This is very similar to SUM-QE but now E is a stack of BiGRUs with self-attention (Xu et al.,2015), instead of a BERT instance. The final summary representation (h) is the sum of the resulting context-aware token em-beddings (h = P
iaihi) weighted by their self-attention scores (ai). We again have three flavors: one single-task (BiGRU-ATT-S-1) and two multi-task (BiGRU-ATT-M-1 and BiGRU-ATT-M-5).
ROUGE: This baseline is the ROUGE ver-sion that performs best on each dataset, among the versions considered by Graham (2015). Al-though ROUGE focuses on surface similarities
between peer and reference summaries, we would expect properties like grammaticality, referential clarity and coherence to be captured to some ex-tent by ROUGE versions based on longn-grams or longest common subsequences.
Language model (LM): For a peer summary, a reasonable estimate of Q1 (Grammaticality) is the perplexity returned by a pre-trained language model. We experiment with the pre-trained GPT-2 model (Radford et al., 2019), and with the prob-ability estimates that BERT can produce for each token when the token is treated as masked (BERT-FR-LM).4Given that the grammaticality of a sum-mary can be corrupted by just a few bad tokens, we compute the perplexity by considering only thek worst (lowest LM probability) tokens of the peer summary, wherekis a tuned hyper-parameter.5
Next sentence prediction: BERT training re-lies on two tasks: predicting masked tokens and next sentence prediction. The latter seems to be aligned with the definitions of Q3 (Referential Clarity),Q4(Focus) andQ5(Structure & Coher-ence). Intuitively, when a sentence follows another with high probability, it should involve clear refer-ential expressions and preserve the focus and local coherence of the text.6 We, therefore, use a pre-trained BERT model (BERT-FR-NS) to calculate the sentence-level perplexity of each summary:
H= 2 −1
n n P
i=2
log2p(si|si−1)
(5)
wherep(si|si−1)is the probability that BERT
as-signs to the sequence of sentenceshsi−1, si, andn
is the number of sentences in the peer summary.
5 Experiments
To evaluate our methods for a particular Q, we calculate the average of the predicted scores for the summaries of each particular contestant, and the average of the corresponding manual scores assigned to the contestant’s summaries. We mea-sure the correlation between the two (predicted vs.
4
Here BERT parameters are frozen (not fine-tuned). We use the pre-trained masked LM model to obtain probability estimates for the tokens, which are then used to calculate the perplexity.
5
DUC-05 DUC-06 DUC-07
ρ τ r ρ τ r ρ τ r
Q
1
Grammaticality
BEST-ROUGE 0.213 0.128 0.033 -0.049 -0.044 0.331 0.387 0.283 0.506
GPT-2 0.678 0.511 0.637 0.391 0.280 0.593 0.780 0.586 0.675
BERT-FR-LM 0.437 0.319 0.025 0.524 0.354 0.667 0.598 0.453 0.566
BiGRU-ATT-S-1 0.119 0.079 0.116 0.263 0.182 0.459 0.119 0.085 0.494
BiGRU-ATT-M-1 0.190 0.144 0.091 0.619 0.462 0.757 0.332 0.235 0.662
BiGRU-ATT-M-5 0.156 0.160 0.040 0.613 0.466 0.771 0.315 0.215 0.584
BERT-FT-S-1 0.681 0.543 0.817 0.907 0.760 0.929 0.845 0.672 0.930
BERT-FT-M-1 0.675 0.543 0.805 0.889 0.749 0.902 0.851 0.684 0.896
BERT-FT-M-5 0.712 0.564 0.802 0.883 0.732 0.925 0.840 0.680 0.902
Q
2
Non
redundanc
y BEST-ROUGE -0.121 -0.081 0.064 -0.401 -0.301 -0.408 -0.299 -0.222 -0.486
BiGRU-ATT-S-1 -0.063 -0.049 -0.101 0.511 0.358 0.514 0.468 0.352 0.457
BiGRU-ATT-M-1 -0.197 -0.143 -0.094 0.478 0.478 0.524 0.478 0.340 0.565
BiGRU-ATT-M-5 -0.226 -0.167 -0.124 0.414 0.304 0.399 0.283 0.201 0.238
BERT-FT-S-1 0.330 0.232 0.499 0.677 0.517 0.679 0.756 0.576 0.689
BERT-FT-M-1 0.333 0.232 0.494 0.791 0.615 0.789 0.761 0.596 0.799
BERT-FT-M-5 0.377 0.310 0.471 0.632 0.460 0.674 0.754 0.572 0.740
Q
3
Referential
clarity
BEST-ROUGE 0.381 0.284 0.166 0.411 0.329 0.372 0.449 0.347 0.407
BERT-FR-NS 0.185 0.130 -0.138 0.462 0.315 0.494 0.478 0.322 0.085
BiGRU-ATT-S-1 0.662 0.479 0.468 0.493 0.342 0.647 0.664 0.476 0.677
BiGRU-ATT-M-1 0.702 0.540 0.492 0.527 0.396 0.681 0.732 0.533 0.681
BiGRU-ATT-M-5 0.694 0.519 0.492 0.579 0.427 0.719 0.659 0.472 0.655
BERT-FT-S-1 0.913 0.759 0.796 0.872 0.732 0.901 0.934 0.796 0.936
BERT-FT-M-1 0.889 0.714 0.761 0.881 0.735 0.882 0.879 0.699 0.891
BERT-FT-M-5 0.810 0.617 0.732 0.860 0.718 0.919 0.889 0.723 0.895
Q
4
F
ocus
BEST-ROUGE 0.440 0.373 0.270 0.440 0.331 0.475 0.495 0.360 0.563
BERT-FR-NS 0.458 0.337 -0.106 0.522 0.354 0.508 0.547 0.364 0.089
BiGRU-ATT-S-1 0.150 0.110 0.153 0.355 0.242 0.644 0.433 0.321 0.533
BiGRU-ATT-M-1 0.199 0.118 0.194 0.366 0.259 0.653 0.533 0.372 0.553
BiGRU-ATT-M-5 0.154 0.097 0.160 0.493 0.371 0.691 0.645 0.462 0.657
BERT-FT-S-1 0.645 0.471 0.578 0.814 0.636 0.853 0.873 0.704 0.902
BERT-FT-M-1 0.664 0.491 0.642 0.776 0.608 0.842 0.893 0.745 0.905
BERT-FT-M-5 0.791 0.621 0.739 0.875 0.710 0.911 0.818 0.636 0.867
Q
5
Structure
&
Coherence
BEST-ROUGE 0.391 0.300 0.039 0.080 0.056 0.023 0.370 0.292 0.293
BERT-FR-NS 0.200 0.153 -0.140 0.171 0.120 0.285 0.418 0.280 0.015
BiGRU-ATT-S-1 0.223 0.153 0.040 0.458 0.326 0.526 0.606 0.442 0.534
BiGRU-ATT-M-1 0.404 0.264 0.067 0.479 0.350 0.599 0.664 0.499 0.576
BiGRU-ATT-M-5 0.244 0.157 -0.113 0.435 0.296 0.540 0.522 0.389 0.506
BERT-FT-S-1 0.536 0.415 0.477 0.681 0.522 0.810 0.862 0.690 0.857
BERT-FT-M-1 0.566 0.419 0.512 0.684 0.515 0.726 0.864 0.690 0.803
[image:4.595.85.514.77.497.2]BERT-FT-M-5 0.634 0.472 0.586 0.796 0.620 0.892 0.921 0.787 0.843
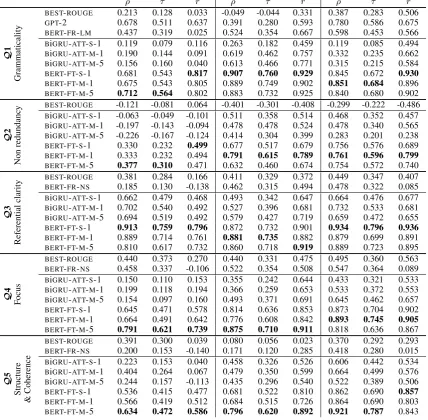
Table 1: Spearman’sρ, Kendall’sτand Pearson’srcorrelations on DUC-05, DUC-06 and DUC-07 forQ1–Q5. BEST-ROUGE refers to the version that achieved best correlations and is different across years.
manual) across all contestants using Spearman’sρ, Kendall’sτ and Pearson’sr.
We train and test the SUM-QE and BiGRU-ATT versions using a 3-fold procedure. In each fold, we train on two datasets (e.g., DUC-05, 06) and test on the third (e.g., DUC-07). We follow the same procedure with the three BiGRU-based models. Hyper-perameters are tuned on a held out subset from the training set of each fold.
6 Results
Table 1 shows Spearman’s ρ, Kendall’s τ and Pearson’srfor all datasets and models. The three fine-tuned BERT versions clearly outperform all other methods. Multi-task versions seem to
per-form better than single-task ones in most cases. Especially forQ4andQ5, which are highly cor-related, the multi-task BERT versions achieve the best overall results. BiGRU-ATT also benefits from multi-task learning.
DUC-05 DUC-06 DUC-07 Q1 3.77 (±0.42) 3.58 (±0.60) 3.54 (±0.78) Q2 4.41 (±0.20) 4.23 (±0.26) 3.71 (±0.31) Q3 2.99 (±0.50) 3.11 (±0.52) 3.20 (±0.66) Q4 3.15 (±0.41) 3.60 (±0.39) 3.30 (±0.47) Q5 2.18 (±0.46) 2.39 (±0.51) 2.42 (±0.59)
Table 2: Mean manual scores (±standard deviation) for eachQacross datasets.Q2is the hardest to predict because it has the highest scores and the lowest stan-dard deviation.
BEST-ROUGE has a negative correlation with the ground-truth scores for Q2 since it does not account for repetitions. The BiGRU-based mod-els also reach their lowest performance on Q2 in DUC-05. A possible reason for the higher relative performance of the BERT-based models, which achieve a moderate positive correlation, is that BiGRU captures long-distance relations less effectively than BERT, which utilizes Transform-ers (Vaswani et al.,2017) and has a larger recep-tive field. A possible improvement would be a stacked BiGRU, since the states of higher stack layers have a larger receptive field as well.7
The BERT multi-task versions perform better with highly correlated qualities like Q4 and Q5 (as illustrated in Figures 2 to 4 in the supplemen-tary material). However, there is not a clear win-ner among them. Mathematical equivalence does not lead to deterministic results, especially when random initialization and stochastic learning al-gorithms are involved. An in-depth exploration of this point would involve further investigation, which will be part of future work.
7 Conclusion and Future Work
We propose a novel Quality Estimation model for summarization which does not require hu-man references to estimate the quality of auto-matically produced summaries. SUM-QE suc-cessfully predicts qualitative aspects of summaries that recall-oriented evaluation metrics fail to ap-proximate. Leveraging powerful BERT represen-tations, it achieves high correlations with human scores for most linguistic qualities rated, on three different datasets. Future work involves extend-ing the SUM-QE model to capture content-related aspects, either in combination with existing
eval-7As we move up the stack, the states are affected directly by their neighbors and indirectly by the neighbors of their neighbors, and so on.
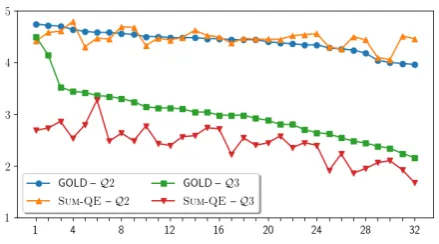
Figure 3: Comparison of the mean gold scores assigned forQ2andQ3to each of the 32 systems in the DUC-05 dataset, and the corresponding scores predicted by SUM-QE. Scores range from 1 to 5. The systems are sorted in descending order according to the gold scores. SUM-QE makes more accurate predictions forQ2than forQ3, but struggles to put the systems in the correct order.
uation metrics (like Pyramid and ROUGE) or, preferably, by identifying important information in the original text and modelling its preservation in the proposed summaries. This would preserve SUM-QE’s independence from human references,
a property of central importance in real-life usage scenarios and system development settings.
The datasets used in our experiments come from the NIST DUC shared tasks which com-prise newswire articles. We believe that SUM-QE could be easily applied to other domains. A small amount of annotated data would be needed for fine-tuning – especially in domains with special-ized vocabulary (e.g., biomedical) – but the model could also be used out of the box. A concrete esti-mation of performance in this setting will be part of future work. Also, the model could serve to es-timate linguistic qualities other than the ones in the DUC dataset with mininum effort.
Finally, SUM-QE could serve to assess the qual-ity of other types of texts, not only summaries. It could thus be applied to other text generation tasks, such as natural language generation and sen-tence compression.
Acknowledgments
References
Mehdi Allahyari, Seyedamin Pouriyeh, Mehdi Assefi, Saeid Safaei, Elizabeth D. Trippe, Juan B. Gutier-rez, and Krys Kochut. 2017. Text Summarization Techniques: A Brief Survey. Advanced Computer Science and Applications, 8:397–405.
Ondˇrej Bojar, Rajen Chatterjee, Christian Federmann, Yvette Graham, Barry Haddow, Shujian Huang, Matthias Huck, Philipp Koehn, Qun Liu, Varvara Logacheva, Christof Monz, Matteo Negri, Matt Post, Raphael Rubino, Lucia Specia, and Marco Turchi. 2017. Findings of the 2017 Conference on Machine Translation (WMT17). InProceedings of the Second Conference on Machine Translation, pages 169–214, Copenhagen, Denmark. Association for Computational Linguistics.
Ondˇrej Bojar, Rajen Chatterjee, Christian Federmann, Yvette Graham, Barry Haddow, Matthias Huck, Antonio Jimeno Yepes, Philipp Koehn, Varvara Logacheva, Christof Monz, Matteo Negri, Aure-lie Neveol, Mariana Neves, Martin Popel, Matt Post, Raphael Rubino, Carolina Scarton, Lucia Spe-cia, Marco Turchi, Karin Verspoor, and Marcos Zampieri. 2016. Findings of the 2016 Conference on Machine Translation. InProceedings of the First Conference on Machine Translation, pages 131– 198, Berlin, Germany. Association for Computa-tional Linguistics.
Chris Callison-Burch, Philipp Koehn, Christof Monz, Matt Post, Radu Soricut, and Lucia Specia. 2012.
Findings of the 2012 Workshop on Statistical Ma-chine Translation. In Proceedings of the Seventh Workshop on Statistical Machine Translation, pages 10–51, Montr´eal, Canada. Association for Compu-tational Linguistics.
Hoa Trang Dang. 2006a. DUC 2005: Evaluation of Question-focused Summarization Systems. In Pro-ceedings of the Workshop on Task-Focused Sum-marization and Question Answering, SumQA ’06, pages 48–55, Sydney, Australia.
Hoa Trang Dang. 2006b. Overview of DUC 2006. In
Proceedings of the Document Understanding Work-shop at HLT-NAACL 2006, Brooklyn, NY, USA.
Michael Denkowski and Alon Lavie. 2014. Meteor Universal: Language Specific Translation Evalua-tion for Any Target Language. In Proceedings of the Ninth Workshop on Statistical Machine Trans-lation, pages 376–380, Baltimore, Maryland, USA. Association for Computational Linguistics.
Jacob Devlin, Ming-Wei Chang, Kenton Lee, and Kristina Toutanova. 2019. BERT: Pre-training of Deep Bidirectional Transformers for Language Un-derstanding. InProceedings of the 2019 Conference of the North American Chapter of the Association for Computational Linguistics: Human Language Technologies, Volume 1 (Long and Short Papers), pages 4171–4186, Minneapolis, Minnesota. Associ-ation for ComputAssoci-ational Linguistics.
Mahak Gambhir and Vishal Gupta. 2017. Recent auto-matic text summarization techniques: a survey. Ar-tificial Intelligence Review, 47(1):1–66.
Yvette Graham. 2015. Re-evaluating Automatic Sum-marization with BLEU and 192 Shades of ROUGE. In Proceedings of the 2015 Conference on Empiri-cal Methods in Natural Language Processing, pages 128–137, Lisbon, Portugal. Association for Compu-tational Linguistics.
D.E. Hinkle, W. Wiersma, and S.G. Jurs. 2003. Applied Statistics for the Behavioral Sciences, volume 663 of Applied Statistics for the Behavioral Sciences. Houghton Mifflin.
Chin-Yew Lin. 2004. ROUGE: A Package for Au-tomatic Evaluation of Summaries. In Workshop on Text Summarization Branches Out, pages 74–81, Barcelona, Spain. Association for Computational Linguistics.
Chin-Yew Lin and Eduard Hovy. 2003. Auto-matic Evaluation of Summaries Using N-gram Co-occurrence Statistics. In Proceedings of the 2003 Human Language Technology Conference of the North American Chapter of the Association for Computational Linguistics, pages 150–157, Edmon-ton, Canada. Association for Computational Lin-guistics.
Annie Louis and Ani Nenkova. 2013. Automati-cally Assessing Machine Summary Content With-out a Gold Standard. Computational Linguistics, 39(2):267–300.
Andr´e F. T. Martins, Marcin Junczys-Dowmunt, Fabio N. Kepler, Ram´on Astudillo, Chris Hokamp, and Roman Grundkiewicz. 2017. Pushing the Lim-its of Translation Quality Estimation. Transactions of the Association for Computational Linguistics, 5:205–218.
Ani Nenkova and Kathleen McKeown. 2012. A Survey of Text Summarization Techniques. In Charu C. Ag-garwal and ChengXiang Zhai, editors, Mining Text Data, pages 43–76. Springer, Boston, MA.
Ani Nenkova and Rebecca Passonneau. 2004. Evaluat-ing Content Selection in Summarization: The Pyra-mid Method. In Proceedings of the Human Lan-guage Technology Conference of the North Ameri-can Chapter of the Association for Computational Linguistics: HLT-NAACL 2004, pages 145–152, Boston, Massachusetts, USA. Association for Com-putational Linguistics.
Paul Over, Hoa Dang, and Donna Harman. 2007. DUC in Context.Information Processing & Management, 43(6):1506–1520.
Pennsylvania, USA. Association for Computational Linguistics.
Rebecca J. Passonneau, Emily Chen, Weiwei Guo, and Dolores Perin. 2013. Automated Pyramid Scoring of Summaries using Distributional Semantics. In
Proceedings of the 51st Annual Meeting of the As-sociation for Computational Linguistics (Volume 2: Short Papers), pages 143–147, Sofia, Bulgaria. As-sociation for Computational Linguistics.
Alec Radford, Jeff Wu, Rewon Child, David Luan, Dario Amodei, and Ilya Sutskever. 2019. Language Models are Unsupervised Multitask Learners.
Ori Shapira, David Gabay, Yang Gao, Hadar Ronen, Ramakanth Pasunuru, Mohit Bansal, Yael Ams-terdamer, and Ido Dagan. 2019. Crowdsourcing Lightweight Pyramids for Manual Summary Eval-uation. InProceedings of the 2019 Conference of the North American Chapter of the Association for Computational Linguistics: Human Language Tech-nologies, Volume 1 (Long and Short Papers), pages 682–687, Minneapolis, Minnesota. Association for Computational Linguistics.
Lucia Specia, Fr´ed´eric Blain, Varvara Logacheva, Ram´on Astudillo, and Andr´e F. T. Martins. 2018.
Findings of the WMT 2018 Shared Task on Quality Estimation. InProceedings of the Third Conference on Machine Translation: Shared Task Papers, pages 689–709, Belgium, Brussels. Association for Com-putational Linguistics.
Ashish Vaswani, Noam Shazeer, Niki Parmar, Jakob Uszkoreit, Llion Jones, Aidan N Gomez, Łukasz Kaiser, and Illia Polosukhin. 2017. Attention is All you Need. InAdvances in Neural Information Pro-cessing Systems 30, pages 5998–6008. Curran Asso-ciates, Inc.