Abstract— In this paper a discussion about how to model biofuel plants for the risk optimization is presented. The model is detailed and remarked paying special attention on the human error and the context for the new installations. The material is presented from the basic to advanced material and the all work is well referenced to help others engineers or researcher to implement or develop this model for biofuels production plant.
This paper does not present an optimization method only show and discuss a model to optimize. However, references include the material for such work.
Index Terms— Biodiesel, Biofuel, Design, Optimize, Production, Risk.
I. INTRODUCTION
The productions of biofuels are growing around the world.. The biofuels are basically ethanol and biodiesel, for Otto and Diesel cycle engines respectively. The production of the ethanol was ever made and the professionals and techniques are prepared for this production in each country. But, the biodiesel is different. The production ways are easy to understand and to implement. But, the professional and techniques have not any experience with it in the major of the countries around the world (e.g. Argentina with a very important oily production has not a consistent history with the biofuels).
Several small enterprises are created each year to design and building biodiesel production plants. These enterprises offer their design with a poor documentation related mainly with the straight operation of the plant.
The risk control is reduced to design and to build with the experience on the other chemical plants, in the better of the cases in petrochemical plants.
In this paper a discuss about how model the risk for its optimization in biofuel plants is presented. The discuss is focused on the biofuel plants, but the bioethanol plants have similar remarks.
The original frame for the risk approach is extrapolate from the nuclear area, due to the extensive international experience
Manuscript received March 22, 2008. This work was supported in part by the National University of Cuyo as a part of the project Risk Optimization in Biofuels Production Plants and in part by the National University of Cuyo and YPF as a part of the Bioenergy Research Program 2007-2010.
J. E. Núñez Mc Leod and S. S. Rivera are with Engineering Faculty, National University of Cuyo, M5502KFA, Argentina (phone: +54 261 4135000 ext. 2135, fax: +54 261 4380120, emails: [email protected], [email protected]).
and historical data to support specific conclusions and due to the extensive experience of the authors of this work, now involved in the Bioenergy Research Program at Universidad Nacional de Cuyo, Argentina. This Program will design and build two biodiesel plants (one for research and the other to produce biodiesel for the University use) and one plant to produce bioethanol for the University use too. The program has other eight main projects related to energy crops, quality and logistic and ten secondary projects.
II.RISK
In Argentina the nuclear area regulation is based on risk. For obtain a license of nuclear power plant construction the contractor must demonstrate that the design accomplish with mandatory bound.
In nuclear power plants the risk is formed with the frequency of severe accident and the individual doses due to the accident and the end plant state. The worst case includes accidents with radiation on operator and public. This risk is inherently defined with the original design and increased with the maintenance and test tasks scheduled during the plant life.
In the last decades the risk point of view become in a relevant issue [1]-[5]. These references are important because show that the safety, reliability and availability are very complex concept. The risk is not more the failure of a single component. The risk is a complicated conjunction of several aspects, where none may be discard at the beginning.
For biofuel plants the risk may be calculated with the frequency of the accidents and the economical impact or deaths due to the accidents. The economical impact is better than deaths because may be included, easily, the accident without mortal consequences but with a great economical lost (e.g. long shutdown due to the accidents, replace of the valuable equipment, qualification of new personnel, etc.).
These installations are extremely simple, but the interaction with the operators and technicians must be taken into account. Those interactions are complex and not clear at the moment.
In all cases when the automation is high or the operational, maintenance and test tasks procedures are high or the personnel qualification is poor, the human interaction factors are relevant. Nowadays in Argentina the regulation in the biofuels field is regulated with the standard of the other chemical and oil industries without specific rules.
A Discussion About How to Model Biofuel
Plants for the Risk Optimization
Reactor
Settler
Washing
Purification
Evaporation or
Centrifugation
Neutralization
Distillation
Settler
Evaporation
Alcohol
Recovery
Mixer
Alcohol
Catalyser
Vegetable
Oil
Mineral
Acid
Fertilizing
Biodiesel
Glycerine
Secondary
stream
[image:2.595.80.522.90.393.2]Main stream
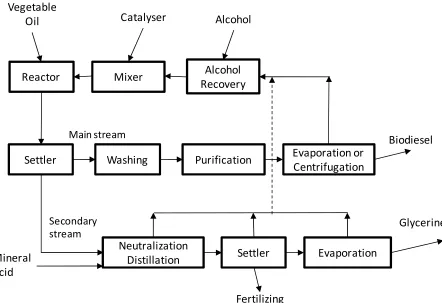
Fig. 1. Biodiesel production diagram
III. BIODIESEL PRODUCTION
The Fig. 1 shows a diagram of the biodiesel production. Biodiesel is the name of an alternative fuel, produced from renewable resources. It can be blended with petroleum diesel to create a biodiesel blend at any rate. It can be used in compression-ignition (diesel) engines with little or no modifications. It is biodegradable, nontoxic, and essentially free of sulfur and aromatics.
Biodiesel is made through a chemical process called transesterification whereby the glycerin is separated from the fat or vegetable oil. The process leaves behind two products: methyl esters (the chemical name for biodiesel) and glycerine [6]. The first step is preparing the vegetable oil for the transesterification. The preparing depends on the source of the oil. In the case of used oil (e.g. from restaurants) a previous separation of the water is a very important stage.
The second step is to blend alcohol and catalyser (in our case Potassium Hydroxide, KOH).
The third step is to mix vigorously the vegetable oil and blend of alcohol and catalyser. The reaction begins. The reaction is known like transesterification.
When the transesterification process is done a separation by differences of density is done.
The main stream is biodiesel. This stream must be washing with water. This washing allows to clear the biodiesel.
The final steps are the purification and evaporation. In our
case one plant has a distillation tower and the other a centrifuge. The secondary stream is rich in glycerine and alcohol. Both of them must be recovered. The first is reused in the process. The glycerine has economic value in chemical and cosmetic business.
Due to use KOH the neutralization with phosphoric acid produce a fertilizing.
The three main regions in Argentina are the North-West, the Central-West and Patagonia. All of them located between 25° and 40° south latitude. The central-west includes the provinces of Mendoza and San Juan. Both of them has an area comparable to the United Kingdom but with a 2.3 M inhabitants.
When use NaOH like catalyzer the neutralization will produce a salt that in regions with poor rains will increase the salinity level of the land. This issue is very important because the center-west Andean region in Argentina has a temperate, arid continental climate, with copious amounts of intense sunlight – some 320 days per year on average – and rainfall that rarely exceeds 200 to 254 mm per year. The salinity level is the most important trouble for the crops.
In this sense the technology developed during the Bioenergy Program is adequate to the region.
IV. MODELLING
To model the plant some assumptions must be done: 1) The system is constituted by m ideally independent
subsystems between them.
2) Each subsystem is constituted by n stages in series. 3) Each stage is constituted by xj+1 identical components
interconnected in parallel in the j stage. 4) Each component fault independently.
Consider the problem to diminish the production cost subject to no lineal frequency constraints.
∑∑
= =
× m
i n
j
ij kij x
c
1 1
min (1)
subject to ( )
(
1)
( )1 1
1
g m
h
a n
j x j
g q f d
e f
gh j <
−
×
∏ ∑
= =
+
, (2)
sup
inf x b
b ≤ j ≤ (3)
The variables are:
ckij ck component cost with l alternatives (k=1...l)
e initiate event
f(eg) annual frequency of the initiate event g
f(dg) boundary annual frequency for eg
qj unreliability for each component in the j stage
binf upper redundancy level
bsup lower redundancy level
agh array element. The element indicates the action of the subsystem h in the accidental sequence calculated Chern in 1992 [7] has proved that the previous reliability redundancy optimization problems is NP-hard.
Following to Lewis [8], the component failure probability in time t (standby time) and reparable in Tm constant interval could be calculated by:
[
] [
]
{
( /θ)µ ( /θ)µ}
1
Tm t Tms
q
=
−
l
−l
− (4)The variables are:
number of maintenance task until time t µ aging factor
θ component life characteristic
Equation (4) is used to quantify the component failure probability in the Fault Tree Analysis [9].
The Fault Trees modeling the combination of root causes, by mean by Boolean gates that could produce an undesired fault (named Top event). The root causes are named basic event. When associate a quantitative model to basic event, we can compute the failure probability of the Top event. When modeling a basic event we taken into account a failure rate model with aging, maintenance time interval and test time
interval.
When two or more basic event are related with manufacturer or design special common cause failures (CCF) model must be taken into account [10, 11]. The CCF may be defined as the impossibility of redunded components in a subsystem (or subsystems in a system) to perform their mission due to a single failure.
The CCF is the weakness of the redundant components, systems or structures.
Following [10] the CCF may be classified in known deterministic coupling (KDC), known stochastic coupling (KSC) and unknown stochastic coupling (USC). KDC has a cause and effect relationship between as the primary cause leading to secondary failures. KSC results from an environmental change that affects the probability of failure of the affected components and USC includes mathematical procedures for deducing physical effects that are shown in data or judged for redundant systems to fail with a higher frequency than that calculated under the assumption of independent systems.
KDC and KSC are relevant for our study because they can be related with the human interaction.
When some basic event is related to a human error a model using Human Event Trees (HET [12]) is needed.
The quantification of HET is a very difficult task. The human error rate for each task is not known at first. In nuclear area several deep studies were done and a database of human error rate for several activities is available. Some of these activities are similar to biofuel plants, but the culture is different in both of them. Then the extrapolation is not straight.
When the all basic human errors are quantified then the HET may be computed.
These HETs constitutes the KDC and KSC CCFs for our model in some cases.
When the system faults were modeled the next step is model the accidental sequences (AS) with Event Trees (ET) [13]. In AS several systems performing their functions successful or unsuccessful. The combination of different systems performing their functions right or wrong drives the AS to different plant states. These may be totally successful, partially successful or unsuccessful. Each state may be separate into simpler states and grouped according to some criteria.
A detailed explanation about a whole model applied to Nuclear Power Plant may be consulted in [14].
V.DISCUSSION
In the model the quality of the component and the qualification of the personnel is a very important issue.
The quality of the component impact on the risk straightly. At the first level, the attention must be paid on the redundancy levels [15]-[19] and how to diminish the failure of the system. But, the redundancy is not physically or economically possible in the all cases.
of maintenance and test tasks [20]-[27] and to equilibrate the intervention time with the operation time to obtain the higher production.
At a third level, the attention must be paid on aging effects on the components [1], [28]-[30]. These effects at first are only important when the age the installation is relevant, but when the quality of the component is not high the aging effects are relevant in a few years.
All previous items are present in our model. Their quantification is not easy but is not impossible nowadays. The data extrapolation from other areas may be straight. The important issue is the context. The context includes regulation, procedures, cultural issues and so on. Cultural issues may be associated with the country, the region or the business.
The best documented data comes from the areas so different to the biofuel plants (e.g. nuclear [12], [31-34], military [35] and petroleum areas [36]). The context in these cases may be so similar at a component level with similar functions and environment.
The normal studies on the production plants conclude here. A redundancy where is necessary due to availability or safety reasons are taken into account. The schedules of the maintenance and test tasks are minimized according to the availability and the safety objectives. Finally, the aging is not modeled normally.
That approaches may be done when the interaction with the personnel (operators and techniques) is limited and they are very qualified.
In Argentina and other countries the human factor is the most relevant aspect to taken into account to analyze the accidents in biofuel plants [37].
Any errors of operation, test, maintenance, or calibration can result in the unavailability of some system or component. This unavailability continues until someone discovers that the system or component is not operative, or until its condition causes other changes to the plant that lead to the discovery.
In addition, other system events can cause some component to be unavailable, and this unavailability may be displayed on some meter or result in some other visible change in the plant. Plant personnel then have the opportunity to note this change and take steps to restore the component to its normal operating condition.
The consideration of extraneous actions is also important. The person in a system may not only fail to do what he is supposed to do, but also fail to do it correctly. It is not possible to anticipate all undesirable extraneous human actions. The best approach is to identify those actions having the greatest potential for degrading system reliability and availability.
The human error may be classified in Error of Omission (EOO) and Error of Commission (EOC) [12].
In EOO one step is missed during a procedure (e.g. a specific step was not made implying that a part removed during the disassembly is not reinstalled).
When the written procedures are not available the oral instructions are the only guide. The experience shows, in several
fields, that a set of instructions loss with five items is done wrongly in 1 of 10 times. This happens with highly qualified technicians from nuclear area. The probability of human error is high.
In EOC one step is made different from procedure during the execution of the procedure (e.g. a worn bearing is not replaced or the lubricant is different to the specifications). The personnel understand that they are changing the procedures but not understand the real consequence of such action. The experience of the operators and the techniques is the only reason in those actions and the personnel does not understand that they made an erroneous action.
In biofuels field the procedures are simpler than in nuclear area but they are not written normally and the technicians are not high qualified in a specific way.
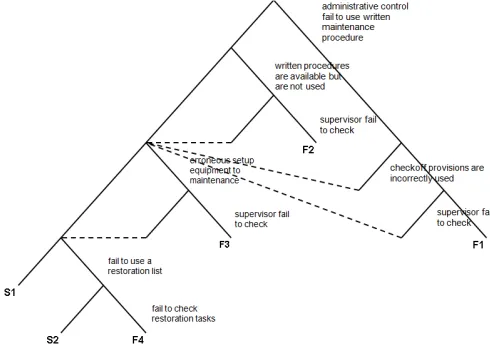
[image:4.595.304.549.319.491.2]A comparison from to similar maintenance task in NPP (with administrative control and written procedures) and BP (without administrative control and written procedures), in similar components shows graphically the previous considerations.
[image:4.595.305.548.480.650.2]Fig. 2. HET for generic maintenance task in NPP.
Fig. 3. HET for generic maintenance task in BP.
HET graphics must be read in the following way: the left branches are successful task or actions, the right branches are unsuccessful task or actions. The S and F capital letters indicate successful and unsuccessful paths. The dash lines indicate a recovery action.
human error of 0.001 and 0.1 respectively.
The previous paragraphs show the importance of the human error to accomplish with the risk objectives. In the BP the experience and the qualification of the professionals and techniques are not specific. The personnel come with their background from other industries or none.
In new plants with poor or without right written procedures the EOO and EOC may be extremely high. Then qs will be higher. Moreover, the availability will be down and the frequency of the undesired plant states will be high.
For all these reasons the EOOs and EOCs must be taken into account. The qs must incorporate the quantification of both. The EOO must be quantified using traditional methods of human error analysis but the EOC need an alternative approach.
A complete explanation about this alternative approach can see in [38].
Additionally the EOCs can transform in special cases of the CCF, when the action involve several subsystems independently each other or when the action involve a commons cause component.
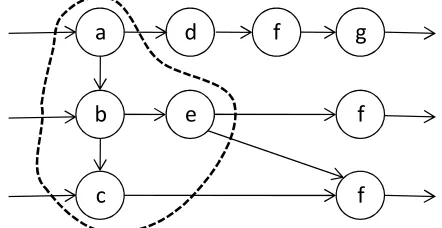
The Fig. 4 shows the traditional common cause failure understanding. Each component is represented with a circle with a letter. The arrows show the interactions into the process. The three components f constitutes a possible CCF for the system.
a
d
f
g
b
e
f
[image:5.595.321.531.205.323.2]c
f
Fig. 4. The components (f) are a CCF group by design
The buying of the three components f will require a special purchase order, requiring that the f components does not been chosen from the same production set to avoid possible root CCFs from production.
a
d
f
g
b
e
f
c
f
Fig. 5. The components a, b, c and e are a CCF group due to EOCs from the electric maintenance group.
The Fig. 5 shows that the EOCs configure an additional CCF group with the component a, b, c and e due to EOCs from the
electric maintenance group.
This CCF need to evaluate the possible EOCs and then training the personnel in those.
The Fig. 6 shows that the EOCs configure other CCF group with the component a, c and f due to EOCs from the electronic maintenance group.
This CCF will require the same action that the previous CCF. In general the last two cases are more relevant that the first case.
a
d
f
g
b
e
f
[image:5.595.61.272.396.511.2]c
f
Fig. 6. The components a, c and f are a CCF group due to EOCs from the electronic maintenance group
VI. CONCLUSIONS
To make a model to a biodiesel production plant is not a clear work. The discussion shows that the context is relevant in more than one aspect. The countries like Argentina without a consistent history in the biofuels production have not techniques and professionals prepared with their undergraduate or graduate education. The experience in the biofuels production will be obtained with the new installations. The models to diminish the risk of such installations must include that issue.
The models without the human error influence can not diminish or management the risk. The risk management will require the complete written procedures to operation and maintenance.
The existence of written procedures allow the qualification of the personnel with new information. This information can be audited, analyzed, corrected or even perfected. But, without this information the oral tradition is the worst way to implement a technology to new users.
ACKNOWLEDGMENT
The authors thanks to Eng. Pablo Gusberti and his personnel for your generous cooperation with this work.
REFERENCES
[1] J.C. Duthie, et al., “Risk-based approaches to ageing and maintenance management,” uclear Engineering and Design, 1998, 184: p. 27-38. [2] P. Kafka, “Probabilistic safety assessment: quantitative process to
balance design, manufacturing and operation for safety of plant structures and systems,” uclear Engineering and Design, 1996, 165: p. 333-350. [3] R.J. Rohrer and C.F. Nierode, “Simple method for risk assessment of
[image:5.595.55.276.581.695.2][4] M. Richner and S. Zimmermann. “Applications of simplified and of detailed PSA models,” Probabilistic Safety Assessment and Management, 1998, Springer Verlag.
[5] A.Muñoz, S. Martorell, and V. Serradell. “Numerical absolute & constrained optimization of maintenance based on risk and cost criteria using genetic algorithms,” European Safety and Reliability Conference. Vol. 3, 1997. Portugal: Pergamon, pp 1749-1756.
[6] The official site of the National Biodiesel Board (2007, Nov 04), Basic Resources, Available: http://www.biodiesel.org/.
[7] M. Chern, “On the computational complexity of reliability redundancy allocation in a series system,” Operations research letters, 1992, 11 (5), pp 309-315.
[8] Lewis, E., Introduction to Reliability Engineering, Wiley, New York, USA, 1987.
[9] W. Vesely, et al., Fault Tree Handbook, NUREG-0492, ed. NRC. 1981, Washington.
[10] R.R. Fullwood, Probabilistic Safety Assessment in the Chemical and uclear Industries, 2000, Boston, USA: Butterworth-Heinemann. [11] J. Barón,, J. Núñez Mc Leod, and S. Rivera “Human reliability analysis to
consider common cause failures for a research reactor during its design phase,” Probabilistic Safety Assessment and Management, Vol. 1, 2002, Ed. USA: Elsevier, pp 47-52
[12] A. Swain and H. Guttman, Handbook on Human Reliability Analysis with Emphasis on uclear Power Plant Applications. NUREG/CR-1278, ed. N.R. Commission. 1983, Washington, USA.
[13] Nuclear Regulatory Commission, PRA Procedures Guide: A guide to the performance of probabilistic risk assessments for nuclear power plants review. NUREG/CR 2300, ed. NRC. 1983, Washington: NRC. [14] J.E. Núñez Mc Leod, S.S. Rivera & J.H. Barón, “Optimizing Designs
based on Risk Approach,” Proceedings of the World Congress on Engineering 2007, 2, pp 1044-1049.
[15] R. Luus, “Optimization of System Reliability by a New Nonlinear Integer Programming Procedure,” IEEE Transactions on Reliability, 1975, 24(1): p. 14-16.
[16] A.K.Dhingra, “Optimal Apportionment of Reliability & Redundancy in Series Systems Under Multiple Objectives,” IEEE Transactions on Reliability, 1992, 41(4): p. 576-582.
[17] Z.Xu, W. Kuo, and H.-H. Lin, “Optimization limits in improving system reliability,” IEEE Transactions on Reliability, 1990. 39(1): p. 51-60. [18] D.W. Coitand A.E. Smith, “Reliability optimization of series-parallel
systems using a genetic algorithm,” IEEE Transactions on Reliability, 1996, 45(2): p. 254-260.
[19] M.Cantoni, M. Marseguerra, and E. Zio, “Genetic algorithms and Monte Carlo simulation for optimal plant design,” Reliability Engineering and System Safety, 2000(68): p. 29-38.
[20] Y.A. Choi and M.A. Feltus, “Application of reliability-centered maintenance to boiling water reactor emergency core cooling systems fault-tree analysis,” uclear Technology, 1995, 111: p. 115-121. [21] R.Dekker, “Applications of maintenance optimization models: a review
and analysis,” Reliability Engineering and System Safety, 1996(51): p. 229-240.
[22] M. Harunuzzaman and T. Aldemir, “Optimization of standby safety system maintenance schedules in nuclear power plants,” uclear Technology, 1996, 113: p. 354-367.
[23] C.M.F. Lapa, C.M.N.A. Pereira, and A.C.d.A. Mol, “Maximization of a nuclear system availability through maintenance scheduling optimization using a genetic algorithm,” uclear Engineering and Design, 2000, 196: p. 219-231.
[24] M. Marseguerra and E. Zio, “Optimizing maintenance and repair policies via a combination of genetic algorithms and Monte Carlo simulation,”
Reliability Engineering and System Safety, 2000(68): p. 69-83. [25] S. Martorell, et al., “Constrained optimization of test intervals using a
steady-state genetic algorithm,” Reliability Engineering and System Safety, 2000(67): p. 215-232.
[26] C.M. Rocco, et al., “Sensitivity and uncertainty analysis in optimization programs using an evolutionary approach: a maintenance application,”
Reliability Engineering and System Safety, 2000(67): p. 249-256. [27] Y.-T. Tsai, K.-S. Wang, and H.-Y. Teng, “Optimizing preventive
maintenance for mechanical components using genetic algorithms,”
Reliability Engineering and System Safety, 2001(74): p. 89-97. [28] R.D. Radulovich, W.E. Vesely, and T. Aldemir, “Aging effects on
time-dependent nuclear plant component unavailability: an investigation
of variations from static calculations,” uclear Technology, 1995, 112: p. 21-41.
[29] J. Crocker and U.D. Kumar, “Age-related maintenance versus reliability centred maintenance: a case study on aero-engines,” Reliability Engineering and System Safety, 2000(67): p. 113-118.
[30] Phillips, J.H., et al., “Incorporation of passive components aging into PRAs,” uclear Engineering and Design, 1993(142): p. 167-177. [31] Nuclear Regulatory Commission, WASH-1400, Reactor Safety Study: An
Assessment of Accident Risks in Commercial uclear Power Plants, NRC, USA, 1975
[32] NUREG/CR-1278, Handbook of Human Reliability Analysis with emphasis on uclear Power Plant Applications, NRC, USA, 1983. [33] IAEA-TECDOC 478, Component reliability data for use in Probabilistic
Safety Assessment, International Atomic Energy Agency, 1988. [34] IAEA-TECDOC 930, Generic Component Reliability Data for Research
Reactor PSA, International Atomic Energy Agency, 1977.
[35] MIL-HDBK-217, Reliability Prediction of Electronic Equipment, Military Handbook, USA, 1991.
[36] Sintef Technology, Offshore Reliability Data Handbook (OREDA), Sintef Technology, 4th edition, Norway, 2002.
[37] S.S. Rivera & J.E. Núñez Mc Leod, “Human errors in biofuels plant accidents,” Proceedings of the World Congress on Engineering 2008,
submitted for publication.