University of Warwick institutional repository:http://go.warwick.ac.uk/wrap
A Thesis Submitted for the Degree of PhD at the University of Warwick
http://go.warwick.ac.uk/wrap/74040
This thesis is made available online and is protected by original copyright. Please scroll down to view the document itself.
Model Based Analysis of Power Plant
Integrated with a Post Combustion
Carbon Capture Process
Thesis submitted in accordance with the requirements of the
University of Warwick for the degree of Doctor of Philosophy
in
Engineering School
By
Shen Guo
B.Eng., M.Phil.
Acknowledgements
First and foremost, I would like to express my sincere appreciation to my
supervisor, Professor Jihong Wang, for her support, guidance and patience
during my PhD study. Her scientific belief and her persistent efforts constitute
the essential part of the project, and her passion and knowledge in science
exceptionally inspire and enrich my growth as a student, a researcher and an
engineer want to be.
I would also be very grateful to Prof. Qirui Gao, Dr. Yali Xue and Dr. Jianlin
Wei for sharing their invaluable knowledge in the thermodynamics, control and
programing. Their important advices and critical comments gave me great
experiences throughout the work. Many thanks to Prof. Junfu Lv and Dr. Nan
Jia for the valuable experiences from both academia and industry.
It has been a great pleasure to work with and I also want to give my thanks to
my colleagues Dr. Xing Luo, Dr. Hao Sun, Mr. Yue Wang, Dr. Jacek Wojcik
and Dr. Mihai Draganescu in the research group. Many shining ideas in the
project has come from the cooperation and discussions with them.
Finally and mostly, I would like to give my special appreciates to my family and
my friends. None of this would have been possible without their encouragement,
Abstract
It is well recognised that there are two main options for reducing CO2 emissions
from fossil-fuelled power generation, namely, improvement of energy efficiency
and Carbon Capture and Storage (CCS). Efficient power generation leads to
lower fuel consumption, in turn, lower CO2 emission. Post combustion carbon
capture as it can be introduced to existing power plants by retrofitting to the plant,
which has attracted a lot of academic and industrial attention. A lot of research
activities have been carried out to study this capture technology but most of this
research focused on the steady state and the balance of the chemical reaction. As
the initial investigation on the power plant response with carbon capture is a very
important process before the plant is built, the dynamic simulation study can be
helpful to provide the necessary guidance for the design of the plant and control
system. This thesis reports the modelling and impact analysis of the supercritical
power plant with integration of post combustion carbon capture. The work
described in this thesis contributes to three aspects: model based dynamic study
of capture plant, model based flue gas estimation and the analysis of power plant
response caused by the carbon capture.
A dynamic modular model of the capture plant has been built based on the mass
and thermal balance for the study of plant dynamics. In this model, the
methodology based on the average enthalpy has been introduced to solve the
mixture under different conditions. A model based real-time estimation
algorithm for the steam required to satisfy the heat duty is also developed in the
work presented in this thesis.
An accurate flow rate of the flue gas can greatly support the study of the
absorption process simulation. An improved coal mill model which provides the
estimation of mill status in the normal milling progress is developed in this
project. The information provided by this coal mill model can further estimate
the flow rate of the flue gas. In addition to supporting the study of carbon capture
process, OPC based on-line implementation algorithms are proposed to enhance
the mill operation.
The heat duty to maintain the reaction temperature in the regeneration process is
satisfied by the steam from the power plant in this thesis. Several modification
plans have been tested in the simulator to study the different dynamic responses
to the power plant caused by the steam extraction, and an approach that is able
to meet the heat demand with least impact to the plant dynamics is proposed. As
coal fired power plants are obliged to balance their output in response to the
changing power demand from the grid, this thesis also provides a control strategy
to overcome this power penalty by adding the equivalent power to the power
C
ONTENTS
List of Figures ... IV
List of Tables ... VIII
Introduction ... 1
1.1 Background ... 1
1.2 Overview of Carbon Capture Technologies... 6
1.2.1 Pre combustion Capture ... 7
1.2.2 Carbon Captures on Conventional Power Generation ... 8
1.3 CO2 Storage and Utilization ... 10
1.4 Objectives of the project ... 12
1.5 Thesis outline ... 14
1.6 Publications during this period ... 15
Coal-fired Power Generation and Post Combustion Capture ... 16
2.1 Thermal power plant process ... 17
2.1.1 The generation process of coal-fired power plant ... 17
2.1.2 The Rankine cycle... 21
2.1.3 Supercritical power generation ... 26
2.2 Post combustion captures ... 28
2.2.1 Chemical absorption ... 28
2.2.2 Adsorption ... 31
2.2.3 Membrane based separations ... 33
2.3 Amine based capture process ... 34
2.4 Simulation of amine based capture ... 36
2.5 Summary ... 37
Power Plant Process Modelling and Simulation Study ... 39
3.1 First principle model ... 40
3.1.1 Model of the boiler systems ... 41
3.1.3 Flow rate calculations ... 44
3.1.4 Parameters identification ... 45
3.1.5 Limitations of the model ... 47
3.2 Fluidic network based simulator ... 48
3.2.1 Power plant process model of the simulator ... 50
3.2.2 Control system implemented in the simulator ... 60
3.3 Comparison of the two modelling approaches ... 62
3.4 Summary ... 65
Modelling Study of Power Plant Coal Milling Process ... 66
4.1 Classification of coal mills... 67
4.2 Working process of low speed tube-ball mill ... 72
4.3 Mathematical modelling of the coal mill ... 74
4.3.1 Input and output variables of the process... 75
4.3.2 Mass balance ... 76
4.3.3 Thermal balance ... 78
4.3.4 Mill product pressure ... 79
4.3.5 Average mill level indication ... 80
4.3.6 Improvement of the coal mill model ... 82
4.4 Identification of Unknown Model Parameters ... 83
4.5 Simulation results and model validation ... 86
4.6 On-line implementation of the coal mill model ... 89
4.6.1 On-line implementation based on direct measurements and microcontrollers ... 90
4.6.2 On-line implementation based on memory data sharing... 90
4.6.3 On-line implementation based on OPC network ... 92
4.6.4 Comparison of different on-line implementation approaches ... 94
4.7 Model update strategy and applications ... 96
4.8 Summary ... 99
The Modelling of The Post combustion Carbon Capture ... 101
5.1 The mathematical modelling of the chemical Absorption based on aqueous MEA solution ... 102
5.2 Mathematical description of the absorber ... 105
5.3 Mathematical description of the heat exchanger... 111
5.5 Mathematical description of the reboiler ... 127
5.6 Simulation Studies and model validation ... 132
5.6.1 Validation by the data of a pilot scale capture plant ... 133
5.6.2 Validation of the full scale simulation ... 136
5.7 Summary ... 139
Study of Impact on Power Plant Dynamics with Integration of Post Combustion Carbon Captures ... 140
6.1 Starting up the capture process ... 141
6.2 Implementation of the integration of the post combustion capture to the power plant in the simulator ... 145
6.2.1 Modelling of steam extraction process ... 146
6.2.2 Study of the impact of post combustion capture to the power plant dynamics ... 149
6.3 Power penalty recovery ... 152
6.3.1 Rapid power recovery ... 153
6.3.2 Precise power control ... 154
6.3.3 Impact of post combustion capture to the power plant dynamics with penalty recovery ... 156
6.4 Impact of steam pressure in high capture rate and further improvement of power plant ... 159
6.5 Dynamics of capture plant and power plant in switching capture loads .... 167
6.6 Summary ... 170
Conclusions and Suggested Future Research ... 172
7.1 Conclusions ... 173
7.2 Recommendations of future research ... 174
L
IST OF
F
IGURES
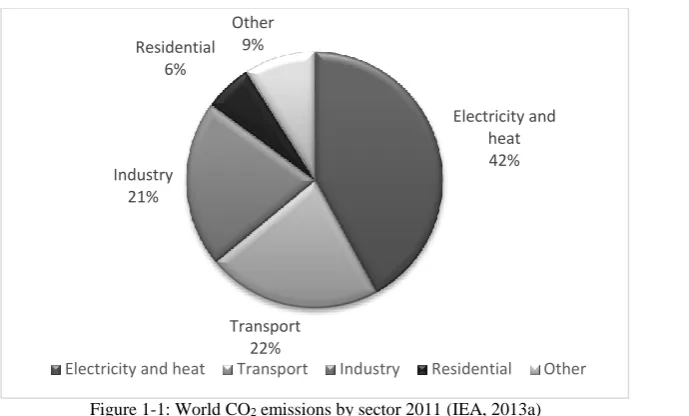
Figure 1-1: World CO2 emissions by sector 2011 (IEA, 2013a) ... 3
Figure 1-2: World electricity generation by source of energy (OECD, 2013) ... 4
Figure 1-3: Pre-combustion Capture ... 8
Figure 1-4: Oxy-fuel combustion ... 9
Figure 1-5: Post-combustion Capture ... 10
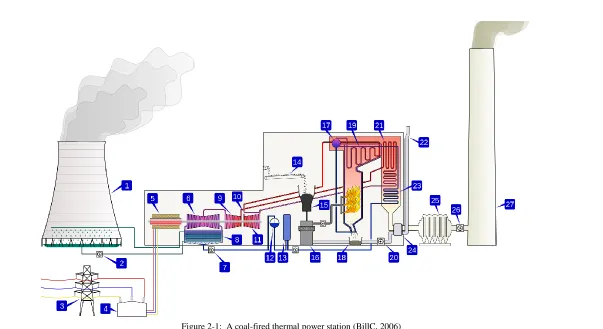
Figure 2-1: A coal-fired thermal power station (BillC, 2006) ... 20
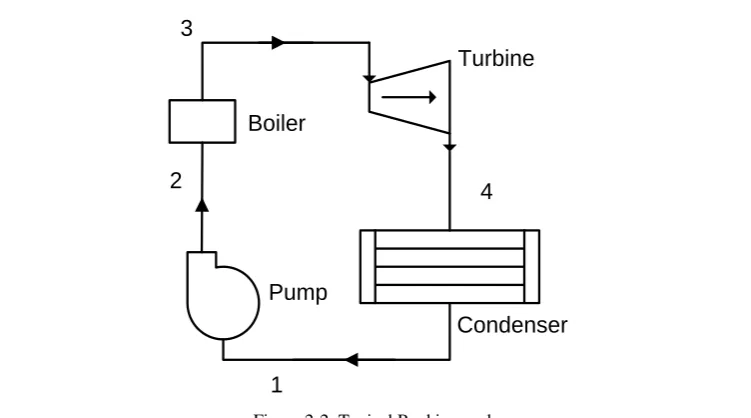
Figure 2-2: Typical Rankine cycle ... 22
Figure 2-3: T-s diagram of typical Rankine cycle, Rankine cycle with superheating, and Rankine cycle with reheating ... 23
Figure 2-4: T-s diagram of a Rankine cycle with superheating with different water-steam pressure ... 24
Figure 2-5: T-s diagram of an ideal supercritical power generation ... 25
Figure 2-6: Schematic diagram of a supercritical boiler ... 27
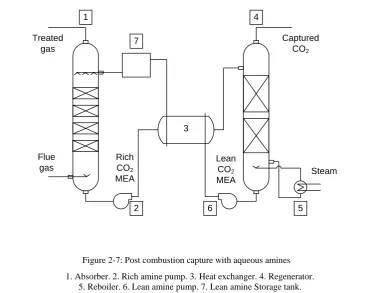
Figure 2-7: Post combustion capture with aqueous amines ... 34
Figure 3-1: Structure of the Simulator ... 50
Figure 3-2: Structure of the water-steam cycle ... 52
Figure 3-3: T-s diagram of an ideal supercritical power generation ... 58
Figure 3-4: Node with m inlet branches and n outlet branches ... 59
Figure 4-1: Beater wheel mill (left) and Hammer mill (right) ... 68
Figure 4-2: Medium speed mill (RWE Innogy Plc, 2000) ... 69
Figure 4-3: Low speed mill (EDF Energy) (Armitage, 1983) ... 71
Figure 4-5: Primary air flow in the Ball Mill Coal Pulverizer (Kukoski, 1992)
... 73
Figure 4-6: Classifier of the Ball Mill Coal Pulverizer (Kukoski, 1992) ... 74
Figure 4-7: Illustration of mass flow process ... 77
Figure 4-8: Thermal balance ... 79
Figure 4-9: Geometry description of mill level calculation ... 81
Figure 4-10: Outlet Differential Pressure (a) and Temperature (b) (measurement data, Group 1) ... 82
Figure 4-11: Schematic of the model’s coefficients identification ... 85
Figure 4-12: Model Validation on Data set 2 ... 87
Figure 4-13: Model Validation on Data set 3 ... 88
Figure 4-14: On-line implementation based on direct measurements and microcontrollers ... 90
Figure 4-15: On-line implementation based on memory data sharing ... 92
Figure 4-16: On-line implementation based on OPC network ... 93
Figure 4-17: Examples of bad data in the data spreadsheets from the PI system ... 95
Figure 4-18: Block diagram of the mill model update system ... 98
Figure 5-1: Post combustion carbon capture with aqueous amines ... 103
Figure 5-2: Post combustion capture with aqueous amines ... 113
Figure 6-2: Flow-net diagram of the Intermediate Pressure Turbine System 148
Figure 6-3: (a) Reboiler steam flow rate command; (b) Dynamic response of
power plant when post-combustion capture integration is implemented ... 151
Figure 6-4: Flow-net diagram of the Intermediate Pressure Turbine System 155
Figure 6-5: (a) flow rates of the capture plant for 3% capture rate on a
supercritical power plant with 500MW power output (30%, 0.29mol CO2/mol
MEA ); (b) Power demand and plant output ... 157
Figure 6-6: (a) flow rates of the capture plant for 10% capture rate on a
supercritical power plant with 500MW power output (40%, 0.16mol CO2/mol
MEA ) (b) Power demand and plant output ... 160
Figure 6-7: (a) Steam pressure at the exit of the intermediate pressure turbine in
the starting up of capture plant (with 30% 0.29 mol CO2/mol MEA solution); (b)
Steam pressure at the exit of the intermediate pressure turbine in the starting up
of capture plant (with 40% 0.16 mol CO2 /mol MEA solution) ... 161
Figure 6-8: Steam pressure of intermediate pressure turbine under different
steam extractions ... 161
Figure 6-9: (a) flow rates of the capture plant for 15% capture rate on a
supercritical power plant with 500MW power output (30%, 0.29mol/mol MEA );
(b) Steam pressure at the exit of the intermediate pressure turbine in the starting
up of capture plant ; (c) Power demand and plant output ... 163
Figure 6-10: (a) flow rates of the capture plant for 20% capture rate on a
(b) Steam pressure at the exit of the intermediate pressure turbine in the starting
up of capture plant; (c) Power demand and plant output ... 165
Figure 6-11: (a) flow rates of the capture plant for 30% capture rate on a
supercritical power plant with 500MW power output (30%, 0.29mol/mol MEA );
(b) Steam pressure at the exit of the intermediate pressure turbine in the starting
up of capture plant; (c) Power demand and plant output ... 166
Figure 6-12: (a) Flow rates of the capture plant for 30% capture rate on a
supercritical power plant with 500MW power output (30%, 0.29mol/mol MEA );
(b) Power demand and plant output ... 168
Figure 6-13: (a) flow rates of the capture plant for 30% capture rate on a
supercritical power plant with 500MW power output (30%, 0.29mol/mol MEA );
L
IST OF
T
ABLES
Table 1-1: World electricity generation by source of energy in Terawatt hours
(TWh) (OECD, 2013) ... 4
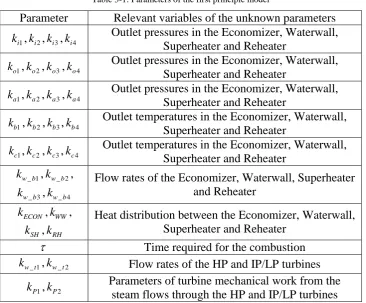
Table 3-1: Parameters of the first principle model ... 46
Table 4-1: List of coal mill input and output variables ... 76
Table 4-2: List of steady state mill data ... 84
Table 4-3: Identified mill parameters ... 86
Table 4-4: Absolute errors of validation ... 89
Table 5-1: Heat Capacity (J∙g-1∙K-1) of CO2-Loaded MEA Solutions at 25 ◦C (Weiland et al., 1997) ... 105
Table 5-2: Inputs and outputs of the absorber model ... 107
Table 5-3: Inputs and outputs of the absorber model ... 112
Table 5-4: Inputs and outputs of the regenerator model ... 117
Table 5-5: Inputs and outputs of the reboiler model ... 129
Table 5-6: Input data for validation ... 134
Table 5-7: Validation of the pilot scale simulation ... 135
Table 5-8: Plant configuration for validation ... 137
I
NTRODUCTION
1.1
B
ACKGROUNDOne of the most important environment challenges faced nowadays is Global
Warming. In December 2010, the UN Framework Convention on Climate
Change (UNFCCC) committed to control the temperature rise no more than 2°C
compared with the pre-industrial level and will work to achieve lower
temperature rise , less than 1.5°C in the near future to prevent the most severe
impacts of climate change (Symon, 2013). It has been widely accepted that the
greenhouse effect is one of the main causes for climate chang. Actually, the
greenhouse gases (GHG), in which Carbon Dioxide (CO2) is the main
constituent, are considered to have made the major contribution to the
temperature increase per decade from 1957 to 2007 was almost twice of that
from 1907 to 1957 (IPCC, 2007), while the CO2 concentration in the atmosphere
has increased by 19% between 1975 and 2012 (NOOA, 2013). Therefore, the
emission reduction is capable to play a very important role in control of climate
change.
The Department of Energy & Climate Change (DECC, UK) announced the goal
of “Reducing the UK’s greenhouse gas emissions by 80% by 2050” in 2008,
which has been clearly stated in the governments legislation document (Anon,
2008). In January 2014, the European Commission published their target to
reduce 80-95% of the GHG emissions based on the data in 1990 by 2050 to reach
the EU's long term climate objective (European Commission, 2014). The United
States has different policies in different states but the White House also showed
their ambitions in 2009 to reduce the GHG emission by more than 17% to 20%
of the 2005 level before 2020 and more than 83% GHG emissions reduction by
2050 (Anon, 2010).
Data from Carbon Dioxide Information Analysis Center (CDIAC) shows that
there were 29.888 million metric tons of CO2 generated in the year 2009 (CDIAC,
n.d.), in which more than 40% of world CO2 emission was from electricity and
heat generation, 22% was from transportation, 21% was other industrial
Targeting of transportation for world CO2 emission reduction is not enough as it
is technically not realistic to remove the CO2 from the exhaust of vehicles. As a
result, the potential to reduce the emission from power generation is becoming
increasingly important in achieving the CO2 reduction target.
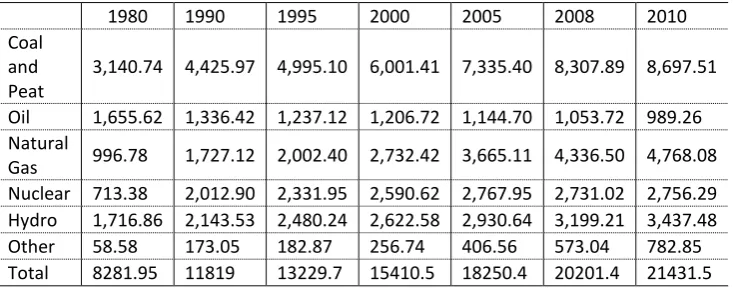
It is reported that the world electricity generation has been increased by over 80%
in the past decade as shown in Table 1.1 and Figure 1.2 (IEA, 2013b, OECD,
2013). The world net electricity demand is predicted to reach 39000 TWh by the
year 2040 from 21431.5 TWh in 2010 (EIA, 2013), which indicates an increase
of over 80% in the next 30 years. Table 1-1 shows that although many new
technologies have been developed and applied in power generation, the share of
the world electricity generated from fossil fuel has never dropped below 62%
(total) and 36% (coal) of the world electricity generation, and reached to 67%
[image:17.595.157.502.85.293.2](coal 40%) in Year 2010 (OECD, 2013).
Figure 1-1: World CO2 emissions by sector 2011 (IEA, 2013a)
Electricity and heat 42%
Transport 22% Industry
21% Residential
6%
Other 9%
Other generation technologies, such as nuclear, bio-mass and especially
renewables, can be helpful to reduce the CO2 emission. However replacing all
the conventional power generation with renewables is not a short term project.
Nuclear is a well-developed clean power generation technology but the safety
concerns has led to re-assessment of its deployment after the catastrophic failure
at the Fukushima Nuclear Power Plant (Glaser, 2011, Srinivasan and Gopi
Rethinaraj, 2013). There have already been some attempts of bio-mass/coal co-Figure 1-2: World electricity generation by source of energy (OECD, 2013)
0 5 000 10 000 15 000 20 000 25 000
Other Hydro Nuclear Natural Gas Oil Coal and Peat
Coal and Peat Oil Natural Gas Nuclear Hydro Other
Table 1-1: World electricity generation by source of energy in Terawatt hours (TWh) (OECD, 2013)
1980 1990 1995 2000 2005 2008 2010 Coal
and Peat
3,140.74 4,425.97 4,995.10 6,001.41 7,335.40 8,307.89 8,697.51 Oil 1,655.62 1,336.42 1,237.12 1,206.72 1,144.70 1,053.72 989.26 Natural
[image:18.595.134.502.362.508.2]
firing power generation but this technology is not convincing due to its
complications brought to power plants. Renewable energy is also unable to
replace all the coal-fired power generation unless they can have some milestone
progress (Wang, 2011). As coal has a relatively abundant reserve on the earth
(BP, 2014), it is currently occupying the biggest share of the electricity
generation market and this domination will continue for a long time. Without
removing coal fired power generation from the market, reducing or removing
the CO2 emission from coal-fired power plants becomes a more realistic way
forward. There are two main approaches referred to reducing CO2 emissions
associated with coal-fired power generation: to improve the generation
efficiency and to capture and deposit the CO2 to a safe place to prevent the
emission to the atmosphere.
Improving the efficiency of coal-fired power plants provides the possibility to
achieve the same power output by consuming less coal, in turn, resulting in less
emissions. A very established technology which is already implemented in many
countries is the supercritical power plant, which is able to increase the thermal
efficiency from 30%-38% of the normal subcritical power plant to 46% (Vocke,
2007).
Capturing the flue gas and transporting it into a sealed space can reduce CO2
emission dramatically. But CO2 only has a smaller proportion of the flue gas in
normal coal fired power stations and the majority is nitrogen from the primary
and secondary air. It makes no sense to waste the limited space to store the
Capture is to separate the waste CO2 from the flue gas generated in a coal-fired
power station so it can be stored into a hermetical area instead of being emitted
into the atmosphere. The complete process, including CO2 capture, compression,
transportation, storage, is summarized as Carbon Capture and Storage (CCS).
Although CCS is able to reduce the emission significantly and can achieve zero
emissions for coal-fired power generations, the implementation of the CO2
capture costs 10% - 40% of the energy generated no matter what kind of carbon
capture technology is employed in a power station (Beér, 2007). This energy
penalty usually includes the capture and compression of CO2, but excludes the
cost in the transportation and storage stage. So there is a debate between the
benefit and the energy penalty and no convincing conclusion is agreed (Rochon,
2008). The project is set to conduct the system modelling and simulation study
to investigate the feasible capture process and the impact on the power plant
dynamics brought onto by CCS. With consideration of the current advanced and
future technology, the more efficient supercritical power plant is chosen in the
study.
1.2
O
VERVIEW OFC
ARBONC
APTURET
ECHNOLOGIESData from IEA shows that four large-scale CCS projects have been completed
and have captured and stored 55Mt CO2 in total; nine more large-scale CCS
projects are expected to be finished by 2016, with an additional annual CO2
Carbon capture can be classified into three different technologies: Pre
combustion capture, oxy-fuel combustion and post combustion capture.
1.2.1
P
RE COMBUSTIONC
APTUREPre combustion capture refers to a technology that captures the CO2 before
combustion. This technology is not available to pulverized coal (PC) power
plants that comprise most of the existing capacity. This technology is ideally
designed for the integrated coal gasification combined cycle (IGCC) plants. In
the IGCC plants, coal is first mixed with water and blends into coal slurry. The
coal slurry is then pumped to the top of the gasifier vessel to react with liquid
oxygen which comes from the air separation unit in an incomplete combustion
reaction at 1300◦C and 60 bar (g) pressure. The product mixture is quenched at
the bottom section of the gasifier where slag is removed and cooled saturated
syngas leaves. The syngas, which is mainly a mixture of carbon monoxide and
hydrogen, is then piped to the water-gas shift (WGS) where the CO further reacts
with steam to form CO2 and more H2 (Higman and Van der Burgt, 2008, Herzog
et al., 2009, Karmarkar, 2006). The CO2 then can be removed while the H2 can
be used in gas turbines for power generation or can be used by fuel cells. The
Pre combustion capture will be a very attractive choice in future because it is
potentially cheaper than post combustion capture, and IGCC power plants with
pre combustion carbon capture also have higher efficiency than PC power plants.
However, the cost of building IGCC plants remains high and it has been reported
that the estimated generation cost per megawatt had been increased by 65% from
only very few IGCC plants are currently under construction or to be built in a
plan (IEA, 2012). Additionally the blades in the gas turbine need a very precise
manufacturing process that limits the development of the IGCC plant.
1.2.2
C
ARBONC
APTURES ONC
ONVENTIONALP
OWERG
ENERATIONIn a conventional coal-fired power plant, the coal is fed into the furnace by the
primary air where the combustion takes place. The flue gas, which is usually
refers to the exhaust gas from the combustion, normally consist of mostly
nitrogen (typically more than two thirds) derived from the combustion air,
carbon dioxide (CO2), water vapour and excess oxygen (also derived from the
combustion air) as well as some other gases like NOx and SOx. Both the
oxy-fuel combustion and the post combustion capture can be implemented to the
existing power plants.
Coal-fired power stations convert the chemical energy stored in coal to
electricity. The main reaction of this process is the combustion of coal with Steam
Gasification
Coal slurry
Air Separation Unit (ASU)
Oxygen
Air
Shift Coversion syngas
Acid gas removal
CO2
compression CO2
Combined
cycle Power
Air Nitrogen
Air
oxygen from the air, which produces the majority of the greenhouse gas. The
idea of oxy-fuel combustion capture is to use a high purity oxygen stream (≥95%)
instead of air. As the nitrogen has been removed prior to the combustion, the
CO2 capture can be greatly simplified because the exhaust flue gas stream is free
of nitrogen components. The problem of the oxy-fuel combustion capture is that
the air separation plant which is necessary to produce high purity oxygen stream
would consume 23% - 37% of the total plant output (Yang et al., 2008, Herzog
et al., 2009). Without the high efficiency of the IGCC plant, the oxy-fuel
combustion is less competitive compared with the other two technologies.
Post combustion capture represents the capture process of the carbon dioxide
from the flue gas of coal-fired power plants after combustion takes place. The
flue gas, which is originally leaving the power plant through the chimney, is now
introduced to the capture plant where most of the CO2 is separated from the flue
gas. This capture technology is the simplest and the oldest capture method of the
three. But there are three unique advantages that the pre combustion capture and
oxy-fuel combustion cannot achieve: The post combustion capture can be
Air Separation Unit (ASU)
Air
Nitrogen
Oxygen
Boiler
Steam Turbine
Steam
Power
Fuel Ash removal /
Cooler / condenser / de
SOx
CO2-rich Flue Gas
Purification / compression
Vent
CO2 Recycled Flue Gas
retrofitted to the existing PC power plants without substantial change in the
combustion technology. It also provides the flexibility to stop the capture process
without stopping the electricity generation. Finally it is the only candidate for
the gas-fired power plants, which shares a very high percentage in some
countries (Yang et al., 2008, Herzog et al., 2009). Due to these reasons, post
combustion is still very competitive that attracts much industrial and academic
attention.
1.3
CO
2S
TORAGE ANDU
TILIZATIONThe CO2 capture activity itself gives no contribution to the greenhouse emission
reduction, and to the contrary, capturing without storage increases the fuel cost
which means more CO2 is generated. Therefore the carbon dioxide must be
sequestered after it is captured from the power station. Various options have been
considered for CO2 permanent storage, including ocean carbon storage, mineral
carbon storage and geological carbon storage.
Boiler de NOx /
de SOx
Steam Turbine
Post combustion
capture
CO2
compression
Flue gas (N2
O2 H2O
some CO2)
CO2
Air
Steam
Flue gas
Power
Generation Capture
Fuel
Ocean carbon storage refers to the direct injection of CO2 into the deep sea. As
the carbon dioxide is soluble in water, the ocean is big enough to dissolve a large
amount of CO2. However it has been pointed out that ocean storage causes ocean
acidification which is harmful to the marine organisms near the injection point,
therefore it is not considered as a storage solution any longer (Green Facts, 2012).
The reaction of the CO2 and magnesium or calcium minerals that occurs
naturally to form stable carbonates over time. Those magnesium and calcium
minerals are very abundant and the reaction products are relatively stable
therefore the CO2 can be stored. But this natural progress is very long and the
storage speed is far away from the CCS needs. Mineral carbon storage is a
similar solution to this naturally occurring reaction but by increasing the pressure
and temperature, the process can be much faster (IPCC, 2005).
Geological carbon storage is currently the most encouraging method of carbon
storage. This storage refers to the injection of CO2 directly into underground
geological formations. This option is attractive because this method is not only
a storage technology. The integration of geologic CO2 storage and enhanced oil
recovery (EOR) using CO2 flooding (CO2-EOR) has been proved to be a very
good example of the CO2 utilization (Jiao et al., 2013). In fact, the first idea of
carbon capture is not about the concern of climate change, rather, it gained
attentions as a possible inexpensive source of CO2. In the early stage of the
petroleum industry, called ‘primary’ production phase, the production of oil is
naturally caused by the reservoir’s internal energy. However this primary
the internal energy fails to maintain the natural production and 80% to 90% more
oil is still “trapped” in the pore spaces of the rock therefore artificial drive is
necessary to continue the oil production (Melzer, 2012, Latin, 1980). Enhanced
oil recovery (EOR), especially CO2 flooding recovery (CO2-EOR) is already an
established technology as the artificial drive now. CO2 is injected into oil
reservoirs to increase the mobility of the oil and, thereby the productivity of the
reservoir (Herzog et al., 2009)
The Enhanced Gas Recovery (EGR), which is similarly to the EOR, has also
been demonstrated and reported as realistic recently to inject the CO2 into gas
reservoirs (Vandeweijer et al., 2011).
1.4
O
BJECTIVES OF THE PROJECTThe project is to study post combustion carbon capture integration with
supercritical power generation process. A number of post combustion capture
technologies have been studied, reviewed and compared. Amine based capture,
which refers to monoethanolamine in this thesis, is known as the most
established technology with a long development history in all post combustion
capture options. So the project will focus on the amine based capture technology
and its integration with power plant. Then the impact on power plant dynamics
will be investigated while the capture process is operating.
A simulator of the 600 MW supercritical power plant is available which is
Research Laboratory, which provides a simulation platform for study of the
whole system dynamics. In this project, retrofit of the post combustion capture
to the supercritical power plant is implemented onto the simulator and the
integrated power plant dynamics is analysed.
As the carbon dioxide is generated from the combustion of fuel with sufficient
oxygen in the furnace, the coal property including the flow rate is the key factor
that affects the flue gas and CO2 flow rate, which is important to the carbon
capture process. The first phase of the research work is to develop a detailed coal
mill model that can deliver a more reasonable feed coal calculation than the
transfer function implemented in the simulator. More accurate feed coal flow
rate leads to more accurate flue gas estimation.
Then the project moves to develop a mathematical model that can represent the
dynamic behaviour of the whole carbon capture process. With this model the
required heat from the power plant can be estimated.
Once the mathematical model for the capture process is established, necessary
changes to the simulators are implemented therefore the simulator can be
connected with the capture process. Further analysis based on the simulation of
the supercritical power plant with post combustion carbon capture is then carried
1.5
T
HESIS OUTLINEThe thesis is organized as seven chapters and the main contribution of the rest
chapters are:
Chapter 2 reviews the thermal power generation and the post combustion
capture technologies. The whole water-steam loop from the feed water to the
condensed water is introduced and the efficiency analysis of thermal plants based
on the temperature-entropy diagram is carried out to explain the reason that the
supercritical power plants a have higher generation efficiency than conventional
subcritical power plants. This chapter also introduces the existing post
combustion carbon capture approaches available and chemical absorption using
amine is studied in detail as it is the most established technology.
Chapter 3 gives an introduction of different simulation approaches to represent
the power plant used in this project. The first principle model and the simulator
based on the thermodynamics and the fluid network calculation are studied.
Discussion of the advantages and drawbacks of both approaches are carried out.
The simulator, which considers more inputs including the control system, is
chosen as it provides more information and flexibility.
Chapter 4 provides a dynamic mathematical model of the coal mill which is
very important to the fuel preparation process. Based on the working principle
and enhanced by the empirical equation, the coal mill model can give a more
the power station for self-adaptive parameter update and to provide extra
information to the site engineers.
Chapter 5 introduced the model development of the amine based post
combustion capture plant. Different components, including the absorber, heat
exchanger, regenerator and reboiler, are modelled and connected together. The
validation works based on published data of a pilot scale capture plant and based
on the scaled-up simulations from other literatures has been carried out showing
that the model is able to represent the capture process.
Chapter 6 developed a simplified start-up procedure for an idle capture plant by
which the steam demand to satisfy the heat duty can be estimated. Modification
of the power plant simulators will be introduced in this Chapter and steam from
the exit of intermediate pressure turbine is used to satisfy this steam demand.
The dynamic response of power plant caused by this steam extraction has been
analysed and pressure stabilization and penalty recovery strategy are proposed
to make sure the output of the power plant is able meet the power demand.
Finally in Chapter 7 the contributions and findings of the whole thesis are
concluded and the possible research directions are recommended at the end of
thesis.
1.6
P
UBLICATIONS DURING THIS PERIOD
C
OAL
-
FIRED
P
OWER
G
ENERATION
AND
P
OST
C
OMBUSTION
C
APTURE
This chapter covers the review of thermal power plant process and the main post
combustion capture technologies. In the first part of this chapter, the supercritical
coal-fired power generation process is described as the research conducted
technology which has a higher energy conversion efficiency compared with the
conventional subcritical power plants. Then the technologies for post
combustion carbon dioxide capture are reviewed and the amine based capture
technology is described in detail as it has been identified as the most feasible
2.1
T
HERMAL POWER PLANT PROCESSThermal power plants generate electricity from high temperature high pressure
steam. Classified by the prime power source of the generation there are different
types of thermal power plants, including fossil fuel, nuclear, geothermal, solar
power generations. Fossil fuel power generations, especially coal-fired, has the
biggest share in the electricity generation market now.
2.1.1
T
HE GENERATION PROCESS OF COAL-
FIRED POWER PLANTIn a coal-fired power plant, coal is first transported to the plant site and stored in
bunkers in the plant. It is delivered to the coal mill by the feeder when needed
where it is crushed into powder by hundreds of steel balls in a spinning drum
(for tube-ball mills). The pulverized coal is brought out by the primary air and is
conveyed to the boiler.
As the coal enters the boiler with the primary air, it ignites with the secondary
air, releasing energy and generating intense heat to change the high quantity feed
water into steam in the waterwall. Ash as one of the by-products in the
combustion process drops to the bottom of the furnace and is taken away by an
ash hopper while the flue gas, which can be at a temperature of over 1000 ◦C
rises up, passing the superheater, and reheater where the thermal energy
generated in the ignition process vaporizes the feed water into main steam. The
energy in the main steam is then transformed to mechanical energy via the
last heat exchanger that is located at the end of the furnace, which is used to
preheat the feed water. (Rayaprolu, 2009).
The feed water comes from the deaerator that is used to remove the dissolved air
in the feed water to reduce the corrosiveness. The purified water is then pumped
to a high pressure and enters the boiler after a series of preheating heat
exchangers (Ben-Abdennour et al., 1993). The water firstly flows through the
economizer where it is further heated by the flue gas. Traditionally, the high
pressure water flows to a drum and then flows down to the furnace waterwall,
where the water is heated by the flame and part of the water vaporized to steam.
The steam water mixture is sent to the steam drum again where the steam is
separated from the unvaporized water and flows to the superheater for further
heating. The water is mixed with the feed water and flows back to the furnace
waterwall again for vaporization (Abdennour, 2000).
As the water is removed from the drum, the steam that enters the superheater is
either saturated or superheated steam. The temperature and pressure of the steam
are further elevated by the three-stage superheater at the top of the furnace (Cold
Superheater, Platen Superheater and Hot Superheater) to a higher temperature
and then piped to the first stage of the turbine system which transforms the
thermal energy into mechanical torque.
The turbine system consists of four steam turbines that share the same shaft, high
pressure turbine (HP), intermediate pressure turbine (IP) and two low pressure
to generate electricity by the mechanical power provided by the turbine. The
main steam from the superheater enters the high pressure steam turbine,
releasing its pressure and thermal energy to the turbine and returns to the boiler
as soon as it leaves the HP turbine. After being heated again in the two stage
reheater (Cold Reheater and Hot Reheater) by the flue gas, the reheated steam is
then introduced to the intermediate and low pressure turbines to generate
mechanical power. Usually the exhausts of the low pressure turbines are pumped
to negative relative pressure as the low pressure enables the steam temperature
to drop to under 100◦C without condensing, which is the saturated temperature
at 1 atm, therefore that more thermal energy can be obtained.
Figure 2-1: A coal-fired thermal power station (BillC, 2006)
The steam that leaves from the LP turbine is condensed into water in the
condenser and is sent back to the deaerator after a series of heat exchangers to
increase the water temperature, which is ready to be pumped for the next steam
water cycle. Figure 2.1 gives a brief view of the coal-fired power generation.
2.1.2
T
HER
ANKINE CYCLEThe Rankine cycle, which is a model that is used to predict the performance of
steam-operated heat engines, represents the ideal thermodynamic cycle of the
process in which heat is converted to mechanical energy. Figure 2.2 shows a
typical Rankine cycle that includes a pump, a boiler and a turbine connected with
a load and a condenser.
In a complete Rankine cycle, water is pumped into high pressure (1-2), and
enters a boiler where it is heated to the saturation temperature and evaporated
into vapour (2-3). The steam then passes through a turbine to drive a generator
for generating power; the steam condenses into water in the last stage of this
progress (3-4). The whole cycle ends at the condenser where the wet steam is
finally condensed into water (4-1) which is then sent back to the pump as feed
water for the next cycle.
The temperature - entropy diagram (T-s diagram) is usually introduced to
visualize the changes of temperature and specific entropy in a thermodynamic
process. A vertical line in the T-s diagram stands for an isentropic process
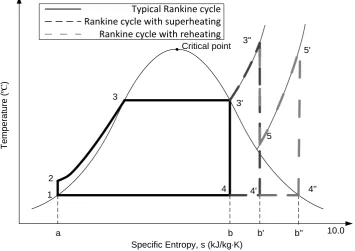
Figure 2.3 is an example of T-s diagram for different Rankine cycles. In the T-s
diagram of a water-steam system, the saturated curve is divided into two parts
by the critical point: the curve on the left represents the saturated water, while
the one on the other side is the saturated steam. The area below the saturation
curve in the figure is the two phase region in which the substance is a mixture of
liquid water and gaseous steam. The vaporization line (for example 3-3’) which
is shown as the horizontal line between the saturation curve, is related to the
value of the specific latent heat of vaporization and the percentage of the position
from the left side can represent how ‘wet’ the steam is. It also can be seen from
the T-s diagram that when the pressure is high enough so that the saturation
temperature reaches the critical point, there is not any heat of vaporization and
the water can be vaporized into steam directly without any two phase region.
This state of substance, which doesn’t have a clear boundary between the liquid
and gaseous phase, is defined as supercritical fluid.
Turbine
Pump
Condenser Boiler
1 2
3
[image:36.595.130.506.479.688.2]4
It can be observed in the typical Rankine cycle (Figure 2.3, 1-2-3-3’-4-1) that
part of the saturated steam will become condensed during expansion, which
means the steam flow becomes wet. As too much moisture is harmful to the
blade of the steam turbine, the wet steam, which is the two phase region below
the saturation curve in the figure, should be controlled below 10% in the turbine.
The easiest way is superheating the saturated steam (Figure 2.3,
1-2-3-3’-3”-4’-1). By heating the saturated steam into superheated steam, the expansion process
can be shifted from 3’-4’ to 3’’-4’’ in the figure so a drier steam can be produced
in the turbine.
The thermal efficiency can be defined as the ratio of the work introduced to the
turbine to the total heat transferred to the working fluid. In Figure 2.3, the
efficiency of the typical Rankine cycle can be described as:
10.0
T
e
m
p
e
ra
tu
re
(
ºC
)
Specific Entropy, s (kJ/kg∙K) 1
2
3
4 3'
4' 5
5'
Typical Rankine cycle Rankine cycle with superheating Rankine cycle with reheating
4''
a b b' b''
[image:37.595.140.496.384.635.2]3'' Critical point
1 2 3 3 4 1
2 3 3
turb
total
W area
Q area a b a
’ ’
It can be observed that the ratio of the work to the turbine (area 3’-3”-4’-4) and
the heat transferred from the boiler (area 3’-3”-b’-b) in the superheating section
is higher than that of a typical Rankine cycle, therefore it can be concluded that
the superheating can also contribute to the cycle efficiency of the generation.
Figure 2.3 also shows a fact that if the temperature of the superheated steam is
high enough, the steam after expansion in the turbine can be completely dry.
This would be the ideal case in the power generation and the temperature is not
achievable at this moment due to technical difficulties. The reheating of the
steam after the HP turbine can help avoid excessive moisture in the LP turbine
by increasing the steam temperature. However it has been pointed out that the
T
e
m
p
e
ra
tu
re
(
ºC
)
Specific Entropy, s (kJ/kg∙K) 1
2
3
4' 3'
4 5
a b' b
[image:38.595.139.496.445.698.2]2'
contribution of reheating on the cycle efficiency is very little because the average
temperature at which heat is supplied is not greatly changed.
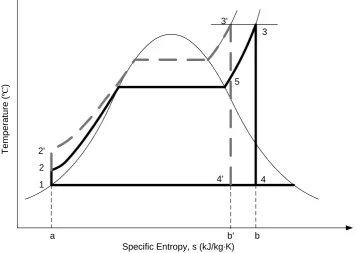
Apart from the steam temperature, the pressure can also influence the cycle
efficiency of a Rankine cycle. Figure 2.4 is a temperature-entropy diagram that
represents the Rankine cycle with different water-steam pressures.
With the same superheating temperature and the exhaust pressure, increasing the
water-steam pressure reshapes the cycle from 1-2-3-4-1 to 1-2’-3’-4’-1 in Figure
2.4. The network delivered to the turbine is increased by area 2-2’-3’-5 and
decreased by area 5-3-4-4’, which almost remains the same level. But the heat
rejected decreases by area 4’-4-b-b’ hence the overall efficiency of the Rankine
cycle is increased. (Wylen et al., 1994, Borgnakke and Sonntag, 2009) 400
350 300 250 200 150 100 50
1.0 2.0 3.0 4.0 5.0 6.0 7.0 8.0 9.0 10.0
T
em
pe
ra
tu
re
(
ºC
)
Specific Entropy, s (kJ/kg∙K) 1
2
3
4 5
6 600
550 500 450
[image:39.595.138.497.266.497.2]Critical point
2.1.3
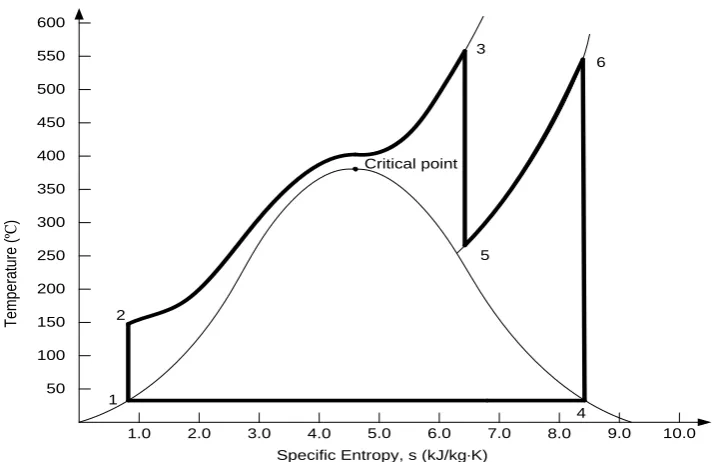
S
UPERCRITICAL POWER GENERATIONAs increasing the pressure can increase the cycle efficiency, the supercritical
fluid can be employed for power generation for higher efficiency. Supercritical
boilers were first developed in U.S. in the 1950s and with the development of
materials and components, which are better fitted nowadays to withstand high
pressure/temperature conditions, they are today reliable and operationally
flexible. It has been reported that there are more than 400 supercritical power
plants in operation worldwide in the year 2002 (Mitsui Babcock Ltd). The
traditional power plant that works under the critical point can be denoted
subcritical power, referring to the supercritical power plant using supercritical
fluid.
Compared with the efficiency between 33% and 39% in the subcritical power
plants, the power generation with supercritical fluid has a higher efficiency of
up to 48%, which is around 10% above the traditional plants (Vocke, 2007,
Wang and Guo, 2009). Figure 2.5 gives an example of the cycle of the ideal
Coal & Primary Air
COLD SHT
COLD SHT
ECON COLD
RHT
COLD RHT
COLD RHT HOT
RHT HOT
SHT PLT
SHT
Deaerator
Deaerator Water Tank
Furnace Waterwall
Secondary Air
Secondary Air Coal & Primary Air
Feedwater
Feedwater
Feedwater
Feedwater Pump
HP Turbine
Separator
To Water Tank
IP Turbine
IP Turbine
LP Turbine
Generator
Condenser
ECON Main Steam
[image:41.842.101.750.141.440.2]Coal mill
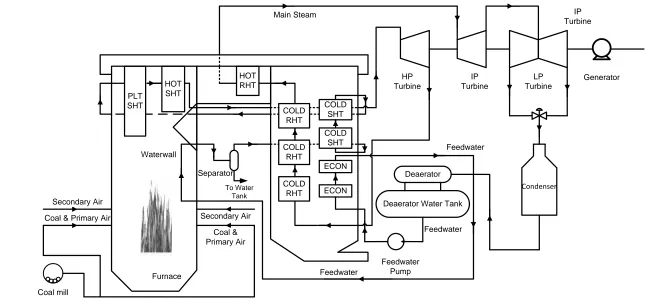
As there is not a clear boundary of water and steam in the supercritical fluid, one
significant design difference of the supercritical power plant, which is also called
once-through boiler, is that the flow at the exit of the waterwall is dry steam in
supercritical condition therefore the drum is not necessary in the generation in
most of the conditions (Chaibakhsh et al., 2007, Ghaffari et al., 2007). Therefore
the drum is removed from the boiler and steam water separators, which are
smaller than conventional drums in a drum boiler of the same rated power, are
employed to act as the drum’s role in the consideration of low load generation
especially the system is starting up (Eitelberg and Boje, 2004).
2.2
P
OST COMBUSTION CAPTURESThere are over 100 post combustion CO2 capture technologies (Herzog et al.,
2009). All the capture process use one or more of the following technologies:
absorbent, adsorbent and membrane, converts CO2 to a mineral or employs
bio-fixation. Chemical absorption based on aqueous amines is a major capture
method in industry. As the objective of this study is to investigate the dynamical
responses or interactions of the capture process engagement to a power plant,
making the best choice of technologies is not the project focus. In this project
the most mature capture technology based on aqueous amines absorption is
chosen (Bhown and Freeman, 2011).
2.2.1
C
HEMICAL ABSORPTIONAbsorption refers to an absorption/regeneration process to capture the CO2 from
example amine solution. This technology has been commercialized and used in
natural gas industry for 60 around years and is regarded as the most mature
process. (Bhown and Freeman, 2011, Yang et al., 2008)
The basic principle of the absorption capture is that the carbon dioxide can react
with the absorbent at flue gas temperature (40 – 60 ◦C) while the other species
of the flue gas (majorly nitrogen) cannot. The “tower” in which the flue gas
contacts the absorbent is called “Absorber”. Most of the CO2 can be removed
from the flue gas in this absorber so the emission of “greenhouse gas” can be
controlled. Rich CO2 solvent is then directed to a “regeneration unit”, which is
called stripper or regenerator, where it is heated to reverse the reaction and to
release CO2 by increasing the temperature (Wang et al., 2011, Bhown and
Freeman, 2011, Herzog et al., 2009). The CO2 released from the solvent is then
captured and compressed so it is ready for transportation. The lean CO2 solvent
with high temperature can be used to heat the rich CO2 solvent from absorber in
a cross heat exchanger and then pumped back to the absorber. For efficiency
concern, most absorption units use the steam from the generation unit to heat the
solution in the stripper.
2.2.1.1
Amine
Amines are water soluble organic chemicals that contain reactive nitrogen atoms
(Herzog et al., April 2009). Monoethanolamine (MEA, C2H7NO) is studied and
used for post combustion captures in various pilot plants (Notz et al., 2012,
adopted in the majority of post combustion capture process simulations (Ahn et
al., 2013, Mores et al., 2011, Zhang et al., 2011, Liu et al., 1999, Harun et al.,
2012). Rapid, selective and reversible reaction with CO2, relatively non-volatile
and inexpensive makes MEA a very good absorbent. However there are also
problems including its corrosiveness, the degradation by SO2, NO2, and oxygen
which exist in the flue gas, and it also requires considerable amounts of thermal
energy for the CO2 regeneration (Fauth et al., 2005, Resnik et al., 2004, Yeh et
al., 2005). The main reaction mechanism for the MEA-CO2 absorption can be
described as the following formation and the maximum load capacity for the
MEA is 0.5 mol CO2 /mol amine based on the formation.
2 4 2 2 4 2 4 3
2 2 (C Η ΟΗ)ΝΗ (C Η ΟΗ)ΗΝCΟΟ (C Η ΟΗ)ΝΗ
CΟ
Mixed amines are also used in amine capture and reported to be a possible
solution. By mixing MEA with either diethanolamine (DEA, C4H11NO2) or
methyldiethanolamine (MDEA, CH3N(C2H4OH)2), the regeneration cost can be
reduced but the circulation rate will also drop (Yang et al., 2008, Herzog et al.,
2009). Results from Idem et al. (2006) shows that huge heat duty reduction can
be achieved by using a mixed MEA/MDEA solution instead of a single MEA
solution in an industrial environment of a CO2 capture plant, although this
benefit depends on whether the chemical stability of the solvent can be
maintained (Yang et al., 2008, Idem et al., 2006).
As monoethanolamine is the majority of post combustion capture process
the CO2 contact and amine capture in this report will be referred to the
monoethanolamine.
2.2.1.2
Ammonia
Ammonia based solution, which uses aqueous ammonia as absorbent, can offer
an absorption process with more stable solvents and less corrosive. The CO2
uptake capacity of ammonia is estimated to be 3 times that of the MEA (Yeh and
Bai, 1999). Furthermore the steam required for regeneration is 1/3 of that
required with MEA (Resnik et al., 2004). It is estimated that the operating and
capital costs with ammonia are 15%-20% less than with MEA (Yang et al., 2008).
Two of the major by-products (ammonium sulphate and ammonium nitrate)
from this process are fertilizers while the other one, ammonium bicarbonate, can
be thermally decomposed to recycle ammonium (Yang et al., 2008, Herzog et
al., 2009).
Ammonia based capture has a very significant disadvantage, that is, ammonia is
a toxic gas. Therefore the capture and recycle of toxic ammonia vapour
generated in the regenerator is a necessity. In the meantime this technology is
not yet ready because research activities are still being carried out to reduce
evaporative ammonia losses without sacrificing CO2 capture performance
(Herzog et al., 2009).
2.2.2
A
DSORPTIONActivated carbon and charcoal are two effective sorbents due to their high
However because of their low CO2/N2 selectivity, they can only be fitted in
carbon capture processes with high purity of CO2, for example the pre
combustion carbon capture, and it is obvious that post combustion capture is not
that kind of process. Zeolites, which offer 10 – 15 times greater CO2/N2
selectivity than activated carbon or charcoal, are able to separate the CO2 from
the flue gas so it can be used in post combustion capture. However, their CO2
capacity is much lower, which is only about 1/3 to 1/2 of the carbonaceous
materials, and the performance will be worse when water vapour exists. As a
result, the solid sorbents are not good candidates unless they have greater
selectivity, capacity and less sensitivity to steam (Konduru et al., 2007).
The chemical adsorption process is based on the alkali metal based sorbents.
The development of adsorption processes for CO2 capture would require
development of both adsorbent materials and corresponding processes.
Limestone (CaCO3), which has a long history in industrial processes, releases
CO2 at 850 ◦C and transforms to calcium oxide (CaO), which recombines with
CO2 at 650 ◦C. This CaO/CaCO3 system has a high CO2 capture capacity, but the
high temperature to release CO2 makes it far from the possible capture solution.
Porous sodium based sorbents work efficiently at the same temperature range as
amines, but with considerably lower CO2 capture capacity, while Lithium based
sorbents can offer greater CO2 capture capacity but work at a temperature of
Other investigations of alternative sophisticated materials as solid sorbent are
still in early stages and none of the new materials have advanced beyond the lab
scale testing. In addition, it is still not clear whether they are sufficient to offset
their high cost (Herzog et al., April 2009).
2.2.3
M
EMBRANE BASED SEPARATIONSAnother important capture technology uses a “filter” to separate the CO2, called
membrane based separation. The membranes are made up of thin polymeric
films, and the different permeation rates of the film, caused by the relative size
of the permeating molecules or the solubility coefficients in the membrane
material, result the selectivity of the polymeric membrane.
The membrane separation is well established and mature technology, but there
are problems unsolved. As the membrane permeation is generally pressure
driven, the main challenge comparing to the absorption or adsorption capture is
the low pressure of flue gas (Herzog et al., April 2009). In addition, the CO2/N2
selectivity of most available polymers is between 50 and 60, which is far away
from 200 competing with amine based absorption.
There are a large number of other exploratory approaches under development,
including ionic liquid (Chen et al., 2013, Zhao et al., 2012, Ramdin et al., 2012)
and biological mechanisms like carbonic anhydrase (Bond et al., 2001, Dilmore
et al., 2009) and microalgae systems (Cheng et al., 2006, Skjånes et al., 2007).
2.3
A
MINE BASED CAPTURE PROCESSA standard design of the capture plant that has been widely accepted is composed
of at least four parts: the absorber, the regenerator, the reboiler and the main heat
exchanger, to complete the whole capture and regeneration process. Figure 2.7
is a process diagram for post combustion capture with aqueous amines.
The absorber is the vessel where the flue gas from the coal-fired power plant
contacts with the amine based sorbent. They are basically mass transfer columns
with either tray or packed columns to improve the contact between gases and
liquid in a chemical process, however, most of them are the structured packed
tower systems with lower pressure drop and larger interfacial area (Mersmann
et al., 2011, Rao, 2002, Seader and Henley, 2006)
1
Treated gas
Captured CO2
Steam Lean
CO2
MEA Rich
CO2
MEA Flue
gas
2
4
5 6
[image:48.595.129.509.235.528.2]3 7
Figure 2-7: Post combustion capture with aqueous amines
The flue gas enters the absorber from the bottom when the amine flows in from
the top of the absorber by a liquid distributer. Most of the carbon dioxide is
selected from the flue gas and dissolved into the solvent by chemical reaction in
the packing area. Other gases come from the flue which exits the absorber from
the top and is emitted to atmosphere. The CO2 rich amine exits the bottom of the
absorber and is pumped to the heat exchanger.
The Shell and Tube Heat Exchanger is the best established heat exchanger that
dominates over 90% of the industry market (Chisholm, 1980). This heat
exchanger design consists of a large pressure vessel with a bundle of tubes inside,
and two fluids flow through the shell and the tube separately. Heat transfer takes
place from the hotter fluid to the colder through the tube walls so that waste heat
can be recovered. In the post combustion capture, the rich CO2 amine enters the
tube side of the heat exchanger and is heated by the hot lean CO2 amine from the
bottom of the reboiler. The preheated amine is directed to the top of the
regenerator for the CO2 regeneration.
The regenerator and the reboiler are interconnected facilities that are used to
provide enough heat for the amine to reach the temperature needed in the reverse
reaction of absorption. The regenerator is a packed tower system similar to the
absorber while the reboiler is basically a heat exchanger. Low pressure but high
temperature steam extracted from the turbine of the power plant is introduced to
the reboiler to vaporize the water that acts as solvent in the amine solution. The
steam ascends to the regenerator while the rest of the amine solution drops down
Rich CO2 amine is heated to around 120 ◦C by the direct contact with the
vaporized steam in the regenerator, releasing CO2 that leaves the column from
the top for compression and storage, and flows to the reboiler afterwards.
2.4
S
IMULATION OF AMINE BASED CAPTURESimulation can be very helpful at the early stage development of a technology in
design and optimization prior to the implementation. A number of simulation
works on the amine based capture has been carried out. These research activities
are typically based on the mass transfer in columns with two simulation methods:
the equilibrium stage simulation or the rate based simulation (Browne, 2014).
An equilibrium stage is an ideal condition that the equilibrium of liquid and gas
phase is established. Having a series of equilibrium stages makes it possible to
simulate the steady state of a separation process. The equilibrium stage
modelling is good at non-reactive systems due to its simplicity. However the
equilibrium can be hardly achieved in the reactive capture therefore this method
is difficult to represent the actual process (Browne, 2014). Several research
works based on the equilibrium stage model have been published by
Afkhamipour and Mofarahi (2013) and Mores et al. (2011).
The rate based simulation which considers the reaction rates, the electrolytes as
well as the mass and heat transfer provides a much greater complexity than the
equilibrium stage simulation. The two-film theory of mass transfer is one of the
equilibrium is attained only at the gas-liquid interface and a thin gas film and a
thin liquid film distribute on each side of the interface (Kvamsdal et al., 2009,
Pacheco and Rochelle, 1998, Al-Baghli et al., 2001). Focusing on the film
around the interface of the liquid and gas, this approach divided the phase into
four parts based on the position: bulk gas, gas film, liquid film and bulk liquid.
This feature makes the more detailed calculations achievable, including the
electrolyte, the mass transfer resistances, and the reaction kinetics (Kenig et al.,
2001).
Both the equilibrium stage simulation and the rate based simulation are steady
state simulations to optimise the operation at the nominal condition where the
flow rate and content of the flow gas are constant. The post combustion capture
is moving to the industrial implementation, the dynamic study is of increasing
importance. However, few research activities reported are focusing on the
dynamic simulations at this moment. Lawal et al. (2009) and Kvamsdal et al.
(2009) worked on the absorber, Ziaii et al. (2009) studied the regeneration
column and Harun et al. (2012) developed a model for the whole system.
2.5
S
UMMARYThe coal-fired power generation and the post combustion capture technologies
have been reviewed in this chapter. The generation process of the typical
coal-fired power plant is introduced in the first part of this chapter. From the basic
analysis of thermodynamics it is proved that supercritical plants have a higher
result, the supercritical generation unit will be used as a reference plant for the
research on the dynamic response of the post combustion capture.
The second part of this chapter introduces several different post combustion
capture technologies available today. Chemical absorption based on aqueous
amines, as the major capture method in industry, is focused in this thesis. A
detailed study of the capture process has been studied and different modelling