warwick.ac.uk/lib-publications
Original citation:
Hockham, Carinna, Piel, Frédéric B., Gupta, Sunetra and Penman, Bridget S.. (2015)
Understanding the contrasting spatial haplotype patterns of malaria-protective β-globin
polymorphisms. Infection, Genetics and Evolution , 36 . pp. 174-183.
Permanent WRAP URL:
http://wrap.warwick.ac.uk/81625
Copyright and reuse:
The Warwick Research Archive Portal (WRAP) makes this work of researchers of the
University of Warwick available open access under the following conditions.
This article is made available under the Creative Commons Attribution 4.0 International
license (CC BY 4.0) and may be reused according to the conditions of the license. For more
details see:
http://creativecommons.org/licenses/by/4.0/
A note on versions:
The version presented in WRAP is the published version, or, version of record, and may be
cited as it appears here.
Understanding the contrasting spatial haplotype patterns of
malaria-protective
β
-globin polymorphisms
Carinna Hockham, Frédéric B. Piel, Sunetra Gupta, Bridget S. Penman
⁎
Department of Zoology, University of Oxford, Oxford, UK
a b s t r a c t
a r t i c l e i n f o
Article history:
Received 6 July 2015
Received in revised form 4 September 2015 Accepted 6 September 2015
Available online 21 September 2015
Keywords:
Sickle-cell
β-Thalassaemia Malaria
Haplotype distribution Gene conversion
The malaria-protectiveβ-globin polymorphisms, sickle-cell (βS) andβ0-thalassaemia, are canonical examples of
human adaptation to infectious disease. Occurring on distinct genetic backgrounds, they vary markedly in their patterns of linked genetic variation at the population level, suggesting different evolutionary histories.βSis
asso-ciated withfive classical restriction fragment length polymorphism haplotypes that exhibit remarkable specifi c-ity in their geographical distributions; by contrast,β0-thalassaemia mutations are found on haplotypes whose
distributions overlap considerably. Here, we explore why these two polymorphisms display contrasting spatial haplotypic distributions, despite having malaria as a common selective pressure. We present a meta-population genetic model, incorporating individual-based processes, which tracks the evolution ofβ-globin poly-morphisms on different haplotypic backgrounds. Our simulations reveal that, depending on the rate of mutation, a large population size and/or high population growth rate are required for both theβS- and theβ0
-thalassaemia-like patterns. However, whilst theβS-like pattern is more likely when population subdivision is high, migration
low and long-distance migration absent, the opposite is true forβ0-thalassaemia. Including gene conversion has
little effect on the overall probability of each pattern; however, when inter-haplotypefitness variation exists, gene conversion is more likely to have contributed to the diversity of haplotypes actually present in the popula-tion. Ourfindings highlight how the contrasting spatial haplotype patterns exhibited byβSandβ0-thalassaemia
may provide important indications as to the evolution of these adaptive alleles and the demographic history of the populations in which they have evolved.
© 2015 The Authors. Published by Elsevier B.V. This is an open access article under the CC BY license (http://creativecommons.org/licenses/by/4.0/).
1. Introduction
The mutations responsible for sickle-cell disease andβ0-thalassaemia
represent two unequivocal examples of balanced polymorphisms in the human genome (Hedrick, 2011; Roberts and Williams, 2003; Taylor et al., 2012). Occurring at high frequencies in many populations indige-nous to malaria-endemic regions, these variants are subject to balancing selection due to their protective effect againstPlasmodium falciparummalaria in the heterozygous state (Allison, 1964; Hill et al., 1991; Piel et al., 2010; Rockett et al., 2014; Williams et al., 2005a). Homozygotes suffer severe blood disorders (sickle-cell anaemia and
β0
-thalassaemia major, respectively), which, without access to diagno-sis and treatment, are often lethal in the first few years of life (Weatherall et al., 2006).
In population genetics theory, it is generally accepted that natural selection results in one of two population genetic outcomes: (i) ahard
selective sweep, in which a single adaptive allele sweeps rapidly through a population, resulting in the predominance of a single haplotype asso-ciated with the adaptive allele in the population, and (ii) asoft selective sweep, whereby ancestral genetic variation around the adaptive site is partially preserved owing to multiple alleles at the site being selected (Messer and Petrov, 2013; Ralph and Coop, 2010). In the context of this study, we define a haplotype as a set of DNA variations, including the variant under selection, that are located on a single chromosome and, by virtue of their close proximity, are inherited together. Both the sickle-cell mutation (βS) andβ0-thalassaemia appear atfirst glance to
be examples of soft selective sweeps. The former, which always results from the replacement of glutamic acid by valine at position 6 of the
β-globin gene (HBBc. 20 A→T; p. Glu6-Val), is associated withfive
“classical”restriction fragment length polymorphism (RFLP) haplotypes (Table 1) (Flint et al., 1998). The latter results from any mutation that completely eliminates the production of protein from theβ-globin gene (Weatherall and Clegg, 2001a). One-hundred andfifty-eight such mutations are currently reported ( http://www.globin.bx.psu.edu/cgi-bin/hbvar/query_vars3, accessed 29 June 2015;Patrinos et al., 2004), and many of these can be found on more than one genetic background (Table 2) (Trabuchet et al., 1991; Weatherall and Clegg, 2001a).
⁎ Corresponding author.
E-mail addresses:[email protected](C. Hockham),
[email protected](F.B. Piel),[email protected](S. Gupta),
[email protected](B.S. Penman).
http://dx.doi.org/10.1016/j.meegid.2015.09.018
1567-1348/© 2015 The Authors. Published by Elsevier B.V. This is an open access article under the CC BY license (http://creativecommons.org/licenses/by/4.0/).
Contents lists available atScienceDirect
Infection, Genetics and Evolution
The precise spatial patterns exhibited byβS- andβ0-thalassaemia
hap-lotypes are markedly different. ForβS, current data suggests that thefive
classical haplotypes predominantly occupy geographically separate re-gions within Sub-Saharan Africa, the Middle East and India (Table 1) (Bitoungui et al., 2015; Flint et al., 1998; Gabriel and Przybylski, 2010; Hanchard et al., 2007). By contrast, whilstβ0
-thalassaemia mutations are mostly geographically specific on a cross-continental scale (Cao and Galanello, 2010; Weatherall and Clegg, 2001a) multiple variants can be found in the Mediterranean, the Middle East, and Asia, respectively, with their distributions considerably overlapping (Table 2). Furthermore, for eachβ0-thalassaemia variant, various associated genetic backgrounds
typically coexist in the population (Table 2). To illustrate, the β0
-thalassaemia mutation IVS-I-1 G→A is found on haplotypes V and II in Sicily (Schilirò et al., 1995), and haplotypes I, III, V, IX and A in Algeria (Bennani et al., 1994; Rouabhi et al., 1988). Similarly, the cd39 C→T mu-tation is associated with haplotypes I and II in Sicily, Sardinia and Corsica (Falchi et al., 2005), haplotypes I, II and IX in mainland Italy, and haplo-types I, II and B in Algeria (Lemsaddek et al., 2004).
In the case ofβ0
-thalassaemia, different causal mutations have clear-ly arisen independentclear-ly, whilst the occurrence of identical mutations on separate haplotypes is generally ascribed to gene conversion (Chen et al., 2007). ForβS, however, it is commonly believed that each of the five classicalβS-associated haplotypes representsfive independent
occurrences of the same A→ T mutation in codon 6 ofβ-globin (Chebloune et al., 1988; Kulozik et al., 1986; Pagnier et al., 1984; Trabuchet et al., 1991; Wainscoat et al., 1983). Yet, as suggested by Livingstone in the 1980s, a singleβSmutation, and its subsequent
trans-fer onto diftrans-ferent haplotypic backgrounds by gene conversion, could also have generated the same present-dayβS
pattern (Flint et al., 1998; Livingstone, 1989a, 1989b).
The different patterns exhibited byβ0-thalassaemia andβS
muta-tions thus offer a unique opportunity to make a direct comparison be-tween different sub-types of soft selective sweep in humans. Here, we identify the demographic and genetic processes that are more likely to give rise to either a sickle-cell-like or aβ0-thalassaemia-like spatial
dis-tribution of haplotypes. Within the context of our spatial framework, we also specifically address the role that recurrent mutation and gene conversion may have played in the evolution of these polymorphisms.
2. Methods
2.1. The model
We simulated a meta-population ofNediploid individuals, divided intoddemes of equal size and arranged in a network with a varying de-gree of randomness in its migration connection structure, controlled by parameterc(seePenman et al., 2012; Watts and Strogatz, 1998; and Supplementary material for further details). Every generation,Ne in-creases by a percentage drawn from a uniform distribution between zero and a maximum possible population growth rate ofg% (see Supple-mentary material). Any increase in total population size is spread equal-ly across all demes.
The meta-population is initially monomorphic for the wild-type (βA
) allele. In every generationt, within each deme, afinite set of potential off-spring reaching reproductive age is generated according to (i) allele fre-quencies in that deme in generationt-1, (ii) mutation and/or gene conversion events (mutation rate =μevents per chromosome per gener-ation; gene conversion rate =revents per chromosome per generation), and (iii) the relativefitness of each genotype, consistent with a standard model of the behaviour of a variant under selection. Following the gener-ation of this offspring pool, individuals are randomly sampled without re-placement to create the next generation ofNe
dreproductively active adults
in that deme. This step introduces the possibility of genetic drift. Thefinal event to take place per generation is inter-demic geneflow. Each gene
flow event involves the migration ofm% of a deme's population to one of its linked partner demes in the migration network, andvice versa (fur-ther details in the Supplementary material).
2.2. Key model features/assumptions
2.2.1. Mutation and gene conversion
We are only interested in the haplotypic diversity ofβS- or
β0-thalassaemia-bearing chromosomes. The model thus records only
(i) mutation in theβA →βX
direction, and (ii) the transfer of aβX
[image:3.595.44.560.93.341.2]allele onto a new haplotypic background by gene conversion in βAβX Table 1
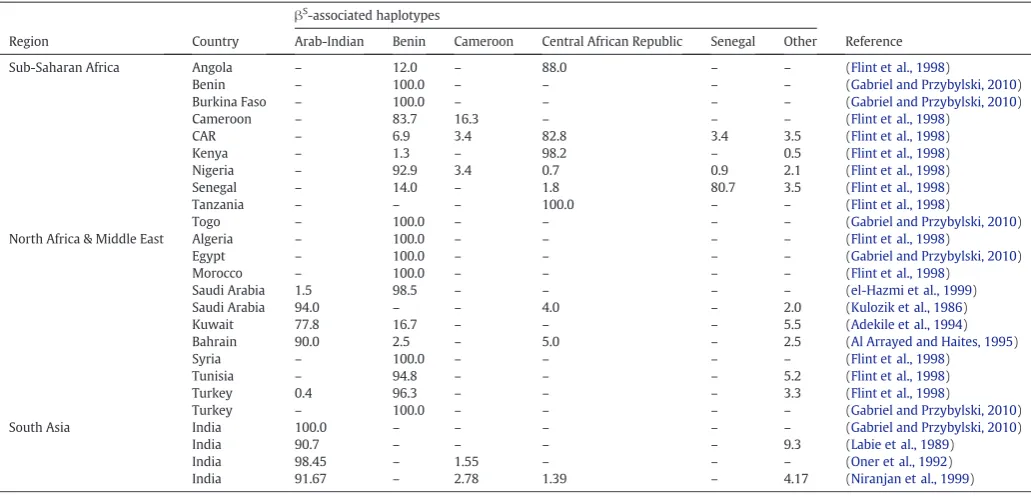
Distribution ofβShaplotypes. Relative percentages (%) of classicalβS-associated haplotypes in different geographical regions. ClassicalβShaplotypes are defined as those which cannot be
accounted for by reciprocal recombination. Countries whereβS
has largely been imported, for example parts of Western Europe and North America, are not included as these do not reflect the early evolutionary history of the variant.
βS
-associated haplotypes
Region Country Arab-Indian Benin Cameroon Central African Republic Senegal Other Reference Sub-Saharan Africa Angola – 12.0 – 88.0 – – (Flint et al., 1998)
Benin – 100.0 – – – – (Gabriel and Przybylski, 2010)
Burkina Faso – 100.0 – – – – (Gabriel and Przybylski, 2010)
Cameroon – 83.7 16.3 – – – (Flint et al., 1998)
CAR – 6.9 3.4 82.8 3.4 3.5 (Flint et al., 1998)
Kenya – 1.3 – 98.2 – 0.5 (Flint et al., 1998)
Nigeria – 92.9 3.4 0.7 0.9 2.1 (Flint et al., 1998) Senegal – 14.0 – 1.8 80.7 3.5 (Flint et al., 1998)
Tanzania – – – 100.0 – – (Flint et al., 1998)
Togo – 100.0 – – – – (Gabriel and Przybylski, 2010)
North Africa & Middle East Algeria – 100.0 – – – – (Flint et al., 1998)
Egypt – 100.0 – – – – (Gabriel and Przybylski, 2010)
Morocco – 100.0 – – – – (Flint et al., 1998)
Saudi Arabia 1.5 98.5 – – – – (el-Hazmi et al., 1999) Saudi Arabia 94.0 – – 4.0 – 2.0 (Kulozik et al., 1986)
Kuwait 77.8 16.7 – – – 5.5 (Adekile et al., 1994)
Bahrain 90.0 2.5 – 5.0 – 2.5 (Al Arrayed and Haites, 1995)
Syria – 100.0 – – – – (Flint et al., 1998)
Tunisia – 94.8 – – – 5.2 (Flint et al., 1998)
Turkey 0.4 96.3 – – – 3.3 (Flint et al., 1998)
Turkey – 100.0 – – – – (Gabriel and Przybylski, 2010)
South Asia India 100.0 – – – – – (Gabriel and Przybylski, 2010)
India 90.7 – – – – 9.3 (Labie et al., 1989)
India 98.45 – 1.55 – – – (Oner et al., 1992)
heterozygotes. All mutation and gene conversion rates throughout the manuscript refer to the rates at which these particular processes happen.
Every time a newβXmutation arises, or an existingβXmutation
un-dergoes gene conversion, the resulting allele is assigned a unique nu-merical identifier representing a novel haplotypic background. This approach assumes a high diversity of pre-existingβ-globin haplotypic backgrounds, such that each time a rare mutational or gene conversion event occurs it involves a different genetic background to any of those of previous mutations/gene conversions.
It is important to note that, given that the different haplotypes in our model can only arise through mutation or gene conversion (not reciprocal recombination), they are intended as proxies forβS- and
β0
-thalassaemia haplotypes whose occurrence cannot be accounted for by simple reciprocal recombination (e.g.the classicalβShaplotypes;
Table 1) (Flint et al., 1998).
2.2.2. Assignment offitness values
Full details of the assignment offitness values are provided in the Supplementary material. Crucially, thefittest individuals in our simulated populations were alwaysβAβXheterozygotes, who were
as-sumed to experience malaria protection. Throughout all of our simula-tions,βXβXhomozygotes were assigned afitness of zero and thus
were not represented in the potential offspring pool.
It is possible for the haplotypic background of mutations to affect the course ofβ0-thalassaemia major or sickle-cell anaemia (Loggetto, 2013;
Weatherall and Clegg, 2001b). However, given the absence, historically, of any effective treatment for these disorders, we have assumed that all individuals homozygous forβS- orβ0-thalassaemia are likely to have
been at a considerable disadvantage relative to the wild-type, regardless of whether they possessed a mutation with an ameliorating haplotypic background. We do, however, address the possibility of inter-haplotype
fitness variation in our simulations, by incorporating a range,f, of possi-ble heterozygotefitnesses into our model.
2.3. Parameterisation and implementation
The model was parameterised using value ranges taken from the literature where available (see Supplementary material). Of particular note, we tested four different allelic mutation rates: (i) 10−8events per chromosome per generation,i.e.the average nucleotide substitution rate for the human genome (Ellegren et al., 2003; Xue et al., 2009), although this yielded very few instances of a soft selective sweep in our simulations; (ii) 10−7events per chromosome per generation, accounting for the possibility of a higher-than-average rate of mutation in theβ-globin cluster (Nachman and Crowell, 2000), and (iii) 5 × 10⁻⁷ events per chromosome per generation and (iv) 10−6events per chro-mosome per generation to reflect the fact that hundreds of different types of mutations can give rise to aβ0-thalassaemia allele. Results
from the latter three mutation rates are presented here. The ranges of values used for all other parameters are described in the Supplementary material.
All simulations shown were run for 500 generations. Assuming a generation time of 15–25 years for humans, this represents 7.5 to 12.5 thousand years of malaria selection, which is consistent with estimates for how longP. falciparumis likely to have been a significant cause of human mortality (Carter and Mendis, 2002). Adaptive alleles arose sto-chastically throughout each simulation. We chose to analyse a“ snap-shot” of the genetic variation in the meta-population at the 500 generation time point.
[image:4.595.36.553.84.384.2]Simulations were implemented in Matlab R2012b and performed on a 1728 2.0 GHz cores super-computer part of the Advanced Research Computing (ARC) resources at the University of Oxford.
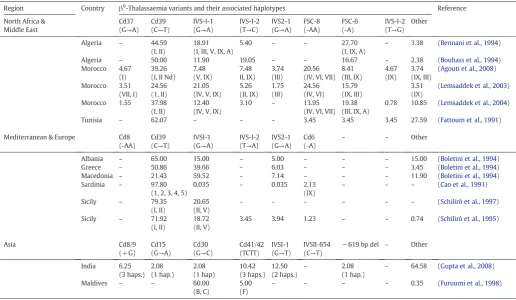
Table 2
Distribution ofβ0-thalassaemia variants and their associated haplotypes. Relative percentages (%) ofβ0-thalassaemia variants and their associated haplotypes in a range of geographical
settings. Haplotype definitions are given inAntonarakis et al. (1985).
Region Country β0
-Thalassaemia variants and their associated haplotypes Reference North Africa &
Middle East
Cd37 (G→A)
Cd39 (C→T)
IVS-I-1 (G→A)
IVS-I-2 (T→C)
IVS2-1 (G→A)
FSC-8 (-AA)
FSC-6 (-A)
IVS-I-2 (T→G)
Other
Algeria – 44.59 (I, II)
18.91 (I, III, V, IX, A)
5.40 – – 27.70
(I, IX, A)
– 3.38 (Bennani et al., 1994)
Algeria – 50.00 11.90 19.05 – – 16.67 – 2.38 (Bouhass et al., 1994) Morocco 4.67
(I)
39.26 (I, II Nd)
7.48 (V, IX) 7.48 II, IX) 3.74 (III) 20.56 (IV, VI, VII)
8.41 (III, IX) 4.67 (IX) 3.74 (IX, III)
(Agouti et al., 2008)
Morocco 3.51 (VII, I)
24.56 (1, II)
21.05 (IV, V, IX)
5.26 (II, IX) 1.75 (III) 24.56 (IV, VI) 15.79 (IX, III) 3.51 (IX)
(Lemsaddek et al., 2003)
Morocco 1.55 37.98 (I, II)
12.40 (IV, V, IX)
3.10 – 13.95 (IV, VI, VII)
19.38 (III, IX, A)
0.78 10.85 (Lemsaddek et al., 2004)
Tunisia – 62.07 – – – 3.45 3.45 3.45 27.59 (Fattoum et al., 1991)
Mediterranean & Europe Cd8 (-AA)
Cd39 (C→T)
IVSI-1 (G→A)
IVS-I-2 (T→A)
IVS2-1 (G→A)
Cd6 (-A)
– – Other
Albania – 65.00 15.00 – 5.00 – – – 15.00 (Boletini et al., 1994) Greece – 50.86 39.66 – 6.03 – – – 3.45 (Boletini et al., 1994) Macedonia – 21.43 59.52 – 7.14 – – – 11.90 (Boletini et al., 1994) Sardinia – 97.80
(1, 2, 3, 4, 5)
0.035 – 0.035 2.13 (IX)
– – – (Cao et al., 1991)
Sicily – 79.35 (I, II)
20.65 (II, V)
– – – – – – (Schilirò et al., 1997)
Sicily – 71.92 (I, II)
18.72 (II, V)
3.45 3.94 1.23 – – 0.74 (Schilirò et al., 1995)
Asia Cd8/9
(+G) Cd15 (G→A)
Cd30 (G→C)
Cd41/42 (TCTT)
IVSI-1 (G→T)
IVSII-654 (C→T)
−619 bp del – Other
India 6.25 (3 haps.) 2.08 (1 hap.) 2.08 (1 hap) 10.42 (3 haps.) 12.50 (2 haps.) – 2.08 (1 hap.)
– 64.58 (Gupta et al., 2008)
Maldives – – 60.00 (B, C)
5.00 (F)
2.4. Classification of evolutionary outcomes
Based on the reported geographical distributions of βS and
β0-thalassaemia variants and their associated haplotypes (Tables 1
and 2), we defined a series of possible outcomes within our model (seeSections 2.4.1–2.4.3). In particular, we sought to distinguish a spa-tially tessellating,‘patchwork’βS-like pattern and an overlappingβ0
-thalassaemia-like pattern.
2.4.1.β0-Thalassaemia-like, or overlapping, outcome (Fig.1A)
For this outcome, at least two differentβX-associated haplotypes
must be present in the meta-population. In addition, there must be sufficient overlap in the distributions of the different haplotypes that no more than 20% of demes contain aβX-associated haplotype that
accounts for≥95% of the haplotypic variation in the deme. We refer to such haplotypes henceforth as“dominating”haplotypes.
When assessing the geographical patterns exhibited by
β0-thalassaemia (Table 2), we counted two differentβ0-thalassaemia
mutations occurring on the same genetic background as two different haplotypes: considering theβ0-thalassaemia mutation itself to be part
of the haplotypic diversity in the population.
2.4.2.βS-type, or patchwork, outcome (Fig.1B)
For this outcome, there must be at least two different dominating
βX
-associated haplotypes in the whole meta-population, and at least 50% of the demes must contain a dominating βX-associated
[image:5.595.62.545.221.660.2]haplotype.
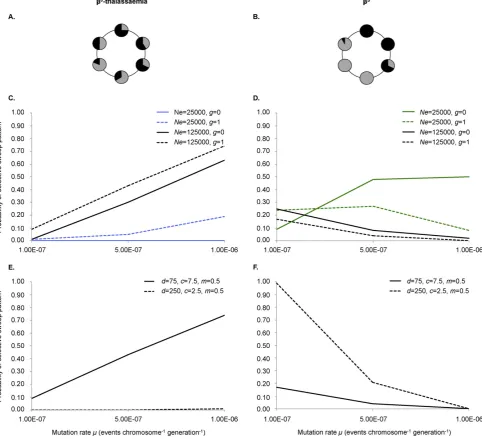
Fig. 1.Theβ0
-thalassaemia- andβS
-like patterns and the effect of mutation rate on their likelihood of emergence. Panels (A) and (B) are abstract representations of theβ0
-thalassaemia-andβS
-like outcomes of our model; each circle represents a deme, whilst different colours indicate whether one (one colour) or multiple (more than one colour)βX
haplotypes are present in a deme. In panels (C–F), each graph indicates how the probability of observing aβ0
-thalassaemia- (panels C and E) orβS
-like (panels D and F) pattern changes with changing mutation rate (x-axis). Each data point is based on 100 simulations. In panels (C) and (D), the different lines represent different demographic scenarios relating to population size and growth rate. Other parameters werefixed as follows:d= 75, c = 7.5,m= 0.5,f= 0 andr= 10−6. Increasing the mutation rate increases the probability of theβ0-thalassaemia-like pattern, provided
that initial total population size,Ne,and/or population growth rate,g,is sufficiently high. In panels (E) and (F), the different lines represent (i) a relatively weak population structure (fewer demes, more random connections: solid line), or (ii) a relatively strong population structure (many demes, fewer random connections: dashed line). Other parameter values werefixed as follows:Ne= 125,000,G= 1%,f= 0 andr= 10−6
. The effect of mutation rate on the probability of observing theβ0
-thalassaemia-like pattern is strongest for a weak population structure, whilst the opposite is true for theβS
2.4.3. Other possible model outcomes
Other possible model outcomes include: (i) no malaria-protective variation at theβ-globin locus; (ii) a hard selective sweep, whereby malaria-protective variation is associated with only a single haplotype in the meta-population; (iii) the co-occurrence of malaria-protective variation on multiple haplotypes in the meta-population where haplo-types are completely deme-specific; and (iv) the co-occurrence of multiple haplotypes in the meta-population whose distributions are not deme-specific but do not reflect closely enough the overlapping (β0-thalassaemia) or patchwork (βS) spatial patterns defined above.
3. Results
3.1. Different mutation rates favourβS- orβ0-thalassaemia-like patterns, subject to population size and structure
β0-Thalassaemic mutations can result from deletions, insertions and
point mutations anywhere in the coding or regulatory region of
β-globin. TheβSmutation, by contrast, is the result of the replacement
of a specific, single nucleotide with another. There are therefore strong biological reasons to suppose thatβ0-thalassaemic mutations arise
much more frequently thanβS
mutations.
In our simulations, increasing the mutation rate did increase the probability of observing theβ0-thalassaemia-like pattern, but only if
the overall population size was high (Fig. 1C). If the population was too small and/or too highly structured (i.e.with high population subdi-vision, a strong connection structure and low migration between demes), the probability of theβ0-thalassaemia-like pattern remained
low (b0.20) even at the highest tested mutation rate. This was due to there being insufficient genetic variation or population movement to fa-cilitate overlap in the haplotypes' distributions (Fig. 1C, E, respectively). The probability of aβS-like (patchwork) haplotype pattern, by contrast,
was negatively correlated with mutation rate (Fig. 1D, F), except in the case of a low initial total population size (Ne= 25,000) and minimal population growth (g≤0.5%) (Fig. 1D).
We also observed an interaction between the effects of initial total population size and population growth on the probability of theβS-like
pattern at low mutation rates (Supplementary Fig. S1A). Population growth had a positive effect on the probability of theβS-like pattern
when the initial total population size was small (Ne= 25000); such growth increased the overall size of the population, and thus the chances of more than oneβShaplotype arising anywhere. However,
for a much larger starting population size (Ne= 125000) population growth had a slight negative effect. This is because increasing the size of an already large population led to too manyβS
haplotypes arising through mutation and intermingling, thereby preventing a patchwork
βS-like pattern. At a higher mutation rate (μ= 10−6), population
growth rate had a negative effect on the likelihood of theβS
-like pattern across all initial population sizes.
3.2. Aβ0-thalassaemia-like pattern is most likely in a meta-population with a highly random connection structure, comprising few demes between which there is considerable geneflow; the opposite is true for a
βS-like pattern
As illustrated inFig. 2A and C, for a given initial total population size and rate of population growth, theβ0-thalassaemia-like pattern was
more likely under conditions of low subdivision, high migration and when the migration network contained more random connections. By contrast, the probability of obtaining theβS-like pattern was highest
when population subdivision was high, the migration network was non-random and migration was low (Fig. 2B, D).
For both patterns of selective sweep, population subdivision and the degree of randomness in the migration network had a weaker effect at smaller initial population sizes whenμ= 10−7events per chromosome per generation (Supplementary Figs. S2 and S3). Presumably this is
because, even if the spread of alleles in the meta-population is slowed by high population subdivision or a highly non-random migration net-work, this has little impact if opportunities for new copies of the allele to arise are few. The converse is true forβSwhenμ= 10−6events per
chromosome per generation; in this case, the effects of population sub-division and connection structure are strongest when the initial total population size is small. Moreover, the effect of population subdivision was greatest when the connectivity network was non-random (Fig. 2A, B), indicating that even at high levels of subdivision a more random migration network is sufficient to allow the“small world”
phenomenon (Watts and Strogatz, 1998; Watts, 1999) to occur, minimising the number of migratory steps that it takes for an allele to access to the entire network.
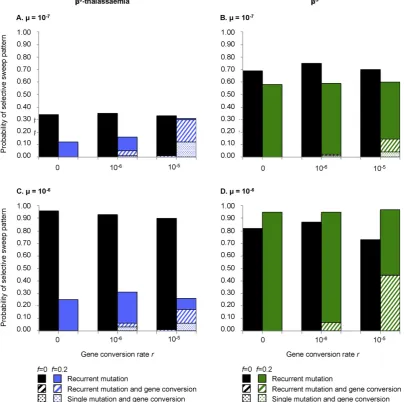
3.3. When haplotypefitnesses vary, gene conversion is more likely to contribute to the haplotypic diversity of eitherβ0-thalassaemia orβS
Theβ-globin cluster incorporates theγ- andδ-genes as well as an extensive locus control region (Forget and Hardison, 2009), mutations in any of which are capable of affecting the phenotypic outcome of a mutation in the coding region ofβ-globin itself. This phenomenon could be deemed epistasis, although the tight linkage between all ele-ments of theβ-globin cluster makes it equally acceptable to conceive of different haplotypes as allelic to one another. In either case, it is entirely plausible thatβSandβ0-thalassaemia mutations could have
dif-ferentfitnesses according to their haplotypic background. We ad-dressed the possibility of haplotypicfitness variation by randomly assigning a heterozygotefitness value, drawn from a predefined range of widthf, to each haplotype as it arose (see Supplementary material). Including inter-haplotypefitness variation decreased the probability of observing theβ0-thalassaemia-like pattern (Fig. 3A and C). This was
also true for theβS-like pattern whenμ= 10−7(Fig. 3B), although
whenμ= 10−6, inter-haplotypefitness variation increased the proba-bility of observing theβS
-like pattern (Fig. 3D).
The rate of gene conversion had almost no effect on the overall prob-ability of either theβS- orβ0-thalassaemia-like pattern (Fig. 3).
Howev-er, whenever gene conversion was allowed to occur, inter-haplotype
fitness variation increased the proportion of scenarios in which haplo-types resulting from gene conversion formed part of thefinalhaplotypic diversity of the population (Fig. 3). For example, for theβ0
-thalassaemia-like pattern, when the gene conversion rate was 10−5 events per chromosome per generation and the mutation rate was 10−7events per chromosome per generation, gene conversion contributed to the
final haplotypic diversity 97% of the time iffN0, butb1% of the time if
f= 0 (Fig. 3A).
There has so far been no attempt to quantify the relative heterozy-gotefitnesses of differentβS
- andβ0
-thalassaemia-associated haplo-types, although clinical evidence does suggest that the severity of sickle-cell anaemia andβ0-thalassaemia in homozygotes can vary
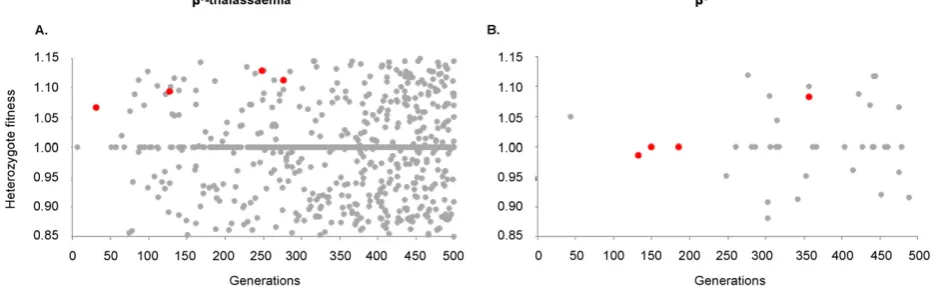
ac-cording to haplotypic background (Ashley-Koch et al., 2000; Tsaras et al., 2009). It is therefore difficult to know whether the maximumfi t-ness range included inFig. 3(f= 0.2) is plausible. Our model addition-ally shows that the haplotypes that coexisted in the long-term tended to be relatively similar in their heterozygotefitness, (Fig. 4), so a study car-ried out today may not provide a fair picture of whatfitness variation could have existed in the past. Amongstallβ0-thalassaemia-like results
wherefN0, the average within-simulation heterozygotefitness range of haplotypes that coexisted in the meta-population after 500 generations was 0.03, compared to 0.18 forallhaplotypes that arose during the 500 generations. ForβS
-like results, these values were 0.05 and 0.16, respec-tively. The averagefitness range of dominating haplotypes was 0.01 for
β0-thalassaemia-like repeats and 0.04 forβS-like repeats. Thefittest
hap-lotypes to arise contributed to thefinal haplotypic diversity in only 15% and 26% of all of the repeats exhibiting theβS- andβ0-thalassaemia-like
4. Discussion
Across all of our simulations, once a deme had come to contain aβS
-orβ0
-thalassaemia-associated haplotype at a high frequency, that deme was rarely taken over by another haplotype. This is because alleles that arose later contributed only a very small fraction of the adaptive varia-tion in quesvaria-tion and thus were vulnerable to loss by genetic drift. We refer to this phenomenon as“allelic exclusion”to coincide with the ter-minology used by Ralph and Coop (Ralph and Coop, 2010). Importantly, we found that the generation of eitherβS- orβ0-thalassaemia-like
pat-terns requires allelic exclusion to be undermined, but to different spatial extents; theβS-like pattern requires that allelic exclusion be maintained
in parts of the meta-population but not the entire network, whilst the near complete avoidance of allelic exclusion is necessary for the
β0-thalassaemia-like pattern.
Allelic exclusion can be avoided if a pre-existing haplotype has not yet reached a threshold frequency in a deme when subsequent haplo-types arrive. It follows that the timing of mutation, gene conversion and/or migration events within each deme is important in determining the evolutionary trajectory of the meta-population. Alternatively, allelic exclusion is undermined when genetic drift is weakened for incoming alleles, either through population growth orfitness variation between
haplotypes. As illustrated inFigs. 1–3, the balance between all of these factors determines the probability of either aβ0-thalassaemia- or
βS-like pattern occurring. However, generally speaking, we expect the
βS
-like pattern to emerge when mutation rate is low and the population is highly subdivided, with low connectivity and little geneflow. The
β0-thalassaemia-like pattern is more likely when mutation rate is high
and the population is less subdivided, with high connectivity and high geneflow.
Several previous theoretical treatments of soft selective sweeps have delivered important insights into the genetic and demographic factors influencing the probability of adaptation by soft selective sweepversus
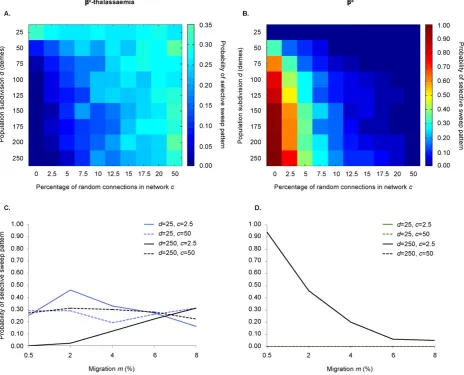
[image:7.595.70.535.55.430.2]hard selective sweep (seeMesser and Petrov, 2013for a full review). In a series of papers, Pennings and Hermisson used coalescent theory to show that soft sweeps are most likely when population size is large and/or allelic mutation rate is high (Hermisson and Pennings, 2005; Pennings and Hermisson, 2006). More recently, Ralph and Coop (2010)demonstrated that soft sweeps, specifically of the patchwork type, are likely to be common in species whose distributions are wide-spread and whose populations are geographically structured (Ralph and Coop, 2010). The behaviour of our model is consistent with these previous studies. By modelling a meta-population where we do not assume that different alleles exclude one another when they meet, we Fig. 2.The combined effects of population subdivision, connection structure and migration on the probabilities of different types of selective sweep. The heatmaps indicate the effects of population subdivision and connection structure on the probability of observingβ0
-thalassaemia- (panel A) orβS
-like (panel B) patterns. The colour of each square depicts the proportion of repeats (100 in total) that exhibit the pattern of interest. The x-axis of each panel indicates the percentage of connections in the network that are random, which corresponds directly to parameterc(see Supplementary material). Panels (C) and (D) indicate the additional impact of varying the level of geneflow (x-axis). Each data point is based on 100 simulations. Unless otherwise indicated in each panel, parameters werefixed as follows:Ne= 125,000,g= 1,f= 0,r= 0 andμ= 10−7
. In panels (A) and (B), results were averaged across two rates of migration:m= 0.5% and 2%. Theβ0
-thalassaemia-like pattern is most likely when population subdivision is low and the connection structure is random; by contrast theβS
are also able to show that a mutation rate that is too high precludes the possibility of aβS-like soft selective sweep pattern, whilst a weaker
geo-graphical structure is important for the formation of aβ0
-thalassaemia-like pattern.
As noted in the Introduction, the occurrence of the same
β0-thalassaemia variant on multiple haplotypes is generally attributed
to gene conversion. Our results imply that gene conversion can contrib-ute to haplotypic diversity only if inter-haplotypefitness is sufficiently variable.β0-Thalassaemia variants certainly vary in their clinical
sever-ity (Weatherall and Clegg, 2001a), often due to factors such as different levels of expression of foetal haemoglobin. No study has yet compared the relative level of malaria protection that is afforded by heterozygosity for differentβ0
-thalassaemia haplotypes, but it is entirely possible that variable maintenance of foetal haemoglobin might affect malaria susceptibility (Amaratunga et al., 2011; Billig et al., 2012). Curiously, however, we found that, whilst includingfitness variation made it more likely that gene conversion contributes to long-term haplotypic diversity, it simultaneously made theβ0-thalassaemia-like pattern less
likely (although not impossible). A specific combination of demographic conditions, gene conversion rate and inter-haplotypefitness variation, which increases the probability of observing aβ0
-thalassaemia-like pat-tern where the haplotypic diversity is partly derived from gene conver-sion, may yet be discovered.
Present consensus seems to be that gene conversion has had no role in the generation of the classicalβShaplotypes. This is despite modelling
work by Livingstone in 1989, in which he used a stochastic model of the diffusion of differentβS- andβA-associated chromosomes to
demon-strate that reciprocal recombination and gene conversion readily give rise to multipleβShaplotypes, with no need for recurrent mutation
(Livingstone, 1989a). Our model demonstrates that a patchwork haplo-type pattern that is at least partly derived from gene conversion is diffi -cult to obtain unless inter-haplotype fitness variation exists. It is therefore possible that, until we understand whatfitness variation is possible amongstβS
[image:8.595.92.497.56.458.2]haplotypes, we will not be able to judge properly the role of gene conversion in its evolution. However, as indicated by our simulations, it is important to bear in mind that the observed Fig. 3.The effects of gene conversion andfitness variation on the probabilities of different types of selective sweep. The total height of each bar indicates the overall probability of observing aβ0
-thalassaemia-like (A,C) orβS
-like (B,D) pattern at different levels of gene conversion (x-axis), and in the absence (black bars) or presence (blue or green bars) offitness variation amongst heterozygotes. Each bar is based on 100 simulations, and is subdivided to indicate whether gene conversion and/or recurrent mutation was responsible for the haplotypic diver-sity present in the population at the end of each simulation (see legend to each graph). Results from two different mutation rates are shown: 10−7(A,B), and 10−6(C,D). Demographic
parameter values in panels (A) and (C) werefixed as follows, to maximise the probability of aβ0-thalassaemia-like scenario:Ne= 125,000,g= 1,d= 125,c= 15 andm= 2.
Demo-graphic parameter values in panels (B) and (D) werefixed as follows, to maximise the probability of aβS
-like scenario:Ne= 25000, g = 1,d= 200,c= 2.5,m= 0.5. The inclusion of inter-haplotypefitness variation consistently decreases the probability of theβ0
present-day inter-haplotype fitness variation for both βS
- and
β0-thalassaemia may not necessarily reflect the fullfitness range of all
haplotypes that have arisen over the course of human evolutionary history and may not include thefittest haplotypes to have ever existed. There is good evidence for past gene conversion events in the
β-globin cluster (reviewed inPapadakis and Patrinos, 1999). Further and improved sequence data from this region of the genome will con-tinue to provide insight into these processes, and may be able to indicate whether gene conversion has played a role in the generation of the clas-sicalβShaplotypes. However, given that gene conversion events can
in-volve a few hundred bases, which for a conversion event involving the
βSmutation is likely to include the highly conserved coding region of
theβ-globin gene, it may not always be possible to distinguish between
de novomutation and gene conversion at theβS
locus using sequence data alone.
We defined a patchworkβS-like pattern based on the geographical
distribution of the classicalβS
haplotypes. As noted in the Introduction, classicalβShaplotypes derive from RFLP analyses, which continue to be
used in present-day studies of sickle-cell diversity (e.g.Bitoungui et al., 2015). Using SNP markers, Hanchard and colleagues showed that the classical Benin and Senegal haplotypes both exhibit a high degree of long-range haplotypic similarity extending across more than 400 kb in three separate populations (Hanchard et al., 2007). Similar results were found in a Ghanaian population (Ghansah et al., 2012). Fine-scale sequence analysis has revealed heterogeneities within the classical Benin and Bantu haplotypes (Bouhassira and Nagel, 1990; Patrinos et al., 2005). However, the distribution of the observed polymorphisms suggests that these differences evolved after the emergence ofβSon the
distinct classical haplotypes, so as such, the broad pattern of the classical RFLP haplotypes remains.
β0-Thalassaemia mutations completely eliminateβ-globin
produc-tion from the affected gene. Other mutaproduc-tions exist which reduce but do not eliminate the production ofβ-globin, designatedβ+
-thalassae-mia alleles. Likeβ0-thalassaemia,β+-thalassaemia mutations are
asso-ciated with multiple haplotypic backgrounds whose distributions have been found to overlap. To some extent, therefore, the results we present here forβ0-thalassaemia also apply to
β+-thalassaemia. However,
our present assumption of zerofitness for homozygotes for the relevant mutation is less reasonable for certain milderβ+-thalassaemic variants.
We predict that allowing for milder homozygous, or compound heterozygous, phenotypes will allow an overlapping haplotypic pattern to be obtained over a still wider range of parameter space. We propose to explore this in the future as part of a model that allows a wider range of malaria-protective globin mutations to compete with one another.
Our work so far has focused on theβ-globin locus. The study of the haplotypic evolution ofα-globin will require a different modelling approach, incorporating duplicatedα-globin genes in theα-globin clus-ter; the possible occurrence of the same variants in paralogous genes (Moradkhani et al., 2009); and the wide array ofα-thalassaemia vari-ants that are observed in human populations, including both single and double gene deletions (Weatherall and Clegg, 2001b). In this way, the relative contributions of recurrent mutation, gene conversion and unequal crossover in generating complex genetic variation in the
α-globin gene cluster can be explored, along with the roles of malaria selection and demographic factors in shaping the spatial pattern of this diversity.
Our theoretical framework can be extended in a number of ways. One informative next step will be to allowβS
andβ0
-thalassaemia mu-tations to compete within the same interconnected network, alongside
β+-thalassaemia mutations and other malaria-protective alleles with
less severe clinical outcomes, for example HbC in Africa and HbE in Asia (Fucharoen and Weatherall, 2012; Piel et al., 2013). Further investigation into the origin, maintenance and fate of different
β0-thalassaemia andβShaplotypes will also need to consider the
possi-ble influence of epistasis between mutations at theα- andβ-globin loci (Williams et al., 2005b; Penman et al., 2009, 2011); as well as interac-tions with other malaria-protective genetic variants elsewhere in the genome (reviewed inHedrick, 2011; Kwiatkowski, 2005; Williams, 2006). Finally, Wilson and colleagues recently showed that, depending on their severity and frequency of recurrence, population bottlenecks can cause a soft selective sweep to become hard (Wilson et al., 2014). It would be interesting to see how their results relate to the specific case ofβ-globin polymorphisms under malaria selection.
5. Conclusion
Sickle-cell trait andβ0-thalassaemia are two of our best examples of
recent human evolution. Here we have shown that their differing selec-tive sweep patterns may be just as much a product of different demo-graphic conditions as they are of different mutation rates. Our results also suggest that inter-haplotypicfitness variation–a very real possibil-ity forβ-globin variants–both affects the probability of observing specific haplotype patterns and increases the probability of gene conversion having contributed to the variation present today. A better understanding of thefitness variation that is possible amongst
β0-thalassaemia- orβS-associated haplotypes, will therefore be critical
[image:9.595.68.537.57.203.2]in determining the role of gene conversion in their evolution. Supplementary data to this article can be found online athttp://dx. doi.org/10.1016/j.meegid.2015.09.018.
Fig. 4.Comparing thefitnesses of all haplotypes that aroseversusthose that succeeded. Each panel indicates the heterozygotefitness values assigned to all haplotypes that arose over the course of a single simulation (grey), compared to those haplotypes that remained in the meta-population at a frequency≥1% after 500 generations (red). The range offitness values for the latter is considerably smaller than that for the former. Panel (A) illustrates aβ0
-thalassaemia-like scenario, for which the parameter values were:Ne= 125,000, g = 1,d= 125,c= 15,
m= 2,f= 0.3,r= 10−5
andμ= 10−7
. Panel (B) illustrates aβS
-like scenario, for which the parameter values wereNe= 75,000,g= 0,d= 75,c= 5,m= 0.5,f= 0.3,r= 5 × 10⁻⁶
and μ= 10−7
Acknowledgements
The authors would like to acknowledge the use of the Oxford Advanced Research Computing (ARC) in carrying out this work. We also thank José Lourenço for comments on earlier versions of the manuscript. B.S.P. is a Sir Henry Wellcome Postdoctoral Fellow (Grant 096063/Z/11/Z) and a Junior Research Fellow at Merton College. S.G. is a Royal Society Wolfson Research Fellow and an ERC advanced investigator (DIVERSITY).
References
Adekile, A.D., Gu, L.H., Baysal, E., Haider, M.Z., Al-Fuzae, L., Aboobacker, K.C., Al-Rashied, A., Huisman, T.H., 1994.Molecular characterization of alpha-thalassemia determinants, beta-thalassemia alleles, and beta S haplotypes among Kuwaiti Arabs. Acta Haematol. 92, 176–181.
Agouti, I., Badens, C., Abouyoub, A., Levy, N., Bennani, M., 2008.Molecular basis of beta-thalassemia in Morocco: possible origins of the molecular heterogeneity. Genet. Test. 12, 563–568.
Al Arrayed, S., Haites, N., 1995.Features of sickle-cell disease in Bahrain. East Mediterr. Health J. 1, 112–119.
Allison, A.C., 1964. Polymorphism and natural selection in human populations. Cold Spring Harb. Symp. Quant. Biol. 29, 137–149.http://dx.doi.org/10.1101/SQB.1964. 029.01.018.
Amaratunga, C., Lopera-Mesa, T.M., Brittain, N.J., Cholera, R., Arie, T., Fujioka, H., Keefer, J.R., Fairhurst, R.M., 2011.A role for fetal hemoglobin and maternal immune IgG in infant resistance toPlasmodium falciparummalaria. PLoS One 6, e14798.
Antonarakis, S., Kazazian, H., Orkin, S., 1985.DNA polymorphism and molecular patholo-gy of the human globin gene clusters. Hum. Genet. 69, 1–14.
Ashley-Koch, A., Yang, Q., Olney, R.S., 2000.Sickle hemoglobin (HbS) allele and sickle cell disease: a HuGE review. Am. J. Epidemiol. 151, 839–845.
Bennani, C., Bouhass, R., Perrin-Pecontal, P., Tamouza, R., Malou, M., Elion, J., Trabuchet, G., Beldjord, C., Benabadji, M., Labie, D., 1994.Anthropological approach to the heteroge-neity of beta-thalassemia mutations in northern Africa. Hum. Biol. 66, 369–382.
Billig, E.M.W., McQueen, P.G., McKenzie, F.E., 2012.Foetal haemoglobin and the dynamics of paediatric malaria. Malar. J. 11, 396.
Bitoungui, V.J.N., Pule, G.D., Hanchard, N., Ngogang, J., Wonkam, A., 2015.Beta-globin gene haplotypes among Cameroonians and review of the global distribution: is there a case for a single sickle mutation origin in Africa? OMICS 19, 171–179.
Boletini, E., Svobodova, M., Divoky, V., Baysal, E., Cürük, M.A., Dimovski, A.J., Liang, R., Adekile, A.D., Huisman, T.H., 1994.Sickle cell anemia, sickle cell beta-thalassemia, and thalassemia major in Albania: characterization of mutations. Hum. Genet. 93, 182–187.
Bouhass, R., Perrin, P., Trabuchet, G., 1994.The spectrum of beta-thalassemia mutations in the Oran region of Algeria. Hemoglobin 18, 211–219.
Bouhassira, E.E., Nagel, R.L., 1990.A 6-bp deletion 5′to the G gamma globin gene in beta S chromosomes bearing the Bantu haplotype. Am. J. Hum. Genet. 47, 161–163.
Cao, A., Galanello, R., 2010.Beta-thalassemia. Genet. Med. 12, 62–73.
Cao, A., Rosatelli, C., Pirastu, M., Galanello, R., 1991.Thalassemias in Sardinia: molecular pathology, phenotype–genotype correlation, and prevention. Am. J. Pediatr. Hematol. Oncol. 13, 179–188.
Carter, R., Mendis, K.N., 2002.Evolutionary and historical aspects of the burden of malaria. Clin. Microbiol. Rev. 15, 564–594.
Chebloune, Y., Pagnier, J., Trabuchet, G., Faure, C., Verdier, G., Labie, D., Nigon, V., 1988.
Structural analysis of the 5′flanking region of the beta-globin gene in African sickle cell anemia patients: further evidence for three origins of the sickle cell mutation in Africa. Proc. Natl. Acad. Sci. U. S. A. 85, 4431–4435.
Chen, J.-M., Cooper, D.N., Chuzhanova, N., Férec, C., Patrinos, G.P., 2007.Gene conversion: mechanisms, evolution and human disease. Nat. Rev. Genet. 8, 762–775.
el-Hazmi, M.A., Warsy, A.S., Bashir, N., Beshlawi, A., Hussain, I.R., Temtamy, S., Qubaili, F., 1999.Haplotypes of the beta-globin gene as prognostic factors in sickle-cell disease. East. Mediterr. Health J. 5, 1154–1158.
Ellegren, H., Smith, N.G., Webster, M.T., 2003.Mutation rate variation in the mammalian genome. Curr. Opin. Genet. Dev. 13, 562–568.
Falchi, A., Giovannoni, L., Vacca, L., Latini, V., Vona, G., Varesi, L., 2005.Beta-globin gene cluster haplotypes associated with beta-thalassemia on Corsica island. Am. J. Hematol. 78, 27–32.
Fattoum, S., Guemira, F., Oner, C., Oner, R., Li, H.W., Kutlar, F., Huisman, T.H., 1991. Beta-thalassemia, HB S-beta-thalassemia and sickle cell anemia among Tunisians. Hemoglobin 15, 11–21.
Flint, J., Harding, R.M., Boyce, A.J., Clegg, J.B., 1998.The population genetics of the haemoglobinopathies. Baillieres Clin. Haematol. 11, 1–51.
Forget, B., Hardison, R., 2009. The normal structure and regulation of human globin gene clusters. Disorders of Hemoglobin. Cambridge University Press, pp. 46–61.http://dx. doi.org/10.1017/CBO9780511596582.007.
Fucharoen, S., Weatherall, D.J., 2012.The hemoglobin E thalassemias. Cold Spring Harb. Perspect. Med. 2, a011734–.
Furuumi, H., Firdous, N., Inoue, T., Ohta, H., Winichagoon, P., Fucharoen, S., Fukumaki, Y., 1998.Molecular basis of beta-thalassemia in the Maldives. Hemoglobin 22, 141–151.
Gabriel, A., Przybylski, J., 2010.Sickle-cell anemia: a look at global haplotype distribution. Nat. Educ. 3, 2.
Ghansah, A., Rockett, K.A., Clark, T.G., Wilson, M.D., Koram, K.A., Oduro, A.R., Amenga-Etego, L., Anyorigiya, T., Hodgson, A., Milligan, P., Rogers, W.O., Kwiatkowski, D.P., 2012.Haplotype analyses of haemoglobin C and haemoglobin S and the dynamics of the evolutionary response to malaria in Kassena-Nankana District of Ghana. PLoS One 7, e34565.
Gupta, A., Sarwai, S., Pathak, N., Agarwal, S., 2008.Beta-globin gene mutations in India and their linkage toβ-haplotypes. Int. J. Hum. Genet. 8, 237–241.
Hanchard, N., Elzein, A., Trafford, C., Rockett, K., Pinder, M., Jallow, M., Harding, R., Kwiatkowski, D., McKenzie, C., 2007.Classical sickle beta-globin haplotypes exhibit a high degree of long-range haplotype similarity in African and Afro-Caribbean populations. BMC Genet. 8, 52.
Hedrick, P.W., 2011.Population genetics of malaria resistance in humans. Heredity (Edinb) 107, 283–304.
Hermisson, J., Pennings, P.S., 2005.Soft sweeps: molecular population genetics of adapta-tion from standing genetic variaadapta-tion. Genetics 169, 2335–2352.
Hill, A.V., Allsopp, C.E., Kwiatkowski, D., Anstey, N.M., Twumasi, P., Rowe, P.A., Bennett, S., Brewster, D., McMichael, A.J., Greenwood, B.M., 1991.Common west African HLA antigens are associated with protection from severe malaria. Nature 352, 595–600.
Kulozik, A.E., Wainscoat, J.S., Serjeant, G.R., Kar, B.C., Al-Awamy, B., Essan, G.J., Falusi, A.G., Haque, S.K., Hilali, A.M., Kate, S., 1986.Geographical survey of beta S-globin gene haplotypes: evidence for an independent Asian origin of the sickle-cell mutation. Am. J. Hum. Genet. 39, 239–244.
Kwiatkowski, D.P., 2005.How malaria has affected the human genome and what human genetics can teach us about malaria. Am. J. Hum. Genet. 77, 171–192.
Labie, D., Srinivas, R., Dunda, O., Dode, C., Lapoumeroulie, C., Devi, V., Devi, S., Ramasami, K., Elion, J., Ducrocq, R., Krishnamoorthy, R., Nagel, R.L., 1989.Haplotypes in tribal Indians bearing the sickle gene: evidence for the unicentric origin of the beta S mutation and the unicentric origin of the tribal populations of India. Hum. Biol. 61, 479–491.
Lemsaddek, W., Picanço, I., Seuanes, F., Mahmal, L., Benchekroun, S., Khattab, M., Nogueira, P., Osório-Almeida, L., 2003.Spectrum of beta thalassemia mutations and HbF levels in the heterozygous Moroccan population. Am. J. Hematol. 73, 161–168.
Lemsaddek, W., Picanço, I., Seuanes, F., Nogueira, P., Mahmal, L., Benchekroun, S., Khattab, M., Osório-Almeida, L., 2004.Theβ-thalassemia mutation/haplotype distribution in the Moroccan population. Hemoglobin 28, 25–37.
Livingstone, F., 1989a.Who gave whom hemoglobin S: the use of restriction site haplotype variation for the interpretation of the evolution of theβS-globin gene. Am. J. Hum. Biol. 1, 289–302.
Livingstone, F., 1989b.Simulation of the diffusion of the beta-globin variants in the Old World. Hum. Biol. 61, 297–309.
Loggetto, S.R., 2013.Sickle cell anemia: clinical diversity and beta S-globin haplotypes. Rev. Bras. Hematol. Hemoter. 35, 155–157.
Messer, P.W., Petrov, D.A., 2013.Population genomics of rapid adaptation by soft selective sweeps. Trends Ecol. Evol. 28, 659–669.
Moradkhani, K., Préhu, C., Old, J., Henderson, S., Balamitsa, V., Luo, H.-Y., Poon, M.-C., Chui, D.H.K., Wajcman, H., Patrinos, G.P., 2009.Mutations in the paralogous human alpha-globin genes yielding identical hemoalpha-globin variants. Ann. Hematol. 88, 535–543.
Nachman, M.W., Crowell, S.L., 2000.Estimate of the mutation rate per nucleotide in humans. Genetics 156, 297–304.
Niranjan, Y., Chandak, G.R., Veerraju, P., Singh, L., 1999.Some atypical and rare sickle cell gene haplotypes in populations of Andhra Pradesh, India. Hum. Biol. 71, 333–340.
Oner, C., Dimovski, A., Olivieri, N., Schiliro, G., Codrington, J., Fattoum, S., Adekile, A., Oner, R., Yuregir, G., Altay, C., Gurgey, A., Gupta, R., Jogessar, V., Kitundu, M., Loukopoulos, D., Tamagnini, G., Ribeiro, M.L., Kutlar, F., Gu, L.-H., Lanclos, K., Huisman, T.J., 1992.
Beta S haplotypes in various world populations. Hum. Genet. 89, 99–104.
Pagnier, J., Mears, J.G., Dunda-Belkhodja, O., Schaefer-Rego, K.E., Beldjord, C., Nagel, R.L., Labie, D., 1984.Evidence for the multicentric origin of the sickle cell hemoglobin gene in Africa. Proc. Natl. Acad. Sci. 81, 1771–1773.
Papadakis, M.N., Patrinos, G.P., 1999.Contribution of gene conversion in the evolution of the human beta-like globin gene family. Hum. Genet. 104, 117–125.
Patrinos, G.P., Giardine, B., Riemer, C., Miller, W., Chui, D.H.K., Anagnou, N.P., Wajcman, H., Hardison, R.C., 2004.Improvements in the HbVar database of human hemoglobin variants and thalassemia mutations for population and sequence variation studies. Nucleic Acids Res. 32, D537–D541.
Patrinos, G.P., Samperi, P., Lo Nigro, L., Kollia, P., Schiliro, G., Papadakis, M.N., 2005.
Evidence for the molecular heterogeneity of sickle cell anemia chromosomes bearing the betaS/Benin haplotype. Am. J. Hematol. 80, 79–80.
Penman, B.S., Pybus, O.G., Weatherall, D.J., Gupta, S., 2009.Epistatic interactions between genetic disorders of hemoglobin can explain why the sickle-cell gene is uncommon in the Mediterranean. Proc. Natl. Acad. Sci. U. S. A. 106, 21242–21246.
Penman, B.S., Habib, S., Kanchan, K., Gupta, S., 2011.Negative epistasis betweenα+ thalassaemia and sickle cell trait can explain interpopulation variation in South Asia. Evolution 65, 3625–3632.
Penman, B.S., Gupta, S., Buckee, C.O., 2012.The emergence and maintenance of sickle cell hotspots in the Mediterranean. Infect. Genet. Evol. 12, 1543–1550.
Pennings, P.S., Hermisson, J., 2006.Soft sweeps II—molecular population genetics of adaptation from recurrent mutation or migration. Mol. Biol. Evol. 23, 1076–1084.
Piel, F.B., Patil, A.P., Howes, R.E., Nyangiri, O.A., Gething, P.W., Williams, T.N., Weatherall, D.J., Hay, S.I., 2010.Global distribution of the sickle cell gene and geographical confirmation of the malaria hypothesis. Nat. Commun. 1, 104.
Ralph, P., Coop, G., 2010.Parallel adaptation: one or many waves of advance of an advantageous allele? Genetics 186, 647–668.
Roberts, D.J., Williams, T.N., 2003.Haemoglobinopathies and resistance to malaria. Redox Rep. 8, 304–310.
Rockett, K.A., Clarke, G.M., Fitzpatrick, K., Hubbart, C., Jeffreys, A.E., Rowlands, K., Craik, R., Jallow, M., Conway, D.J., Bojang, K.A., Pinder, M., Usen, S., Sisay-Joof, F., Sirugo, G., Tour, O., Taylor, T., Kwiatkowski, D.P., 2014.Reappraisal of known malaria resistance loci in a large multicenter study. Nat. Genet. 46, 1197–1204.
Rouabhi, F., Lapouméroulie, C., Amselem, S., Krishnamoorthy, R., Adjrad, L., Girot, R., Chardin, P., Benabdji, M., Labie, D., Beldjord, C., 1988.DNA haplotype distribution in Algerian beta thalassaemia patients. An extended evaluation by family studies and representative molecular characterization. Hum. Genet. 79, 373–376.
Schilirò, G., Di Gregorio, F., Samperi, P., Mirabile, E., Liang, R., Cürük, M.A., Ye, Z., Huisman, T.H., 1995.Genetic heterogeneity of beta-thalassemia in southeast Sicily. Am. J. Hematol. 48, 5–11.
Schilirò, G., Mirabile, E., Testa, R., Russo-Mancuso, G., Dibenedetto, S.P., 1997.Presence of hemoglobinopathies in Sicily: a historic perspective. Am. J. Med. Genet. 69, 200–206.
Taylor, S.M., Parobek, C.M., Fairhurst, R.M., 2012.Haemoglobinopathies and the clinical epidemiology of malaria: a systematic review and meta-analysis. Lancet Infect. Dis. 12, 457–468.
Trabuchet, G., Elion, J., Baudot, G., Pagnier, J., Bouhass, R., Nigon, V.M., Labie, D., Krishnamoorthy, R., 1991.Origin and spread of beta-globin gene mutations in India, Africa, and Mediterranea: analysis of the 5′flanking and intragenic sequences of beta S and beta C genes. Hum. Biol. 63, 241–252.
Tsaras, G., Owusu-Ansah, A., Boateng, F.O., Amoateng-Adjepong, Y., 2009.Complications associated with sickle cell trait: a brief narrative review. Am. J. Med. 122, 507–512.
Wainscoat, J.S., Bell, J.I., Thein, S.L., Higgs, D.R., Sarjeant, G.R., Peto, T.E., Weatherall, D.J., 1983.Multiple origins of the sickle mutation: evidence from beta S globin gene cluster polymorphisms. Mol. Biol. Med. 1, 191–197.
Watts, D.J., 1999.Networks, dynamics, and the small-world phenomenon. Am. J. Sociol. 105, 493–527.
Watts, D.J., Strogatz, S.H., 1998.Collective dynamics of“small-world”networks. Nature 393, 440–442.
Weatherall, D.J., Clegg, J.B., 2001a.Inherited haemoglobin disorders: an increasing global health problem. Bull. World Health Organ. 79, 704–712.
Weatherall, D.J., Clegg, J.B., 2001b.The Thalassaemia Syndromes. 4th ed. Blackwell Science Ltd, Oxford.
Weatherall, D., Akinyanju, O., Fucharoen, S., Olivieri, N., Musgrove, P., 2006.Inherited dis-orders of hemoglobin. Disease Control Priorities in Developing Countries, pp. 663–680.
Williams, T.N., 2006.Human red blood cell polymorphisms and malaria. Curr. Opin. Microbiol. 9, 388–394.
Williams, T.N., Mwangi, T.W., Roberts, D.J., Alexander, N.D., Weatherall, D.J., Wambua, S., Kortok, M., Snow, R.W., Marsh, K., 2005a.An immune basis for malaria protection by the sickle cell trait. PLoS Med. 2, e128.
Williams, T.N., Mwangi, T.W., Wambua, S., Peto, T.E.A., Weatherall, D.J., Gupta, S., Recker, M., Penman, B.S., Uyoga, S., Macharia, A., Mwacharo, J.K., Snow, R.W., Marsh, K., 2005b. Negative epistasis between the malaria-protective effects of alpha+-thalassemia and the sickle cell trait. Nat. Genet. 37, 1253–1257.http://dx.doi.org/10.1038/ng1660. Wilson, B.A., Petrov, D., Messer, P.W., 2014.Soft selective sweeps in complex
demograph-ic scenarios. Genetdemograph-ics 198, 669–684.
Xue, Y., Wang, Q., Long, Q., Ng, B.L., Swerdlow, H., Burton, J., Skuce, C., Taylor, R., Abdellah, Z., Zhao, Y., MacArthur, D.G., Quail, M.A., Carter, N.P., Yang, H., Tyler-Smith, C., 2009.