CROPS AND SOILS RESEARCH PAPER
The performance of the EU-Rotate_N model in predicting
the growth and nitrogen uptake of rotations of field
vegetable crops in a Mediterranean environment
C. NENDEL1*, A. VENEZIA2, F. PIRO2, T. REN3, R. D. LILLYWHITE4 ANDC. R. RAHN4
1Leibniz Centre for Agricultural Landscape Research, Institute of Landscape Systems Analysis, Eberswalder Straße 84, 15374 Müncheberg, Germany
2Centro di Ricerca per l
’Orticoltura, Via dei Cavalleggeri 25, Casella Postale 48, 84098 Pontecagnano, Italy 3College of Resources and Environmental Sciences, China Agricultural University, Beijing 100193,
People’s Republic of China
4School of Life Sciences, University of Warwick, Wellesbourne, Warwick CV35 9EF, UK
(Received 21 March 2011; revised 27 May 2012; accepted 24 July 2012)
SUMMARY
The EU-Rotate_N model was developed as a tool to estimate the growth and nitrogen (N) uptake of vegetable crop rotations across a wide range of European climatic conditions and to assess the economic and environmental consequences of alternative management strategies. The model has been evaluated under field conditions in Germany and Norway and under greenhouse conditions in China. The present work evaluated the model using Italian data to evaluate its performance in a warm and dry environment. Data were collected from four 2-year field rotations, which included lettuce (Lactuca sativaL.), fennel (Foeniculum vulgareMill.), spinach (Spinacia oleracea L.), broccoli (Brassica oleraceaL. var.italicaPlenck) and white cabbage (B. oleraceaconvar.capitatavar.albaL.); each rotation used three different rates of N fertilizer (average recommended N1, assumed farmer’s practice N2 = N1 + 0·3 × N1 and a zero control N0). Although the model was not calibrated prior to running the simulations, results for above-ground dry matter biomass, crop residue biomass, crop N concentration and crop N uptake were promising. However, soil mineral N predictions to 0·6 m depth were poor. The main problem with the prediction of the test variables was the poor ability to capture N mineralization in some autumn periods and an inappropriate parameterization of fennel. In conclusion, the model performed well, giving results comparable with other bio-physical process simulation models, but for more complex crop rotations. The model has the potential for application in Mediterranean environments for field vegetable production.
INTRODUCTION
The fate of nitrogen (N) in agricultural systems has been the subject of many investigations over the years, with its contribution to environmental pollution being of major concern (Suttonet al.2011). The production of field vegetables can result in large N surpluses com-pared with other production systems, due to the greater supply of N to vegetable crops and the large amounts of N-rich crop residues left after harvest (Agostiniet al.
2010). Leaching is the major pathway for N loss and an important issue in countries where N input is still
very high (Ramos et al. 2002; Cao et al. 2005). However, increasing concerns over the production of greenhouse gases and their effects on the climate has also focussed attention on gaseous N emissions, principally nitrous oxide (Mei et al. 2009). In com-mercial vegetable production, large amounts of N are unavoidably left in the soil after harvest, so research has focused on the improvement of N use efficiency (Zotarelliet al.2009) and on the clarification of detailed N dynamics (Jackson 2000). Many strat-egies have been proposed to reduce N losses, in-cluding changes to cropping sequences (Dusenbury et al. 2008), more targeted application of fertilizer (Westerveld et al. 2006), precision irrigation
(Halvorson et al. 2008), fertigation (Gallardo et al.
2006), the use of organic N sources (Crews & Peoples 2005) and different fertilizer types (Guertal2009). Soil– fertilizer–plant–water interactions are very complex (Wang et al.2007); therefore, simulation models for agro-ecosystems were developed to further elucidate the fate of N in vegetable production and to compare different management strategies (Caveroet al.1999).
Mediterranean countries share similar growing conditions for vegetable production and farmers’ approaches to the use of fertilizer N. Consequently, resulting environmental problems are also comparable (Ramoset al.2002). Modelling approaches have been applied to these vegetable production systems, i.e. in Italy (Lugatoet al.2007; Rinaldiet al.2007), Spain (de Paz & Ramos 2004), France (Lafolie et al. 1997; Leenhardtet al.1998) and Turkey (Muhammetoglu & Yardimci2006). Unfortunately, all these approaches use simulation models which were not designed for the specific conditions and peculiarities of vegetable production.
The EU-Rotate_N simulation model (Rahn et al.
2010) was developed to predict N dynamics for vegetable crops across Europe. However, to date this dynamic, process-based model has only been tested against a number of vegetable rotations in Germany and Norway (Rahnet al.2010) and greenhouse crop
rotations in China (Guoet al.2010), but not in warm and dry field environments. To address this issue, the EU-Rotate_N model was used to estimate the growth and N uptake of crops using data taken from an experiment growing a range of field vegetables in rotation in Italy.
MATERIALS AND METHODS Experimental crop rotations
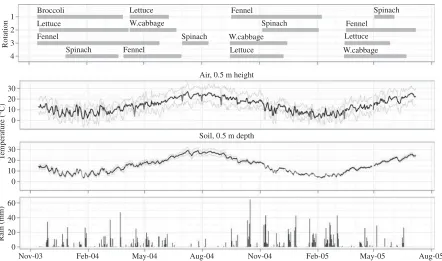
Four 2-year crop rotations were grown at the CRA-ORT experimental station at Pontecagnano, Italy (40°38′N, 14°52′E). Each crop was supplied with three N levels and grown in two different seasons (spring–summerv. autumn–winter seasons) until completion of a four crop rotation. All rotations contained lettuce (Lactuca sativaL.), fennel (Foeniculum vulgare Mill.), spinach (Spinacia oleraceaL.) and broccoli (Brassica oleracea L. var.italicaPlenck) and were irrigated on demand. After the first season, white cabbage (B. oleracea convar.capitatavar.albaL.) replaced broccoli due to its disappointing performance over winter (Fig. 1). Crops were chosen to investigate combinations of alternating rooting depths and different seasonal N requirements. Climate data used for modelling were recorded by a weather station on site.
Broccoli
Lettuce
Lettuce
Lettuce
Lettuce
Air, 0.5 m height
Soil, 0.5 m depth
Feb-04 May-04 Aug-04 Nov-04 Nov-03
0 20 40
Rain (mm)
Rotation
T
emperature (°C)
60 30 20 10 0 30 4 3 2 1
20 10 0
Feb-05 May-05 Aug-05 Fennel
Fennel
Fennel
Fennel W.cabbage
W.cabbage
W.cabbage Spinach
Spinach
Spinach
[image:2.595.90.532.65.326.2]Spinach
Fig. 1. Crop sequence and length in the four rotations, profiles of site air temperature at a height of 0·5 m and of soil temperature at a depth of 0·1 m and the amount of precipitation during the period.
The first crops of rotations 1–3 (broccoli, fennel and lettuce) were transplanted in November 2003, after a crop of broad beans (Vicia fabaL.) harvested in early summer; the land was left fallow between harvest and transplanting. White cabbage followed by sunflower (Helianthus annuus L.) had been grown the year before. The first crop of rotation 4 (spinach) was seeded at the end of the year. The second cycle started in April 2004 for lettuce, cabbage, fennel and a late spinach crop, which was delayed by the longer growing season of the preceding fennel crop and then failed partly due to a damaged sprinkler during a hot and windy period. The third cycle started in September 2004, following a 3-month summer fallow period for lettuce, fennel and white cabbage; spinach was sown in early October 2004. The fourth cycle started in March 2005 for cabbage, lettuce and fennel with spinach seeded at the beginning of April. The experiment ended in July 2005. This approach ensured that the same crops were observed twice in spring and twice in the autumn– winter season. Crop residue incorporation to a tillage depth of 0·2 m occurred within 1 week of harvesting.
Three N treatments were used: the average of official national and regional recommendations for the crop (N1), an assumed farmer’s common practice rate, i.e. N1 + 0·3 × N1 (N2) and a zero rate for the control (N0). The farmer’s rate for each vegetable species was defined by gathering information from agricultural magazines and agricultural consultants operating in the CRA-ORT area. A split-plot field layout was used, with rotation as the main plot and N rate in subplots of 75 m2(5 × 15 m); each treatment was replicated twice with each replicate in a separate block. The N rate for each crop was fixed and applied irrespective of the preceding crop sequence. Ammonium sulphate was used for the base N dressing and ammonium nitrate for top dressing (Table 1).
The site was located in the coastal plain south of Salerno, a major vegetable growing area; the soil was a deep and well-drained loam with mass fractions of 0·43 sand, 0·18 clay and 0·39 silt, 0·035 kg organic matter/kg soil and a C : N ratio of 10. A former citrus orchard, the site had been intensively amended with sunflower stalk mulch before being turned into permanent grassland for 2 years. After being converted into a vegetable field, broad beans were the principal crop grown on it in vegetable rotations. Irrigation was applied with a low-pressure sprinkler system.
Above-ground biomass and its N content were determined by sampling three to seven times for dry matter and two to five times for crop N during the
growing season with the final sample taken at harvest. A sample consisted of a number of plants varying by species and growth stage. The numbers of plants taken at harvest and transplanting stages were: 5 and 20 plants, respectively, for broccoli; 5 and 30, respect-ively, for cabbage; 10 and 40 for lettuce and 20 and 100 for spinach. Dry matter was determined by oven drying and subsequent weighing. Above-ground dry matter N concentration was determined using the Kjeldahl method for total N and ionic chromatography on aqueous extracts for nitrate N (ICS 1500, Dionex, Sunnyvale, CA, USA). Nitrogen uptake was calculated from dry matter and N concentration. Soil mineral N was determined twice on soil samples taken at two depths (0–0·3 and 0·3–0·6 m). The first sample was taken at planting before the application of N and the second after harvest. Samples were immediately frozen at–30 °C for storage until analysis. Soil mineral N was extracted using sodium carbonate (1·8 mmol/l) and bicarbonate (1·7 mmol/l) for nitrate and metansul-phonic acid (20 mmol/l) for ammonium and analysed in solution using an ICS1500 ionic exchange chroma-tographer (Dionex, USA), with AS4A-SC and CS-12A columns, respectively.
The EU-Rotate_N simulation model
[image:3.595.296.523.122.262.2]The dynamic, process-based simulation model EU-Rotate_N was developed as a tool to optimize N use in horticultural crop rotations across Europe (Rahn et al.2010). In part, it was based on the single season N_ABLE model (Greenwoodet al.1996). EU-Rotate_N simulates crop–soil interactions in vegetable crop rotations, mainly on a process basis using daily time steps. Nitrogen movement in soil is driven by water Table 1. Nitrogen fertilizer application rates for the different fertilizing strategies N0 (control), N1 (recommended rate) and N2 (farmer’s practice N1 + 30%)
Crop
N rates (kg N/ha)
Application timing
N0 N1 N2
Broccoli/ cabbage
0 250 325 0·33 at transplanting,
30 and 60 days later
Fennel 0 200 260 0·33 at transplanting,
30 and 60 days later
Spinach 0 150 195 0·50 at transplanting
and 30 days later
Lettuce 0 160 208 0·50 at transplanting
balance and transport. Water movement in soil follows a capacity approach, for which the water content at saturation, field capacity and wilting point define the hydraulic soil properties. Crop evapotranspiration is calculated using Penman–Monteith algorithms (Allenet al.1998) and crop-specific correction factors (Kcvalues). In simulations, water stress reduces plant growth linearly with decreasing available soil moist-ure, as soon as it falls below a user-defined critical deficit. If the simulated average soil moisture in the rooting zone is below the permanent wilting point, crop growth ceases.
Crop growth follows a target yield approach, for which a maximum achievable yield needs to be pro-vided on the basis of the user’s experience. This approach is considered the most feasible, considering the vast range of different crop types and morphologies among field vegetables and the resulting difficulties in applying generic photosynthesis-driven algorithms. Marketable parts of the crops and, correspondingly, the amount of residues to remain in the field are cal-culated using a population approach for row crops providing a single product per plant and a regression approach for others (Nendelet al.2009). The popu-lation approach uses crop-specific dry matter concen-trations and a distribution coefficient for individual weights to calculate a fresh weight distribution of the plant population. For user-defined upper and lower boundaries of marketable produce the fresh market-able yield is calculated. Individual plants producing marketable parts outside the boundary conditions (i.e. at insufficient water or N supply or inappropriate planting space) are treated as crop residues, assuming that they would be graded out and left in or brought back to the field immediately. This approach reflects the water and N availability to individual plants at varying planting spaces. For non-row crops an em-pirical transfer function was used to calculate fresh marketable yield for different N supply levels (Nendel et al.2009).
Crop residues were assigned a dynamic C : N ratio, which reflects the N supply of the crop during the growth period. Default C : N ratios and partitioning coefficients for crop residues were derived from step-wise chemical digestion experiments (Jensen et al.
2005).
Organic matter turnover, including N mineraliz-ation, denitrification and CO2release were based on algorithms from the DAISY model (Hansenet al.1991). The pool concept includes two pools each for fresh added organic matter, microbial biomass and soil
organic matter, representing a fraction of organic matter with slow and one with rapid turnover rates. The pools are carbon (C) pools, from which N is released or immobilized during turnover processes according to increasing or decreasing C : N ratios dur-ing mass transfer between pools of fixed C : N ratios. The turnover rates are taken from DAISY standards.
Root growth is calculated by a thermal time ap-proach and distributed spatially in a 2D soil cell grid (Pedersenet al.2010), allowing for the simulation of spacing effects in row crops (Nendelet al.2009). Crop and soil-specific rooting depth enables deep and shallow rooted crops, and their characteristic N ex-ploitation from the soil, to be simulated. Nitrogen uptake is calculated as a function of crop N demand and the potential root N uptake. Crop critical N con-tent is calculated according to Greenwood (2001), allowing for luxury N consumption in typical veg-etables using a crop-specific surplus factor. The critical N curve (or luxury N curve, respectively) determines the N demand of the crop. If the N demand cannot be met due to insufficient N available in the rooted soil or due to low soil water contents that limit N transport towards the root, a reduction factor proportional to the N deficit reduces daily growth. Once growth is reduced by N or water shortage, the specified target yield at harvest can no longer be met.
Nitrogen fertilizer applications can be input directly, specifying date, amount and fertilizer type. Different N fertilizers are provided in a database, distinguished by percentages of ammonia, nitrate and carbamide content. In addition, a triggered fertilizer strategy is provided by the model (Nendel 2009). A database containing European standard prices for marketable crops and standard figures for gross margin calculation supports the economic output of the model, enabling the simultaneous evaluation of management effects on both the environment and economic returns (Nendel
2009).
Model settings and input variables
conditions for soil moisture and mineral N content (as NO3-N) were set as observed in two soil layers down to 0·6 m depth at the start of the experiment, with no further update for soil mineral N. Soil information used as input for the model is summarized inTable 2. The ratio between soil moisture deficit and the correspond-ing dry matter weight reduction due to water stress was set to 0·1, while defaults (0) have been used for minimum and maximum fresh weight per marketable part of the crop and variability coefficient of market-able yield. The target yields for each season were set from the maximum dry matter yields achieved in the experiments for each crop–season combination
(Table 3).
Model performance evaluation
Model performance was evaluated by comparisons be-tween observations and model predictions for above-ground dry biomass, amount of crop residue biomass, above-ground biomass N concentration, crop N uptake and soil mineral N content. Overall evaluation by crop was based on the following summary statistics for forecast verification (Stanski et al. 1989), which were calculated on paired predictions and means of replicate observations. The percent bias of prediction (PBIAS) was calculated as:
PBIAS=100×
n
i=1
(Pi−Oi)
n
i=1Oi
wheren is the size of the sample, P is the predicted value and O the observed value. This is the average
difference between predicted and observed as percen-tage of observed mean (range = 0 : +1), used to assess
prediction bias in relation to the average magnitude of the observed. The mean absolute prediction error (MAE, Shaeffer1980) was calculated as:
MAE=
n
i=1
Pi−Oi
| |
n
It is the average of absolute differences between predicted and observed (range = 0 : +1), employed
to calculate the average magnitude of prediction errors, irrespective of their direction. Willmott’s index of agreement (d, Willmott & Wicks 1980) was calculated as:
d=1−
n
i=1(Pi−Oi)2
n
i=1 Pi−O
+ Oi−O
2
whereOis the mean of the observed values. This is a standardized measure of the degree of model predic-tion error and proporpredic-tionality between predicpredic-tions and observations with a range 0 : 1 (1 = perfect agree-ment; 0 = no agreement at all). It is more consistent than the linear correlation coefficient, but sensitive to extreme values, due to the squared differences. Finally, the Nash–Sutcliffe efficiency index (EF, Nash & Sutcliffe1970) was calculated as:
EF=1−
n
i=1(Pi−Oi)
2
n
i=1(Oi−O)2
This is a normalized measure of the relative magnitude of the data variance (information) compared with the residual variance (noise), with the range−1to 1 (1 = perfect fit; 0 = predictions are as accurate as the mean of the observed data; −1< 0 = predictions worse than the mean of observed).
Model performance in relation to the experimental factors was further assessed with an analysis of vari-ance (ANOVA) by crop species of the difference be-tween the unique model predictions and the replicated observations for the combinations of rotation × N treatment × crop stage, according to the split-plot design of the field layout, with crop stages within N treatments within rotation within blocks, summarized as:
yijkl=m+blocki+rotationij+N treatmentijk +crop stageijkl
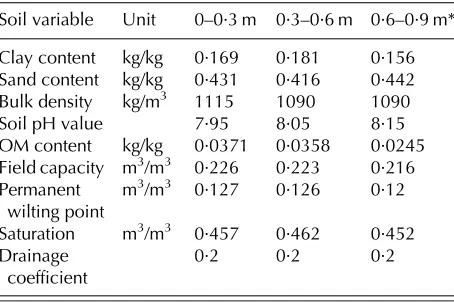
[image:5.595.49.276.98.249.2]wherei= 1 : 2,j= 1 : 4,k= 1 : 3 andl= 1 :n, withn varying by crop and response variable. Crop stage is not relevant for crop residues. The boundary given by Table 2. Soil information input into the EU-Rotate_N
model
Soil variable Unit 0–0·3 m 0·3–0·6 m 0·6–0·9 m*
Clay content kg/kg 0·169 0·181 0·156
Sand content kg/kg 0·431 0·416 0·442
Bulk density kg/m3 1115 1090 1090
Soil pH value 7·95 8·05 8·15
OM content kg/kg 0·0371 0·0358 0·0245
Field capacity m3/m3 0·226 0·223 0·216
Permanent wilting point
m3/m3 0·127 0·126 0·12
Saturation m3/m3 0·457 0·462 0·452
Drainage
coefficient 0·2 0·2 0·2
Table 3. Management data for the crops in the four rotations, including sowing/transplanting dates, total amount of irrigation and number of irrigation events, target yield, N concentration in transplant, dry weight of transplant, row width and plant spacing, as used as input information for the
EU-Rotate_N model
Rotation and crop
Sowing/Transplant
date Harvest date
Irrigation amount mm
No. irrigation events
Dry matter target yield t/ha
Sown/ Transplanted
N in transplants g/100 g
Dry weight at transplanting kg/ha
Row
width m Spacing m
Rotation 1
Broccoli 14 November 2003 29 March 2004 18·0 1 3·9 Transplanted 4·1 50·0 0·60 0·40
Lettuce 09 April 2004 9 June 2004 34·7 5 1·9 Transplanted 2·3 17·0 0·30 0·40
Fennel 17 September 04 8 February 2005 70·6 8 5·0 Transplanted 2·1 7·0 0·60 0·20
Spinach 08 April 2005 1 June 2005 57·0 3·5 Sown – – 0·30 0·05
Rotation 2
Lettuce 17 November 2003 5 April 2004 18·0 1 2·0 Transplanted 5·4 4·0 0·30 0·40
Cabbage 09 April 2004 23 June 2004 15·6 3 9·5 Transplanted 1·7 50·0 0·60 0·40
Spinach 04 October 2004 2 February 2005 105·1 12 2·0 Sown – – 0·30 0·05
Fennel 17 March 2005 05 July 2005 129·2 15 7·8 Transplanted 1·4 8·0 0·60 0·20
Rotation 3 Transplanted
Fennel 14 November 2003 24 May 2004 22·1 2 8·9 Transplanted 2·1 8·7 0·60 0·20
Spinach 01 July 2004 11 August 2004 204·6 24 2·8 Sown – – 0·30 0·05
Cabbage 15 September 2004 14 December 2004 40·6 6 4·9 Transplanted 1·9 19·9 0·60 0·40
Lettuce 16 March 2005 26 May 2005 57·1 9 3·3 Transplanted 1·0 8·7 0·30 0·40
Rotation 4
Spinach 18 November 2003 24 March 2004 4·5 1 2·0 Sown – – 0·30 0·05
Fennel 31 March 2004 5 July 2004 36·8 7 5·9 Transplanted 2·2 10·0 0·60 0·20
Lettuce 15 September 2004 6 December 2004 68·5 7 2·0 Transplanted 1·7 13·0 0·30 0·40
Cabbage 15/ March 2005 21 June 2005 135·8 16 9·6 Transplanted 2·0 50·0 0·60 0·40
6
C.
N
endel
et
the 95% confidence interval of the difference relative to zero was considered for assessing model adequacy at each experimental condition, with intervals includ-ing zero, showinclud-ing a prediction error not larger than the experimental error of the mean estimates. The ANOVA also allows an assessment of the respective impact of the experimental factors on the adequacy of predic-tions. Data analyses were performed with the R software environment (R Development Core Team 2011), using functions of the contributed packages hydroGOF (Zambrano-Bigiarini2010) for computing the summary statistics and ggplot2 (Wickham 2009) for graphical displays.
RESULTS
Above-ground biomass
Dry matter yield varied by crop species between averages of 1·6 t/ha for spinach and 6·4 t/ha for white cabbage and was considerably higher for spring– summer crops, 4·1 t/ha on average v. 3·2 t/ha for autumn–winter crops, with seasonal differences for crops of the same species largest for cabbage (Table 4). Dry matter generally increased for most crops, as expected, with N treatments N1 and N2 compared with N0, with little or no increase between N1 and N2, given the relatively minor difference between the respective input levels (Table 4). White cabbage in the first rotation, fennel in the fourth and lettuce in the first and fourth showed little benefit from N input, but only the autumn–winter fennel in the first rotation and the spring–summer spinach in the third did not show a positive response to N input, because of partial failure. The average increase across rotation of above-ground dry matter for the higher N input was 32% for lettuce, 28% for fennel, 22% for spinach and 78% for white cabbage, while a 130% increase was observed for the single crop of broccoli. The average increase by rotation across crops was 40% for the cold season (autumn–winter) and 51% for the warm season (spring–summer).
In terms of the summary measures, model predic-tions of biomass growth and yield were better for white cabbage, lettuce and broccoli, with little overall bias (MAE = 0·15–0·34 t/ha) and high correlation indices (d= 0·97–0·99; EF = 0·88–0·96) (Table 5). Predictions of fennel dry matter were only slightly less accurate, while those for spinach were positively biased.
The prediction bias for the dry matter yield of broccoli is within the confidence band at the initial
stages for all N treatments and at the final stage for N1 and N2, because of the large coefficient of variation for this crop, yet an intermediate stage for N1 and N2 and the final stage for N0 are over-predicted (Fig. 2). The ANOVA for white cabbage gives an assessment of the goodness of fit that is rather less optimistic than the summary statistics, due to the relatively low coefficient of variation compared with the other crop species, showing substantial under-prediction for N0 in the advanced crop stages in rotations 1 and 2 and for N1 and N2 in the pre-final stages in rotation 3. Predictions for fennel dry matter show a similar pattern in the first three rotations, with some intermediate or late stages biased upward for N1 and N2 and downward for N0; for the last crop fewer points were observed and the model under-predicts N0 more than N1 and N2. Lettuce dry matter is predicted fairly well for N1 and N2 in all rotations and for N0 in the first two rotations; only the later stages of N0 are under-predicted in rotations 3 and 4. Predictions of spinach dry matter are good for the autumn–winter crops (rotations 2 and 4), but tend to diverge with crop stage for the spring– summer crops, to upward bias for N1 and N2 and downward bias for N0.
Crop residues
Crop residues were higher for broccoli and fennel, both in absolute terms and relative to above-ground biomass (70 and 50%, respectively) and lower for spinach and lettuce (30 and 20%, respectively), high in absolute and low in relative terms (20%) for cabbage and tended to increase with increasing N input
(Table 4). Average increase by crop species ranged
from 24% for fennel to 116% for broccoli, but some crops of each species apart from broccoli showed little increase (cabbage in rotation 3, lettuce in rotation 1 and fennel in rotations 1 and 4) or decrease (lettuce in rotation 4 and spinach in rotation 3). Averaged by rotation and season across crops, residues increased with the higher N input (N2) by 42% for both autumn– winter and spring–summer crops.
Summary statistics show better prediction of fennel and broccoli residues, with slight negative bias for the first and positive bias for the second (Table 5). The correlation indices for cabbage, lettuce and spinach, particularly the EF coefficient, point to a poor overall fit, though the average bias is large and positive, only for cabbage.
Table 4. Means of observed (O) and model-predicted minus observed (P–O) values for above-ground and crop residue biomass for five crops at three N input treatments (N, none; N1, recommended rate and N2, farmer’s practice rate) in four rotations
Rotation, season and crop
Above-ground dry matter (t/ha) Residue dry matter (t/ha)
N0 N1 N2
S.E.D.
N0 N1 N2
S.E.D.
O P–O O P–O O P–O O P–O O P–O O P–O
Broccoli
1-AW 1·6 1·0 3·6 0·0 3·8 −0·1 0·24 1·15 0·8 2·4 0·3 2·5 0·4 0·19
White cabbage
2-SS 4·4 −1·7 8·9 −0·3 9·1 −0·2 0·8 −0·1 1·5 0·7 1·7 0·5
3-AW 4·4 −1·6 4·4 0·1 4·7 0·0 0·8 0·0 0·8 0·3 0·8 0·4
4-SS 3·8 0·7 9·5 −0·2 8·8 0·6 0·7 0·5 1·4 0·9 1·4 1·0
Mean 4·2 −0·8 7·6 −0·1 7·5 0·1 0·25(0·14) 0·8 0·1 1·2 0·6 1·3 0·6 0·10(0·06)
Lettuce
1-AW 1·5 −0·2 1·8 0·2 1·6 0·3 0·5 −0·1 0·5 −0·1 0·5 0·2
2-SS 1·2 0·2 1·6 0·4 1·9 0·1 0·2 0·2 0·3 0·0 0·3 0·0
3-AW 1·6 −1·0 2·9 0·1 2·6 0·5 0·3 0·1 0·6 −0·2 0·6 −0·2
4-SS 1·6 −0·8 1·8 0·0 1·8 0·1 0·5 0·1 0·5 −0·2 0·4 −0·1
Mean 1·5 −0·5 2·0 0·2 2·0 0·3 0·09(0·04) 0·4 0·1 0·5 −0·1 0·5 0·0 0·03(0·02)
Fennel
1-SS 4·9 −1·5 4·9 0·1 4·9 0·1 2·6 −0·8 2·8 −0·2 2·9 −0·3
2-AW 3·9 −1·0 7·5 0·1 6·8 0·9 1·7 −0·2 3·8 0·2 3·2 0·8
3-SS 4·9 −0·8 6·2 1·8 6·9 1·6 2·9 −0·7 3·8 0·3 4·1 0·4
4-AW 4·8 −3·4 4·9 0·7 5·1 0·6 2·3 −1·6 2·2 0·7 2·5 0·5
Mean 4·6 −1·7 5·9 0·7 5·9 0·8 0·43(0·22) 2·4 −0·8 3·2 0·2 3·2 0·3 0·24(0·12)
Spinach
1-SS 1·8 −0·5 2·3 1·3 2·7 0·9 0·6 −0·2 0·7 0·2 0·9 −0·1
2-AW 1·1 −0·2 1·6 0·4 1·6 0·4 0·4 −0·1 0·5 0·0 0·5 0·0
3-SS 1·8 −1·2 1·1 1·3 1·2 1·4 0·5 −0·3 0·4 0·2 0·4 0·3
4-AW 1·1 0·3 1·6 0·1 1·6 0·1 0·2 0·2 0·4 0·0 0·3 0·0
Mean 1·5 −0·4 1·6 0·8 1·8 0·7 0·19(0·09) 0·4 −0·1 0·5 0·1 0·6 0·0 0·08(0·04)
AW, autumn–winter; SS, spring–summer;S.E.D., standard error of difference among means for N treatment × rotation; in parenthesis, for N treatment.
8
C.
N
endel
et
negative to positive between N0 and N1, though mostly remaining within the confidence interval, and for the cabbage crops, where the tendency is similar, but residues for rotations 2 and 4 are over-predicted
(Table 4andFig. 3). The ANOVA of prediction error,
although confirming poor predictions for cabbage residues, shows a better agreement than the summary indices for spinach and lettuce, even if the coefficient of variation of residues for these crops were smaller (less tolerant of deviations) compared with those for broccoli and fennel, which score higher correlation indices.
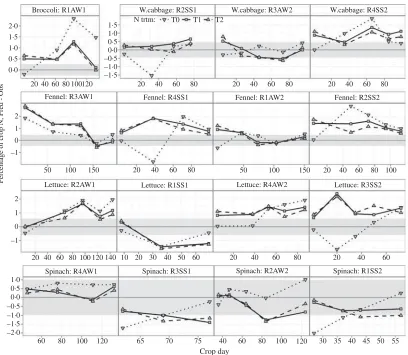
Crop N concentration
Average N concentration in plants, on a dry weight basis, varied among crop species from 3% for fennel
and cabbage, 3·4% for lettuce, 3·9% for broccoli and 4·7% for spinach and was slightly higher for spring– summer crops (3·7%) compared with autumn–winter crops (3·5%), as shown inTable 6. Positive N inputs generally increased N concentration, on average by between 9% for spinach and 32% for fennel, but with considerable variation among individual crops: the largest increase (96%) was recorded for the autumn– winter crop of fennel in rotation 2; the lowest (6%) for the spring–summer crop of spinach of rotation 3.
[image:9.595.57.523.108.482.2]Summary statistics for crop N show a reasonably good fit of model predictions for white cabbage, with a moderate positive bias (10%), over-prediction for broccoli, lettuce and fennel and under-prediction for spinach (Table 5). Cabbage N is over-predicted for the spring–summer crop in rotation 4 and under-predicted for the early stages of N0 in rotation 1 (Fig. 4). Table 5. Summary statistics of goodness-of-fit of EU-Rotate_N predictions for above-ground biomass, crop residues, biomass N concentration, N uptake by crops and soil mineral N (as NO3-N) within the top 0·6 m soil
for four biannual rotations of four vegetable crops at three N input treatments in South Italy
Variable and crop ME (mod–obs) PBIAS MAE Willmott’sd EF
Above-ground dry matter (t/ha)
Broccoli 0·31 34·7 0·32 0·97 0·87
White cabbage −0·28 −11·5 0·34 0·99 0·96
Fennel 0·16 8·3 0·61 0·96 0·82
Lettuce −0·06 −8·3 0·15 0·97 0·88
Spinach 0·17 21·9 0·38 0·87 0·36
Crop residues dry matter (t/ha)
Broccoli 0·49 24·6 0·49 0·77 0·22
White cabbage 0·45 41·1 0·49 0·73 −1·39
Fennel −0·09 −2·9 0·55 0·85 0·05
Lettuce −0·03 −8 0·13 0·48 −0·6
Spinach 0·01 1·6 0·14 0·75 −0·02
Biomass N concentration (%)
Broccoli 0·76 19·5 0·80 0·45 −2·23
White cabbage 0·30 9·5 0·53 0·92 0·71
Fennel 0·78 25·6 0·96 0·74 −0·30
Lettuce 0·65 19·3 1·05 0·74 −0·27
Spinach −0·34 −7·3 0·66 0·59 −0·58
N uptake by crops (kg/ha)
Broccoli 19·63 55 20·18 0·93 0·72
White cabbage 0·03 0 16·93 0·97 0·89
Fennel 18·05 32·9 24·81 0·93 0·64
Lettuce 2·41 10·6 9·35 0·93 0·67
Spinach 2·34 6·6 11·76 0·92 0·71
Soil mineral N content (kg/ha)
Broccoli −17·8 −14·7 34·93 0·8 0·36
White cabbage −80·2 −63·2 87·86 0·45 −0·13
Fennel −49·6 −44·6 53·51 0·83 0·54
Lettuce −76·9 −52·3 83·24 0·64 −0·02
Broccoli: R1AW1 W.cabbage: R2SS1 W.cabbage: R3AW2 W.cabbage: R4SS2
Fennel: R4SS1
Fennel: R3AW1 Fennel: R1AW2 Fennel: R2SS2
Lettuce: R2AW1 Lettuce: R1SS1 Lettuce: R4AW2 Lettuce: R3SS2
Spinach: R3SS1
Spinach: R4AW1 Spinach: R2AW2 Spinach: R1SS2
2040 60 80 100120 20 40 60 80 20 40 60 80 20 40 60 80
40 50 60 70 80 90
50 100 150 50 100 40 60 80 100
20 40 60 80 100 120 140 10 20 30 40 50 60 20 40 60 80 20 40 60
60 80 100 120 30 35 40 40 60 80 100 120 30 35 40 45 50 55
Crop day
0·5 N trtm: T0 T1 T2
0·0
–0·5
–1·0
–1·5
1 0 –1 –2 –3 1·0
0·5
0·5
0·0
–0·5
–1·0
0·5 1·0
0·0 –0·5 –1·0 0·0
Abo
v
[image:10.595.109.518.64.421.2]e-ground dry matter (t/ha), Pred - Obs
Fig. 2. EU-Rotate_N prediction error for above-ground dry matter biomass by crop stage, nitrogen treatments (N0,
unfertilized control; N1, average recommended rate and N2, assumed average farmer’s practice), rotations (R1 to R4) and
seasons (AW, autumn–winter and SS, spring–summer). The confidence interval of the difference is shifted as a
grey-coloured band around zero.
Broccoli
Residue DM (t/ha), Pred - Obs
1·0
0·5
0·0
–0·5
–1·0
–1·5
AW1 AW2
AW2
SS1
AW1 AW1
AW2
AW2 SS2
SS2 SS1 SS2
N0 N1 N2 N0 N1 N2 N0 N1 N2
N treatment
N0 N1 N2
R1 R2 R3 R4
N0 N1 N2 Rotation:
SS1 SS2
SS1
W.cabbage Fennel Lettuce Spinach
AW1
Fig. 3. EU-Rotate_N prediction error for dry matter of crop residues by nitrogen treatment (N0, unfertilized control;
N1, average recommended rate and N2, assumed average farmer’s practice), rotations (R1 to R4) and seasons (AW,
autumn–winter and SS, spring–summer). The confidence interval of the difference is shifted as a grey-coloured band around
zero.
[image:10.595.89.535.515.672.2]Predictions of fennel N are rather good for the autumn– winter crop in rotation 1, but biased upward in the other rotations, except for a good agreement in the final stage of the autumn–winter crop in rotation 3 and a downward bias for N0 in rotation 4. Predictions for lettuce N are mostly positively biased, except for early crop stages, the spring–summer crop of rotation 1 and the N0 treatment of rotation 3. Spinach N is predicted quite well for the autumn–winter crop of rotation 4 and not too badly for the corresponding crop of rotation 2, but under-predicted for spring–summer crops, in rotation 3 more than in rotation 1.
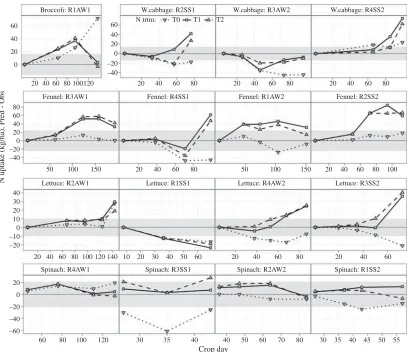
Crop N uptake
Nitrogen uptake by crops was substantially higher for broccoli, cabbage and fennel than for spinach and
lettuce. With no N input, average uptake by crop species varied from 42 kg/ha for lettuce to 88 kg/ha for cabbage (Table 6). Uptake was higher in spring– summer compared with autumn–winter crops for lettuce, spinach and rotations 1 and 2 of cabbage, but lower for fennel. Except for the spring–summer crop of spinach in rotation 3, which did not succeed very well and showed decreasing N uptake with N fertilization, positive N input resulted in large increase in N uptake, ranging from 24% for the fennel crop in rotation 1 to 300% for the crop of the same species in rotation 2. The N input increase between N1 and N2 resulted in a moderate increase of N uptake for most crops, between 3 and 22%.
[image:11.595.50.523.109.468.2]Nitrogen uptake values were derived from above-ground dry matter and crop N concentration values and model predictions for this trait show an accuracy Table 6. Means of observed (O) and model-predicted minus observed (P–O) values for N concentration in above-ground biomass and crop N uptake for five crops at three N input treatments (N0, none; N1,
recommended rate and N2, farmer’s practice rate) in four rotations.
Rotation, season and crop
Biomass N concentration (%) Crop N uptake (kg/ha)
N0 N1 N2
S.E.D.
N0 N1 N2
S.E.D.
O P–O O P–O O P–O O P–O O P–O O P–O
Broccoli
1-AW 3·4 1·1 4·1 0·6 4·2 0·6 0·06 43 72 150 3 160 −3 12·2
White cabbage
2-SS 2·4 −0·3 3·0 0·4 3·2 0·2 74 −18 208 42 228 27
3-AW 3·5 0·0 4·0 −0·1 4·1 −0·1 131 −45 164 −8 171 −10
4-SS 2·2 0·7 2·7 0·9 2·9 0·8 61 23 188 74 204 62
Mean 2·7 0·2 3·2 0·4 3·4 0·3 0·09(0·05) 88 −13 186 36 201 26 6·7(3·9)
Lettuce
1-AW 3·3 −0·7 3·5 −0·8 3·6 −0·8 50 −17 71 −24 66 −19
2-SS 3·7 1·1 4·1 0·9 4·3 0·8 31 27 55 29 67 19
3-AW 2·5 −0·2 3·1 1·2 3·0 1·3 41 −21 82 36 80 41
4-SS 3·0 1·0 3·2 1·1 3·3 1·1 45 −8 55 25 57 25
Mean 3·1 0·3 3·5 0·6 3·5 0·6 0·08(0·04) 42 −5 66 17 68 16 4·7(2·4)
Fennel
1-SS 3·5 0·1 3·8 0·3 3·9 0·3 131 −13 144 32 162 14
2-AW 1·5 1·4 2·7 1·2 3·0 1·0 41 18 160 59 165 67
3-SS 2·9 0·6 3·3 1·0 3·5 1·0 85 0 146 33 171 42
4-AW 2·3 0·3 3·0 1·1 3·1 1·0 84 −46 128 62 144 47
Mean 2·6 0·6 3·2 0·9 3·4 0·8 0·06(0·03) 85 −10 145 46 160 43 10·2(5·1)
Spinach
1-SS 4·4 −0·9 4·9 −0·6 5·0 −0·8 52 −15 92 13 112 −7
2-AW 4·4 0·3 4·9 −0·5 4·8 −0·4 36 −8 67 −3 71 −6
3-SS 4·7 −1·0 5·1 −1·1 5·0 −1·1 108 −26 74 6 67 23
4-AW 4·0 0·7 4·3 0·3 4·4 0·2 40 19 63 4 71 −3
Mean 4·4 −0·2 4·8 −0·5 4·8 −0·5 0·17(0·08) 59 −7 74 5 80 2 5·6(2·8)
AW, autumn–winter; SS, spring–summer;S.E.D., standard error of difference among means for N treatment × rotation; in
intermediate between those for the component traits, with good proportionality between predictions and observation (d in the range 0·92–0·97) and average efficiency of prediction (EF in the range 0·64–0·89), but positive bias for broccoli, fennel, lettuce and spinach
(Table 5). Overall, white cabbage shows the best
summary statistics for this trait, followed by lettuce and spinach.
The error of prediction shows different trends in relation to crop stages among N input treatments and rotations, with a tendency to over-prediction for positive N fertilizer inputs in many crops (Fig. 5). Nitrogen uptake at the later stages of the spring– summer crops of cabbage (rotations 2 and 4) is over-predicted, particularly for N1 and N2 treatments, while there is a tendency to under-predict for the same stages in the autumn–winter crop of rotation 3. Prediction of N uptake of broccoli is positively
biased at an advanced stage for all N input treatments, but only for N0 at the final stage. Fennel N uptake is predicted fairly well for the N0 treatment but over-predicted for N1 and N2 in later crop stages in the first three rotations, while in the fourth for these treatments there is under-prediction at the advanced intermediate stage and over-prediction at the last, where the prediction for N0 is biased downward. For lettuce predictions are better in rotations 1 and 2, though not in the final crop stage; in rotation 1 the bias increases with crop stage and is negative for all N treatments; the same tendency is showed by the crop of rotation 4, but the bias is negative for N0 and positive for N1 and N2. Apart from the spring– summer crop of rotation 3, where N uptake of spinach is under-predicted for N0, there are few significant points of bad prediction for this trait in the other spinach crops.
Broccoli: R1AW1
Fennel: R4SS1 Fennel: R3AW1
2·0 1·5
1·0 0·5 0·0 –0·5 –1·0 –1·5 1·5
1·0
0·5 0·0
20 20 40 60 80 20 40 60 80 20 40 60 80
20
20 40 60 80 100 120 140 10 20 30 40 50 60 20 40 60 80 20 40 60
50 2
1
0
–1
Percentage of crop N, Pred - Obs
2
1
0
1·0 0·5 0·0 –0·5 –1·0 –1·5 –2·0 –1
100 150 40 60 80 50 100 150 20 40 60 80 100
60 80 100 120 65 70 75 40 60 80 100 120 30 35 40 45 50 55
40 60 80 100120
Lettuce: R2AW1
Spinach: R3SS1
Spinach: R4AW1 Spinach: R2AW2
Crop day
Spinach: R1SS2
Lettuce: R1SS1 Lettuce: R4AW2 Lettuce: R3SS2
Fennel: R1AW2 Fennel: R2SS2
W.cabbage: R2SS1
N trtm: T0 T1 T2
[image:12.595.109.517.65.420.2]W.cabbage: R3AW2 W.cabbage: R4SS2
Fig. 4. EU-Rotate_N prediction error for biomass N concentration by crop-stage, nitrogen treatment (N0, unfertilized
control; N1, average recommended rate and N2, assumed average farmer’s practice), rotations (R1 to R4) and seasons (AW,
autumn–winter and SS, spring–summer). The confidence interval of the difference is shifted as a grey-coloured band around
zero.
Soil mineral N
Soil mineral N content in the 0–0·6 m layer, deter-mined before planting and application of fertilizer and at harvest time, was obviously influenced by the N fertilizer inputs as the rotation progressed: relative to the level for N0, the available soil N at crop start increased on average by 32% with N1 and by 50% with N2, while the reduction on the pre-cropping level due to cultivation averaged 58, 30 and 23% for N0, N1 and N2, respectively (Table 7). High amounts of soil mineral N were available at the start of the autumn– winter crops of the third cycle: fennel in rotation 1, spinach in rotation 2, cabbage in rotation 3 and lettuce in rotation 4, in proportion to the N input treatment. At harvest, however, the levels of soil N for these crops were not much different from those found in other cycles. For the spring–summer crops of lettuce in rotations 1 and 3 and of spinach in rotation 3 the
end-crop level of soil N was considerably above the start level with the N1 and N2 input treatments. Such unbalances may have been due to enhanced miner-alization.
Goodness-of-fit statistics show that the model under-predicted soil N for all crop species and particularly for spinach, cabbage and lettuce, but proportional agree-ment, as measured by Willmott’sdand EF, were not so bad for fennel and broccoli (Table 5). The ANOVA of prediction error shows that the inadequacies of predictions for cabbage and fennel were determined only by the very high soil N level at the start of these autumn–winter crops (rotations 3 and 1, respectively), the agreement for the other rotations being quite good
(Fig. 6). Predictions for lettuce were affected by the
same downward bias of high soil N levels at the start of rotation 4, while it is the end-crop stage to be under-predicted for the spring–summer crop of rotation 3. The problem was similar for spinach in rotations 2
Broccoli: R1AW1 W.cabbage: R2SS1 N trtm: T0 T1 T2
W.cabbage: R3AW2 W.cabbage: R4SS2
Fennel: R3AW1 Fennel: R4SS1 Fennel: R1AW2 Fennel: R2SS2
Lettuce: R2AW1 Lettuce: R1SS1 Lettuce: R4AW2 Lettuce: R3SS2
Spinach: R4AW1 Spinach: R3SS1 Spinach: R2AW2 Spinach: R1SS2 60
40
20
0
20 40 60 80 20 40 60 80
20
10 30 40 50 60 20 40 60 80 20 40 60
20 40 60 80 20 40 60 80
100120
20 40 60 80 100 120 140
50 100 150 20 40 60 80
60 80 100 120 30 35 40 40
Crop day
50 60 70 80 30 35 40 45 50 55 50 100 150 20 40 60 80 100 60
40 20 0 –20 –40
80 60 40 20
N uptak
e (kg/ha), Pred - Obs –20–40 0
40 30
10
–10 –20 0
20
–20
–40
[image:13.595.83.492.65.417.2]–60 0 20
Fig. 5. EU-Rotate_N prediction error for crop N uptake by crop-stage, nitrogen treatment (N0, unfertilized control; N1,
average recommended rate and N2, assumed average farmer’s practice), rotations (R1 to R4) and seasons (AW, autumn–
and 3, respectively; in addition, the start-crop levels were under-predicted also for the second spring– summer crop in rotation 1, while predictions were rather good for the first autumn–winter crop in rota-tion 4.
DISCUSSION
General model performance
The overall pattern of simulation results obtained using the EU-Rotate_N model under Mediterranean con-ditions are comparable to those achieved with other, well-established simulation models in international model comparisons (Kersebaumet al.2007; Palosuo et al.2011), in that crop variables were simulated with higher accuracy than the soil variables. Above-ground
[image:14.595.76.546.109.459.2]dry matter biomass predictions were almost unbiased and deviated little from the observed values, as did the simulations of crop residue biomass. Predictions of the N concentration in the above-ground biomass and, correspondingly, the total N uptake during the growth season were slightly over-predicted, for the latter to a greater extent at later crop stages of some crops. However, the model did reflect very well both the low initial N concentrations of the transplant, which were raised at low N supply for better root development in the juvenile phase, and the high N concentrations at later stages, which express luxury consumption of N above the critical concentration for the respective growth stage. Soil mineral N content was under-predicted substantially for six observations, otherwise it was modelled satisfactorily. Four of the observations occurred in late summer 2004, at the start of autumn Table 7. Means of observed (O) and model-predicted minus observed (P–O) for soil mineral N content in the top 0·6 m by crops at the start and end of the cropping cycle for five crops at three N input treatments (N0, none; N1, recommended rate and N2, farmer’s practice rate) in four rotations
Rotation, season and crop
N0 N1 N2
Start End Start End Start End
O P–O O P–O O P–O O P–O O P–O O P–O S.E.D.
Broccoli
1-AW 153 −25 44 −36 153 −25 101 −9 153 −25 117 14 43·5
White cabbage
2-SS 46 −27 29 −20 56 2 50 3 74 0 93 21
3-AW 225 −189 47 −38 489 −426 130 −60 545 −456 208 −106
4-SS 42 −30 56 −47 44 −30 55 −34 42 −26 54 20
Mean 104 −82 44 −35 196 −152 78 −30 220 −161 118 −21 18·9(10·9)
Lettuce
1-AW 44 −36 94 −59 101 −10 277 −74 117 13 399 −139
2-SS 122 −30 46 −33 122 −30 56 −5 122 −30 74 −6
3-AW 49 −46 56 −24 57 −55 271 −213 65 −62 356 −264
4-SS 190 −169 58 −40 280 −217 97 −38 348 −232 126 −49
Mean 101 −70 63 −39 140 −78 175 −82 163 −78 239 −114 41·9(20·9)
Fennel
1-SS 284 −207 38 −31 375 −134 47 −34 562 −266 61 −46
2-AW 44 −38 25 −15 52 −48 37 −23 51 −47 57 −9
3-SS 127 1 52 −45 127 1 72 −65 127 1 72 −65
4-AW 54 −43 53 −42 61 7 111 −58 64 27 116 −11
Mean 127 −72 42 −33 154 −44 67 −45 201 −71 76 −33 23·5(11·7)
Spinach
1-SS 120 −113 41 −25 148 −139 93 −24 134 −124 116 −14
2-AW 196 −165 26 −13 303 −222 45 −18 380 −237 41 −8
3-SS 52 −45 127 −100 72 −65 346 −291 72 −64 378 −296
4-AW 108 −11 54 −43 108 −11 61 8 108 −11 64 28
Mean 119 −83 62 −46 158 −109 136 −81 173 −109 150 −73 21·3(10·7)
AW, autumn–winter; SS, spring–summer; S.E.D., standard error of difference among means for N treatment × rotation; in
crops (fennel in the first rotation, spinach in the second, white cabbage in the third and lettuce in the fourth) and followed a warm and dry period of about 2 months, which may have considerably enhanced mineralization from organic N sources above the rate considered in the model for the reference climate
(Fig. 1). Moreover, the short-lived spinach crops could
have left unused soil N, which contributed to the large amount measured at the start of the following crops.
The other two observations were the harvest of late spring crops (spinach in the first rotation and lettuce in the third). Both species prefer a colder environment and are less suitable for late spring, where the cropping cycle tend to be shortened; in addition, the weather at the end of these crop cycles was already favourable for high N mineralization rates; so it is possible that less nitrogen uptake and higher mineralization contributed to a build-up of excess soil mineral N.
Taking account of this, the results obtained with EU-Rotate_N are well in the range of those obtained with other simulation models for arable crops (Kersebaum et al. 2007), with the additional difficulty of being recalibrated neither for the simulated site nor for the simulated crops (Palosuoet al.2011; Rötteret al. 2012). Furthermore, the results obtained under Mediterranean conditions were of a similar quality to those obtained under Central and Northern European conditions (Rahnet al.2010).
Specific problems with the modelled system
The most obvious problem with the simulation of the Italian crop rotations was the fact that the model did not predict the high levels of soil mineral N for the six observations during the late summer of 2004 discussed above. The site history included vegetable crops with
100
0
–100
0 50
–50 –100
Soil N (as NO
3
) kg/ha), Pred - Obs –150 –200
–100
–200 0
–100
–200 0 100 –250
0
–100 –200
–300 –400
N0 N1 N2 N0 N1 N2 N0 N1 N2 N0 N1 N2
N0 N1 N2 N0 N1 N2 N0 N1 N2 N0 N1 N2
N0 N1 N2 N0 N1 N2 N0 N1 N2 N0 N1 N2
N0 N1 N2 N0 N1 N2 N0 N1 N2 N0 N1 N2
N treatment
Broccoli: R1AW1 W.cabbage: R2SS1 W.cabbage: R3AW2 W.cabbage: R4SS2
Fennel: R3AW1 Fennel: R4SS1 Fennel: R1AW2 Fennel: R2SS2
Lettuce: R2AW1 Lettuce: R1SS1 Lettuce: R4AW2 Lettuce: R3SS2
Spinach: R4AW1 Spinach: R3SS1 Spinach: R2AW2 Spinach: R1SS2
[image:15.595.84.493.66.419.2]Stage: start end
Fig. 6. EU-Rotate_N prediction error for N content (as NO3-N) in the top 0·6 m soil layer by crop-stage, nitrogen treatment
(N0, unfertilized control; N1, average recommended rate and N2, assumed average farmer’s practice), rotations (R1 to R4)
and seasons (AW, autumn–winter and SS, spring–summer). The confidence interval of the difference is shifted as a
frequent catch crops of sunflower or broad beans for several years after conversion from a citrus orchard and this management could have contributed to the large amount of soil organic matter (0·035 kg/kg). The organic carbon content of the arable soil layer in the site area (Sele Plain) has been found to vary by soil district (24 districts) from 0·007 to 0·050 kg/kg, with an interquartile range of 0·009–0·016 and a median of 0·012 kg/kg (observed in the region of Campania in 2002), so the experimental soil is unusually rich in organic carbon. However, the soil itself, which at the start of the experiment showed a C : N ratio of 10, cannot explain the high rates of N release observed, if common rate coefficients and temperature–moisture impact relations obtained from laboratory incubations are assumed (Sierra1997; Crohn & Valenzuela-Solano 2003). Nevertheless, increase of soil mineral N of more than 10 g N/m2within 3 months from late summer to early August 2004 were observed consistently in the control treatments and, correspondingly, increase of up to 30 g N/m2 were observed in the respective fertilized treatments. The latter values cannot be ex-plained either with the model or with current knowl-edge on organic matter decomposition. However, they are mainly responsible for the poor simulation result of this variable. Further work needs to be done to allow EU-Rotate_N to take account of these extreme conditions but in the meantime simulations can be adjusted by updating simulations with measured values where these errors are likely or the model can be pre-calibrated by adjusting the N turnover par-ameters.
In conclusion, the ability of the EU-Rotate_N model to simulate crops grown under Mediterranean con-ditions was broadly comparable with simulations obtained using Northern European data. In general, crop growth and N uptake patterns were well predicted; non-marketable yields less well. Soil N mineralization may not be well simulated in this particular instance, affecting the accuracy of predic-tion of soil mineral N. However, soil mineral N values can be updated with measured values in the model on a seasonal basis to overcome this problem. Vegetable production systems, with their higher turnover of organic matter and higher use of fertilizer N, pose considerable problems to crop modellers. In the light of not being calibrated prior to this exercise, the simulations results show the potential of the EU-Rotate_N model for use in vegetable rotations under warm and dry conditions of a Mediterranean climate.
The authors acknowledge funding from the EU Quality of Life Programme which supported the development of the EU-Rotate_N simulation model within the project QLK5-2002-01100 co-ordinated by C. Rahn at Warwick University. C. Nendel was additionally funded by ZALF budget funds.
REFERENCES
AGOSTINI, F., TEI, F., SILGRAM, M., FARNESELLI, M., BENINCASA, P. &
ALLER, M. F. (2010). Decreasing nitrate leaching in
vegetable crops with better N management. InGenetic
Engineering, Biofertilisation, Soil Quality and Organic Farming (Ed. E. Lichtfouse), pp. 147–200. Sustainable
Agriculture Reviews 4. Dordrecht, NL: Springer.
ALLEN, R. G., PEREIRA, L. S., RAES, D. & SMITH, M. (1998).Crop
Evapotranspiration. Guidelines for Computing Crop Water Requirements. FAO Irrigation and Drainage Paper 56. Rome: FAO.
CAO, L. K., CHEN, G. J. & LU, Y. T. (2005). Nitrogen leaching in
vegetable fields in the suburbs of Shanghai.Pedosphere
15, 641–645.
CAVERO, J., PLANT, R. E., SHENNAN, C., FRIEDMAN, D. B.,
WILLIAMS, J. R., KINIRY, J. R. & BENSON, V. W. (1999).
Model-ing nitrogen cyclModel-ing in tomato-safflower and tomato-wheat
rotations.Agricultural Systems60, 123–135.
CREWS, T. E. & PEOPLES, M. B. (2005). Can the synchrony of
nitrogen supply and crop demand be improved in legume
and fertilizer-based agroecosystems? A review. Nutrient
Cycling in Agroecosystems72, 101–120.
CROHN, D. M. & VALENZUELA-SOLANO, C. (2003). Modeling
temperature effects on decomposition. Journal of
Environmental Engineering129, 1149–1156.
DE PAZ, J. M. & RAMOS, C. (2004). Simulation of nitrate
leaching for different nitrogen fertilization rates in a region of Valencia (Spain) using a GIS-GLEAMS system. Agriculture Ecosystems and Environment103, 59–73.
DUSENBURY, M. P., ENGEL, R. E., MILLER, P. R., LEMKE, R. L. &
WALLANDER, R. (2008). Nitrous oxide emissions from a
northern great plains soil as influenced by nitrogen
man-agement and cropping systems.Journal of Environmental
Quality37, 542–550.
GALLARDO, M., THOMPSON, R. B., LOPEZ-TORAL, J. R.,
FERNANDEZ, M. D. & GRANADOS, R. (2006). Effect of applied
N concentration in a fertigated vegetable crop on soil
solution nitrate and nitrate leaching loss. In Acta
Horticulturae (ISHS): Proceedings of the International Symposium towards Ecologically Sound Fertilisation Strategies for Field Vegetable Production700, 221–224.
GREENWOOD, D. J. (2001). Modeling N-response of field
vegetable crops grown under diverse conditions with
N_ABLE: a review. Journal of Plant Nutrition24, 1799–
1815.
GREENWOOD, D. J., RAHN, C. R., DRAYCOTT, A.,
VAIDYANATHAN, L. V. & PATERSON, C. (1996). Modelling and
measurement of the effects of fertilizer-N and crop residue
incorporation on N-dynamics in vegetable cropping.Soil
GUERTAL, E. A. (2009). Slow-release nitrogen fertilizers
in vegetable production: a review. Horttechnology 19,
16–19.
GUO, R. Y., NENDEL, C., RAHN, C. R., JIANG, C. G. & CHEN, Q.
(2010). Tracking nitrogen losses in a greenhouse crop rotation experiment in North China using the EU-Rotate_N
simulation model. Environmental Pollution 158, 2218–
2229.
HALVORSON, A. D., BARTOLO, M. E., REULE, C. A. & BERRADA, A.
(2008). Nitrogen effects on onion yield under drip
and furrow irrigation. Agronomy Journal 100, 1062–
1069.
HANSEN, S., JENSEN, H. E., NIELSEN, N. E. & SVENDSEN, H. (1991).
Simulation of nitrogen dynamics and biomass production in winter-wheat using the Danish simulation-model
DAISY.Fertilizer Research27, 245–259.
JACKSON, L. E. (2000). Fates and losses of nitrogen from a
nitrogen-15-labeled cover crop in an intensively managed
vegetable system.Soil Science Society of America Journal
64, 1404–1412.
JENSEN, L. S., SALO, T., PALMASON, F., BRELAND, T. A.,
HENRIKSEN, T. M., STENBERG, B., PEDERSEN, A., LUNDSTRÖM, C.
& ESALA, M. (2005). Influence of biochemical quality on C
and N mineralisation from a broad variety of plant
materials in soil.Plant and Soil273, 307–326.
KERSEBAUM, K. C., HECKER, J.-M., MIRSCHEL, W. &
WEGEHENKEL, M. (2007). Modelling water and nutrient
dynamics in soil-crop systems: a comparison of simulation
models applied on common data sets. In Modelling
Water and Nutrient Dynamics in Soil-Crop Systems (Eds K. C. Kersebaum, J.-M. Hecker, W. Mirschel &
M. Wegehenkel), pp. 1–17. Dordrecht, NL: Springer.
LAFOLIE, F., BRUCKLER, L.,DECOCKBORNE, A. M. & LABOUCARIE, C.
(1997). Modeling the water transport and nitrogen
dynamics in irrigated salad crops.Irrigation Science17,
95–104.
LEENHARDT, D., LAFOLIE, F., BRUCKLER, L. &DECOCKBORNE, A. M.
(1998). Evaluating irrigation strategies for lettuce by
simu-lation: 2. Nitrogen budget.European Journal of Agronomy
8, 267–282.
LUGATO, E., PAUSTIAN, K. & GIARDINI, L. (2007). Modelling
soil organic carbon dynamics in two long-term
exper-iments of north-eastern Italy.Agriculture Ecosystems and
Environment120, 423–432.
MEI, B. L., ZHENG, X. H., XIE, B. H., DONG, H., ZHOU, Z. X.,
WANG, R., DENG, J., CUI, F., TONG, H. & ZHU, J. G. (2009).
Nitric oxide emissions from conventional vegetable
fields in southeastern China. Atmospheric Environment
43, 2762–2769.
MUHAMMETOGLU, A. & YARDIMCI, A. (2006). A fuzzy logic
approach to assess groundwater pollution levels below
agricultural fields.Environmental Monitoring and
Assess-ment118, 337–354.
NASH, J. E. & SUTCLIFFE, J. V. (1970). River flow forecasting
through conceptual models, Part I – A discussion of
principles.Journal of Hydrology10, 282–290.
NENDEL, C. (2009). Evaluation of best management practices
for N fertilisation in regional field vegetable production
with a small-scale simulation model.European Journal of
Agronomy30, 110–118.
NENDEL, C., SCHMUTZ, U., VENEZIA, A., PIRO, F. & RAHN, C. R.
(2009). Converting simulated total dry matter to fresh marketable yield for field vegetables at a range of nitrogen
supply levels.Plant and Soil325, 319–334.
PALOSUO, T., KERSEBAUM, K. C., ANGULO, C., HLAVINKA, P.,
MORIONDO, M., OLESEN, J. E., PATIL, R. H., RUGET, F.,
RUMBAUR, C., TAKÁCˇ, J., TRNKA, M., BINDI, M., CALDAG˘, B.,
EWERT, F., FERRISE, R., MIRSCHEL, W., SAYLAN, L., ŠIŠKA, B. &
RÖTTER, R. (2011). Simulation of winter wheat yield and its
variability in different climates of Europe. A comparison of
eight crop growth models.European Journal of Agronomy
35, 103–114.
PEDERSEN, A., ZHANG, K. F., THORUP-KRISTENSEN, K. & JENSEN, L. S.
(2010). Modelling diverse root density dynamics and deep
nitrogen uptake - A simple approach.Plant and Soil326,
493–510.
R DEVELOPMENT CORE TEAM (2011). R: A Language and Environment for Statistical Computing. Vienna, Austria: R Foundation for Statistical Computing.
RAHN, C. R., ZANG, K. F., LILLYWHITE, R. D., RAMOS, C.,
DOLTRA, J., DE PAZ, J. M., RILEY, H., FINK, M., NENDEL, C.,
THORUP-KRISTENSEN, K., PEDERSEN, A., PIRO, F., VENEZIA, A.,
FIRTH, C., SCHMUTZ, U., RAYNS, F. & STROHMEYER, K. (2010).
EU-Rotate_N–a European decision support system–to
predict environmental and economic consequences of the management of nitrogen fertiliser in crop rotations. European Journal of Horticultural Science75, 20–32.
RAMOS, C., AGUT, A. & LIDON, A. L. (2002). Nitrate leaching in
important crops of the Valencian Community region
(Spain).Environmental Pollution118, 215–223.
RINALDI, M., VENTRELLA, D. & GAGLIANO, C. (2007). Comparison
of nitrogen and irrigation strategies in tomato using CROPGRO model. A case study from Southern Italy. Agricultural Water Management87, 91–105.
RÖTTER, R. P., PALOSUO, T., KERSEBAUM, K. C., ANGULO, C.,
BINDI, M., EWERT, F., FERRISE, R., HLAVINKA, P., MORIONDO, M.,
NENDEL, C., OLESEN, J. E., PATIL, R., RUGET, F., TAKÁCˇ, J. &
TRNKA, M. (2012). Simulation of spring barley yield in
different climatic zones of Northern and Central Europe–a
comparison of nine crop models. Field Crops Research
133, 23–36.
SAXTON, K. E., RAWLS, W. J., ROMBERGER, J. S. & PAPENDICK, R. I.
(1986). Estimating generalized soil-water characteristics
from texture.Soil Science Society of America Journal50,
1031–1036.
SHAEFFER, D. L. (1980). Model evaluation methodology
applicable to environmental assessment models.
Ecological Modelling8, 275–295.
SIERRA, J. (1997). Temperature and soil moisture dependence
of N mineralization in intact soil cores.Soil Biology and
Biochemistry29, 1557–1563.
STANSKI, H. R., WILSON, L. J. & BURROWS, W. R. (1989).Survey
of Common Verification Measures in Meteorology. WMO World Weather Watch Technical Report 8, WMO/TD No. 358. Geneva, Switzerland: WMO. SUTTON, M. A., OENEMA, O., ERISMAN, J. W., LEIP, A., VAN
GRINSVEN, H. & WINIWARTER, W. (2011). Too much of a good
thing.Nature472, 159–161.
WANG, Q. R., LI, Y. C. & KLASSEN, W. (2007). Changes of soil
and irrigation in a tomato field.Journal of Plant Nutrition
30, 623–639.
WESTERVELD, S. M., MCKEOWN, A. W. & MCDONALD, M. R.
(2006). Seasonal nitrogen partitioning and nitrogen uptake of carrots as affected by nitrogen application in a mineral
and an organic soil.Hortscience41, 1332–1338.
WICKHAM, H. (2009). ggplot2: Elegant Graphics for Data Analysis. New York, USA: Springer.
WILLMOTT, C. J. & WICKS, D. E. (1980). An empirical method
for the spatial interpolation of monthly precipitation within
California.Physical Geography1, 59–73.
ZAMBRANO-BIGIARINI, M. (2010).hydroGOF: Goodness-of-fit Functions for Comparison of Simulated and Observed Hydrological Time Series. R package, Version 0.2-1.
Available from:http://www.rforge.net/hydroGOF/(verified
23 July 2012).
ZOTARELLI, L., DUKES, M. D., SCHOLBERG, J. M. S., MUNOZ
-CARPENA, R. & ICERMAN, J. (2009). Tomato nitrogen
accumulation and fertilizer use efficiency on a sandy soil, as affected by nitrogen rate and irrigation
scheduling. Agricultural Water Management96, 1247–