University of Warwick institutional repository: http://go.warwick.ac.uk/wrap
A Thesis Submitted for the Degree of PhD at the University of Warwick
http://go.warwick.ac.uk/wrap/49631
This thesis is made available online and is protected by original copyright. Please scroll down to view the document itself.
THE HLA-B ASSOCIATED TRANSCRIPT 1 (BAT1)
EXPRESSION IN HUMAN ADIPOSE TISSUE;
BAT1 MODULATION WITH INCREASING ADIPOSITY
AND DIABETES
By
KONSTANTINOS LOIS
A thesis submitted to The Faculty of Medicine of the University of Warwick
for the degree of
DOCTOR OF PHILOSOPHY
Diabetes & Metabolism Clinical Sciences Research Institute
Warwick Medical School University of Warwick
Dedicated to
my family
my dearest friend Dr Saif Alhusaini
CONTENTS
Table of Contents 3
List of Figures and Tables 12
Acknowledgments 18
Declaration 19
Synopsis 20
Abbreviations 23
CHAPTER 1: Introduction
28
1.1 Obesity 29
1.1.2 Definition - Classification - Risk Status Assessment 29
1.1.3 Body Fat Distribution 31
1.1.4 Obesity-associated morbidities 31
1.1.5 Obesity and T2DM relation – Diabesity 32
1.2 Obesity and impaired glucose metabolism 34
1.2.1 Physiologic Actions of Insulin and the Insulin-Signaling 34 1.2.2 Modulation of insulin signaling in Obesity;
Etiologic Factors and Molecular Mechanisms 38 1.2.3 ‘Randle’s Glucose-Fatty Acid’ Hypothesis –
Oxidative stress 40
1.2.4 Ectopic Fat Storage Hypothesis 43
1.2.5 Obesity as a state of chronic low-grade inflammation 43 1.2.6 Endoplasmic Reticulum Stress, Hyperglycemia,
1.3.1 Plasma glucose regulation in fasting and postprandial state 47 1.3.2 Defects in Skeletal Muscle Control of Glucose Homeostasis
in obesity 48
1.3.3 Defects in Hepatic Control of Glucose Homeostasis in obesity 49 1.3.4 Central Nervous System Control of Glucose Homeostasis 50
1.4 The Role of Adipose Tissue in the Pathogenesis of T2DM 53 1.4.1 The Role of Adipose Tissue as Source of Free Fatty
Acids in the Pathogenesis of Type 2 Diabetes 53 1.4.2 The Role of Adipose Tissue as an ‘‘Endocrine Organ’’
in the Pathogenesis of Type 2 Diabetes 54
1.4.3 Adipokines 56
1.5 Genetics of Obesity and T2DM 62
1.6 The protein encoded by the HLA-B associated transcript 1
(BAT1) 64
1.6.1 The major histocompatibility complex (MHC) 64 1.6.2 Relation of BAT1 to immunopathologic disorders 65 1.6.3 Structure, biochemical function and cellular localization
of BAT1 67
1.6.4 DEAD-box RNA helicases 68
1.6.5 BAT1 structure/location 69
1.6.6 BAT1 and pre-mRNA splicing 72
1.6.7 BAT1 and nuclear export 74
1.6.8 Clinical significance of BAT1 76
CHAPTER 2: General Methods & Materials
79
2.1 General Methods and Materials 80
2.2 Human Subcutaneous and Omental Adipose Tissue
Collection and Processing 80
2.2.1 Extracted Adipose Tissue Freezing 80
2.2.2 Isolation of Mature Adipocytes from the Extracted Subcutaneous and Omental Adipose Tissue –
Collagenase Digestion process 81
2.2.3 Assessment of Adipocyte Cell Viability by Trypan
Blue Staining 82
2.3 Protein Isolation and Quantification 83
2.3.1 Protein Isolation from human Abdominal Subcutaneous
and Omental Adipose Tissue using Radio-Immunoprecipitation
Assay (RIPA) Buffer 83
2.3.2 Quantification of Protein Concentration 83 2.3.3 Standard Curve for BioRad DC Protein Assay 84
2.4 Western Blot Analysis of Protein Isolated from
Adipocytes and Whole Adipose Tissue 85
2.4.1. Western Blot Analysis of Protein 85
2.4.2 Preparation of Protein Samples Isolated from Adipocytes
and Whole Adipose Tissue for Western Blot Analysis 86 2.4.3 Protein Separation using Gel Electrophoresis 87 2.4.4 Transfer of Proteins – Electroblotting 89
2.4.5 Primary Antibody Application 90
2.5.1 Principles of ECL/ECL+ Detection 91 2.5.2 Quantification of Western Blot Protein Bands 93
2.5.3 Statistical Analysis 94
2.6 Isolation and Purification of RNA from adipose tissue 94
2.6.1 RNA Quantification 95
2.6.2 Reverse Transcription of RNA 95
2.6.3 Quantitative Real-Time Polymerase Chain Reaction
(QRT-PCR/qRT-PCR) 96
2.7 Culture and Differentiation of Primary Human
Pre-adipocytes 97
2.8 Enzyme Linked Immunosorbent Assay (ELISA) /
Principles of ELISA Analysis 99
CHAPTER 3: Characterisation of BAT1 Expression in
Human Adipose Tissue
101
3.1 Introduction 102
3.2 Methods & Materials 104
3.2.1 Subjects 104
3.2.2 Extraction of AT RNA for Quantitative PCR 104
3.2.3 Microarray 105
3.2.4 Protein determination & Western blot analysis 105
3.2.5 Statistical Analyses 106
3.3.1 BAT-1 microarray expressed in human Sc and Om
abdominal adipose tissue 106
3.3.2 mRNA expression of BAT1 in human adipose tissue using
real-time data analysis 108
3.3.3 The effect of adiposity and gender on mRNA BAT1 expression 111 3.3.4 Protein expression of BAT1 in human adipose tissue 113
3.4 Discussion 116
CHAPTER 4: BAT1 Expression in the Immortalized Human
Subcutaneous Pre-adipocyte Cell Line Chub-S7
119
4.1 Introduction 120
4.2 Methods 122
4.2.1 Differentiation of Chub-S7 Cells 122
4.2.2 Real time PCR adipogenic gene methodology 123
4.2.3 Measurement of adipokine release in differentiating
Chub-S7 cells 124
4.2.4 Lipolysis studies in differentiating Chub-S7 cells 124
4.2.5 Lipid staining of differentiating Chub-S7 cells 125
4.2.6 Protein Expression of BAT1 in Chub-S7 cells 125
4.2.7 Statistical analysis 126
4.3 Results 126
4.3.1 Analysis of adipogenic gene in CHUB-S7 cells during
differentiation 126
4.3.2 BAT1 mRNA expression in Chub-S7 during differentiation 132
4.3.4 Lipid accumulation in differentiating Chub-S7 cells 136
4.3.5 Measurement of lipid accumulation using Oil Red O in
differentiating Chub-S7 cells 137
4.3.6 BAT1 protein expression in differentiating Chub-S7 cells 139
4.4 Discussion 140
CHAPTER 5: The influence of nutritional and inflammatory
factors on BAT1 expression in primary adipocytes 143
5.1 Introduction 144
5.2 Research Design and Methods 147
5.2.1 Subjects 147
5.2.2 Cell Culture 147
5.2.3 Protein determination & Western blot analysis 147
5.2.4 Statistical methods 148
5.3 Results 149
5.3.1 Effect of NEFAs on BAT1 expression in human primary
AbdSc adipocytes; the role of NFκB and JNK pathways 149
5.3.2 Effect of glucose concentration on BAT1 expression in
primary adipocytes 156
5.3.3 Effect of LPS on BAT1 protein expression in primary
CHAPTER 6: The influence of human recombinant pro- and
anti-inflammatory adipokines on BAT1 expression
in human differentiated adipocytes
165
6.1 Introduction 166
6.2 Research Design and Methods 169
6.2.1 Subjects 169
6.2.2 Cell Culture 169
6.2.3 Protein determination & Western blot analysis 170
6.2.4 Statistical methods 170
6.3 Results 170
6.3.1 Effect of leptin on BAT1 protein expression in primary human
Abd Sc adipocytes 170
6.3.2 Effect of resistin on BAT1 protein expression in primary human
AbdSc adipocytes 173
6.3.3 Effect of adiponectin on BAT1 protein expression in primary
human Abd Sc adipocytes 175
CHAPTER 7: Final Discussion
181
7.1 Discussion 182
7.2 Future Directions 185
7.3 Conclusion 187
APPENDICES:
188
APPENDIX I: Buffers and Solutions
189
AI. 1 WESTERN BLOTTING SOLUTIONS 189
1.1 Sodium Dodecyl Sulphate (SDS) (4%) 189
1.2 Loading buffer 189
1.3 Phosphate Buffered Saline (PBS) (pH 7.6) 190
1.4 PBS-Tween (PBS-T) (1.0%) 190
1.5 PBS/PBS-T solution for antibody preparation (0.5%) 190 1.6 Tris-buffered Saline-Tween (TBS-T) (10X) 190
1.7 TBS-T (1X) 190
1.8 Blocking Solution for Millipore® filters (20%) 190
AI. 2 GENERERAL CELL-CULTURE SOLUTIONS 190
2.1 Lysis buffer 190
2.2 Collagenase 190
2.3 Transferrin 191
AI. 3 SOLUTIONS AND BUFFERS USED IN RT-PCR 191
3.1 DNase Treatment 191
3.2 Reverse Transcription Buffer 191
APPENDIX II: Reverse Transcription (RT) & Quantitative
Real-Time Polymerase Chain Reaction
192
AII. 1 SYNTHESIS AND EXPRESSION OF mRNA 192
AII. 2 RT-PCR 192
AII. 3 QUANTITATIVE REAL-TIME PCR 193
APPENDIX III: Western Blotting (WB)
195
AIII. 1 CALCULATION OF THE SAMPLES’ PROTEIN
CONTENT FOR WESTERN BLOT ANALYSIS 195
PUBLICATIONS & ABSTRACTS:
196
LIST OF FIGURES & TABLES:
FIGURES:
CHAPTER 1 Fig 1.1.4
Obesity-associated morbidities 32
Fig 1.1.5
Prevalence of Diabetes by BMI 34
Fig 1.2.1
Insulin signaling pathway 38
Fig 1.6.5
BAT1 Structure 72
Fig 1.6.6
Function of UAP56 in pre-mRNA splicing 73
Fig 1.6.7
Nucleocytoplasmic mRNA Export Through the Nuclear Pore Complex 76
CHAPTER 2 Fig 2.4.2
CHAPTER 3 Figure 3.3.1
Microarray mRNA expression of BAT1 in Abdominal Subcutaneous and
Omental adipose tissue from lean and obese subjects 108
Figure 3.3.2.A;B;C
Relative mRNA expression levels of BAT1 quantified by Real-Time RT-PCR in Abdominal Subcutaneous and Omental adipose tissue from
lean and obese subjects 110
Figure 3.3.2.1
Relative fold mRNA expression of BAT1 in Abdominal Subcutaneous and Omental adipose tissue from lean and obese subjects, as well as subjects
with type 2 diabetes mellitus 111
Figure 3.3.3
Scatter plot of BAT1 mRNA expression versus BMI 112
Figure 3.3.4
Protein expression of BAT1 between AbdSc and Om AT 113
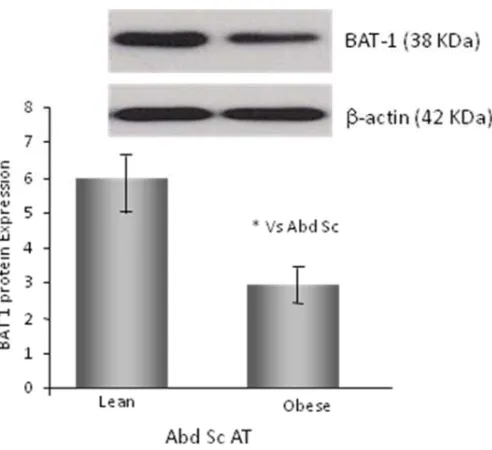
Figure 3.3.4.1
Protein expression of BAT1 between AbdSc lean and obese subjects 114
Figure 3.3.4.2
CHAPTER 4 Figure 4.3.1.1
PPARmRNA expression in Chub-S7 cells 128
Figure 4.3.1.2
CERBmRNA expression in Chub-S7 cells 129
Figure 4.3.1.3
Perilipin mRNA expression in Chub-S7 cells 130
Figure 4.3.1.4
Hexose 6PD mRNA expression in Chub-S7 cells 131
Figure 4.3.1.5
Adiponectin mRNA expression in Chub-S7 cells 132
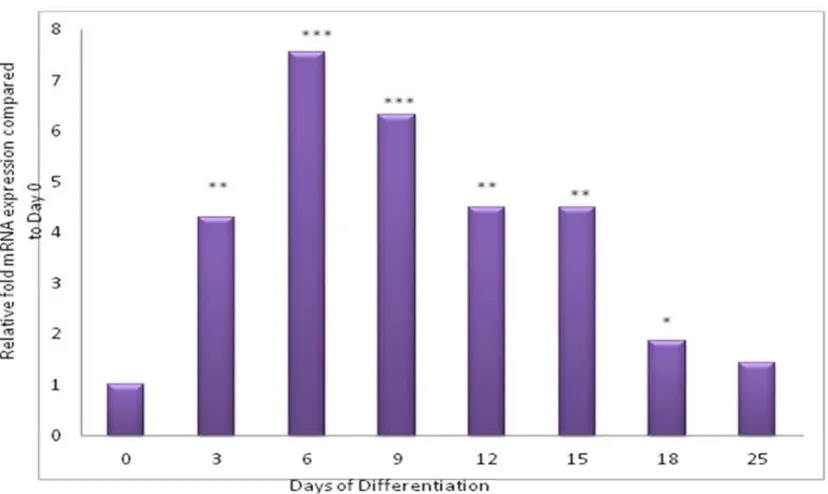
Figure 4.3.2.1
BAT 1 mRNA expression in Chub-S7 cells 133
Figure 4.3.3.1
Leptin release from differentiating Chub-S7 cells over time 134
Figure 4.3.3.2
Adiponectin release from differentiating Chub-S7 cells over time 135
Figure 4.3.4.1
Glycerol release from differentiating Chub-S7 cells over time 136
Figure 4.3.5.1
Fig 4.3.5.2
Cytoplasmic lipid accumulation in Chub-S7 during differentiation 138
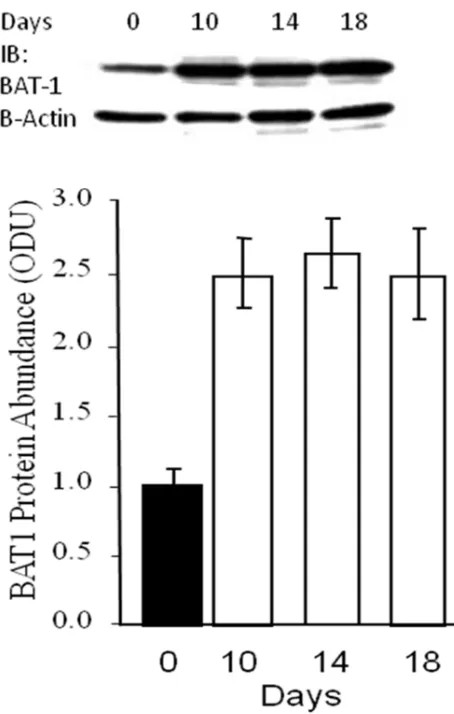
Figure 4.3.6.1
BAT 1 protein expression in Chub-S7 cells 139
CHAPTER 5 Figure 5.3.1
BAT1 protein expression in NEFA-treated AbdSc adipocytes 150
Figure 5.3.1.1
BAT1 protein expression in NEFA-treated AbdSc adipocytes and NFkB inhibitor + NEFA-treated AbdSc adipocytes and
JNK inhibitor + NEFA-treated AbdSc adipocytes 152
Figure 5.3.1.2
BAT1 protein expression in NEFA-treated AbdSc adipocytes and
JNK inhibitor + NEFA-treated AbdSc adipocytes 153
Figure 5.3.1.3
BAT1 protein expression in AbdSc adipocytes treated with NEFA or
with NFkB inhibitor + NEFA 154
Figure 5.3.1.4
Summary effects of NEFA on BAT1 protein expression in naive or previously
treated with JNK or NFkB inhibitor human AbSc AT-derived adipocytes 155
Figure 5.3.2
BAT1 protein expression in AbdSc adipocytes (n=3-5) treated with
Figure 5.3.3
BAT1 protein expression in AbdSc adipocytes treated with LPS5ng/ml 159
Figure 5.3.3.1
BAT1 protein expression in AbdSc adipocytes treated with 25ng/ml LPS 160
Figure 5.3.3.2
Summary of negative mean effect on BAT1 protein expression in
human AbdSc AT adipocytes 161
CHAPTER 6 Figure. 6.3.1
BAT1 protein expression in leptin-treated Abd Sc adipocytes 172
Figure 6.3.2
BAT1 protein expression in resistin-treated AbSc AT adipocytes 174
Figure 6.3.3
BAT1 protein expression in adiponectin-treated AbdSc AT adipocytes 176
Figure 6.3.3.1
BAT1 protein expression in Abd Sc adipocytes treated with LPS or with
TABLES:
CHAPTER 1 Table 1.1.2
Increased Risk of Obesity Related Diseases with Higher BMI 30
Table 1.4.2
Differences between adipocytes from subcutaneous and visceral depots 61
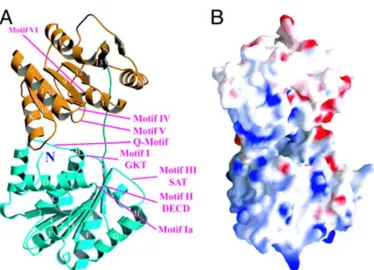
Table 1.6.5
Crystal structure of the human ATP-dependent splicing and
export factor UAP56 71
CHAPTER 2 Table 2.4.1
Composition of Sample Loading Buffer for Western Blot Analysis 85
Table 2.5.1
Quantities, ratios, and incubation times for chemiluminescence detection
systems used for western blot analysis 93
Table 2.6.2
Contents of Reverse Transcription master mix 96
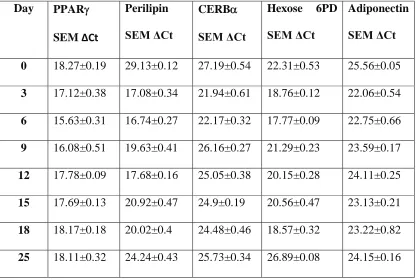
CHAPTER 4 Table 4.3.1
The gene expression profile for PPAR, Perilipin, CEBPα, Hexose-6-Phosphate Dehydrogenase (H6PD) andadiponectin
ACKNOWLEDGMENTS
I would like to offer my gratitude to Professor Sudhesh Kumar and Dr Gyanendra Tripathi for their invaluable support, guidance and knowledge over the past years. I would also very much like to extend my thanks to Dr. Saif Alhusaini, Dr. Alison Harte and Dr. Kirsty McGee, and the rest of the Diabetes and Metabolism Team, for providing both their technical expertise and their support, contributing to the completion of this study.
DECLARATION
SYNOSPIS
Obesity and type 2 diabetes (T2DM) are both inflammatory disorders with
parallel escalating epidemics. Novel insights provided by the new biology suggest
common pathways by which several pathogenic components of obesity affect glucose
metabolism and cellular responsiveness to insulin leading eventually to the development
of T2DM; inflammation is considered critical for the development of the above metabolic
disorders and is directly influenced by weight gain. Adipose tissue (AT), particularly the
abdominal fat depot is currently considered source of inflammatory agents that fuel
whole body’s low grade inflammatory state. The HLA-B Associated Transcript 1 (BAT1)
is a cellular member of the DExD/H-box RNA-helicases with essential role for cellular
mRNA export, that also attains anti-inflammatory properties, as it was shown by studies
investigating monocytes and T-cell lines. Furthermore, BAT1 polymorphisms were
linked to predisposition to immunopathologic disorders including type 1 diabetes. These
findings suggest a potential protective role of BAT1 against the obesity-associated
low-grade inflammatory state that contributes to T2DM development. The role of BAT1 in
the adipocytes has not been investigated so far.
Therefore, this thesis examined BAT1 expression and regulation within specific
human AT depots and the adipocyte itself. Initial studies indicated BAT1 expression in ex vivo human AT but also the repressing effect of increasing adiposity and T2DM on
BAT 1 expression. Remarkably, there was no difference in BAT1 expression between
increasing adiposity and remains suppressed through to the development of T2DM and
thereafter; this could in turn reduce the capacity to response to the inflammatory insults.
As human AT contains many different types of cells besides adipocytes, including fibroblasts, macrophages, lymphocytes, pre-adipocytes and endothelial cells, some of which actually increase with increasing adiposity (e.g. macrophages and lymphocytes) subsequent studies determined the expression of BAT1 particularly in isolated human primary pre-adipocytes and mature adipocytes; the human pre-adipocyte cell line Chub-S7 was used for this purpose. It was shown that BAT1 (mRNA and protein) was expressed in both cell types with maximum expression in mature (lipid accumulating) adipocytes. At the stage of complete maturation, the effects of nutrients and inflammatory factors on BAT1 expression were examined. Both glucose and non-esterified fatty acids (NEFA) were shown to repress BAT 1; these findings were in keeping with the ex vivo
ABBREVIATIONS
AbSc Abdominal Subcutaneous
AbSc AT Abdominal Subcutaneous Adipose Tissue Akt also known as Protein Kinase B (PKB)
ACCORD Action to Control Cardiovascular Risk in Diabetes AIDS Acquired immune deficiency syndrome
AMPK AMP-activated Protein Kinase
ANG II Angiotensinogen II
ANOVA Analysis Of Variance
AP-1 Activator Protein - 1
AT Adipose Tissue
ATMs Adipose tissue macrophages ATP Adenosine tri phosphate BAT1 HLA-B associated transcript 1
BMI Body Mass Index
BSA Bovine Serum Albumin
C Control
cDNA Complimentary DNA
CEBP-α CCAAT enhancer-binding protein-α CNS Central nervous system
CRP C-reactive Protein
Ct Cycle Threshold
CVATT Critical visceral adipose tissue threshold CVD Cardiovascular Disease
Da Daltons
DC Detergent Compatible ()
DCCT Diabetes Control and Complications Trial
ΔCt Delta Cycle Threshold
DGAT2 Diacylglycerol acyltransferase 2
dH2O Distilled water
DMEM Dulbecco’s Minimum Essential Medium
DMSO Dimethylsulphoxide
DNA Deoxyribonucleic Acid
DNase Deoxyribonuclease
dNTPs Deoxynucleotides Triphosphates
dsRNA Double-stranded RNA
ER Endoplasmic Reticulum
ERK Extracellular signal-regulated protein kinase FAM RT-PCR Reporter Fluorochrome/Dye Label
FFA Free Fatty Acid
FFAs Free Fatty Acids
FTO gene Fat mass and obesity-associated gene GAD65 Glutamic acid decarboxylase65
GAPDH Glyceraldehyde 3-phosphate dehydrogenase GCOS GeneChip® Operating Software
gDNA Genomic DNA
GIP Gastric inhibitory peptide
GLP-1 Glucagon-like peptide
GLUT-4 Glucose-transporter-4
GRB2 Growth factor receptor-bound protein 2 GSK-3 Glycogen synthase kinase 3
GSK-3β Glycogen synthase kinase 3β HBSS Hanks’ balanced salt solution
HCl Hydrogen chloride
HIV Human immunodeficiency virus HLAs Human leukocyte antigens
H6PD Hexose-6-phosphate dehydrogenase ( HPV-E7 Papillomavirus E7 oncoprotein
hr Hour
HRP Horseradish peroxidase
hTERT Human telomerase reverse transcriptase IBMX 3-Isobutyl-1-Methylxanthine
ICAM-1 Intercellular Adhesion Molecule-1 IDF International diabetes federation
IFNγ Interferon gamma
IgA ImmunoglobulinA
IGT Impaired Glucose Tolerance IKK Inhibitor of NF-κB Kinase IKK Inhibitor of NF-κB Kinase
IL Interleukin
IL-1 Interleukin-1
IL-1ß Interleukin-1 ß
IL-6 Interleukin-6
IL-10 Interleukin-10
IR Insulin Resistance
IRS-1 Insulin Receptor Substrate-1 IRS-2 Insulin Receptor Substrate-2 IRS-3 Insulin Receptor Substrate-3 JNK c-Jun N-terminal Kinase
KATPchannels ATP-sensitive potassium channels
kDa Kilodaltons
kg Kilogram
L Litre
LPS Lipopolysaccharide
M Molar
m2 Meter squared
MAPK Mitogen-activated Protein Kinase M-CSF Macrophage-Colony stimulating factor MCP-1 Monocyte Chemotactic Protein-1
MetS Metabolic Syndrome
μg Microgram
mg Milligram
MHC Major histocompatibility complex
min Minute (time)
μl Microlitre
ml Millilitre
mM Millimolar
µM Micrololar
mRNA Messenger Ribonucleic acid mTOR Mammalian target of rapamycin
N Number
NAD Nicotinamide adenine dinucleotide
NADPH Nicotinamide adenine dinucleotide phosphate NEFA Non-esterified Fatty Acid
NEFAs Non-esterified Fatty Acids NFkB Nuclear Factor-κB
ng Nanogram
NHANES III National Health and Nutrition Examination Survey III
N2 Nitrogen
NK natural killer
nM Nanomoler
NO Nitric oxide
ODU Optical density units
PAI-1 Plasminogen Activator Inhibitor-1 PBS Phosphate-buffered Saline
PBS-T Phosphate-buffered Saline containing 0.1% Tween 20 PCR Polymerase Chain Reaction
PEPCK Phosphoenolpyruvate Carboxylase PI3K Phosphoinositide-3 Kinase
PKB protein kinase B
PKC Protein Kinase C
PPAR-γ Peroxisome Proliferator Activated Receptor-γ
p-value Probability value
PVDF Polyvinylidene-fluoride
PYY Peptide YY
QRT-PCR Quantitative Real-Time Polymerase Chain Reaction ( RBP-4 Retinol binding protein-4
RFLP Restriction fragment length polymorphism RIPA Radio-Immunoprecipitation Assay
RNA Ribonucleic Acid
ROS Reactive Oxygen Species
RT Room Temperature
RT-PCR Real-time PCR
s Second (time)
SAPK Stress-activated protein kinase
Sc Subcutaneous
Sc AT Subcutaneous Adipose Tissue
SD Standard Deviation
SEM Standard Error of the Mean SnRNP Small nuclear ribonucleoproteins SOCS Suppressor of cytokine signaling
SOS Son of Sevenless
SOS study Swedish Obese Subjects Study
SREBP-1c Steroid regulatory element-binding protein-1c Taq Thermus Aquaticus (DNA polymerase) TBS Tris-buffered Saline
T1DM Type 1 diabetes mellitus T2DM Type 2 Diabetes Mellitus
TEMED N, N, N’, N’-Tetramethylethelenediamine TERTs Human telomerase reverse transcriptases
TG Triglyceride
TLR Toll-like Receptor
TLRs Toll-like Receptors
TNF-α Tumour Necrosis Factor-α
TOR Target of rapamycin
UCP2 Uncoupling protein2
UK United Kingdom
USA United States of America
UV Ultraviolet
V Volts
WHO World Health Organisation
Chapter 1
1.1Obesity
1.1.2 Definition - Classification - Risk Status Assessment
Obesity is a serious growing global health problem affecting more than 400 million people worldwide. It is associated with more than 45 comorbidities and a cluster of atherogenic disorders that compose the metabolic syndrome; the latter is recognized by the International Diabetes Federation guidelines as a progressive condition that contributes to the development of diabetes increases the risk of adverse cardiovascular events and mortality from all causes. WHO, has defined obesity, as a ‘disorder of body composition in that there is an abnormal, absolute or relative proportion of body fat in relation to lean body mass, to the extent that health is impaired’ (WHO 2011).
According to the National Health and Nutrition Examination Survey III (NHANES III), the morbidity and mortality rates are closely related to the degree of obesity making the classification of the weight status imperative, as this enables health practitioners to stratify individual’s health-risk and thus to modify the level of intervention accordingly. Body Mass Index (BMI) and waist circumference correlate well with total adiposity (Marc-Andre Cornieret al. 2002; Lemieuxet al. 1996) and are used in clinical practice for the estimation of weight status. Increasing BMI and increasing waist circumference have been both associated with increasing risk of death from cardiovascular disease and mortality from all causes (Despreset al. 1990), while the presence of any obesity-related disorders increases further the overall mortality risk (Yusufet al. 2002; Websteret al. 1984).
between 18.5 and 24.9 kg/m2are classified as normal weight, while those with BMI 25-29.9 kg/m2as overweight. Patients with BMI 30-34.9 kg/m2are classified as obese-Class I, those with BMI 35 -39.9 kg/m2are classified as obese-Class II and finally those with BMI of 40 kg/m2 or over are classified as extremely obese Class III. BMI values greater than 25 kg/m2 increase the risk of morbidity and mortality for many diseases [6], including type 2 diabetes mellitus (T2DM), hypertension, heart disease, stroke and arthritis (Table 1.1.2).
Table 1.1.2 Increased Risk of Obesity Related Diseases with Higher BMI
Disease
BMI
≤25 kg/m2 BMI between
25 and 30 kg/m2
BMI between
30 and 35 kg/m2
BMI of
≥35 kg/m2
Arthritis 1.00 1.56 1.87 2.39
Heart Disease 1.00 1.39 1.86 1.67
Type 2 Diabetes 1.00 2.42 3.35 6.16
Gallstones 1.00 1.97 3.30 5.48
Hypertension 1.00 1.92 2.82 3.77
Stroke 1.00 1.53 1.59 1.75
1.1.3 Body Fat Distribution
Obesity is a heterogeneous condition with respect to regional distribution and biological properties of fat tissue (Bouchard et al. 1993; Vague 1947). In the 1950s, Vague (Vague 1947) first proposed that excess fat stored on the trunk could be metabolically more damaging than fat stored on the limbs. This theory was later proved to be true by Kissebah & Krakower in 1994 and Kahn and Flier in 2000, so that central adiposity to be considered nowadays an independent risk factor for the development of insulin resistance and T2DM later in life. Visceral adipose tissue refers to fat accumulation within omental and mesenteric fat depots and constitutes about 6-20% of total body fat tissue. It is less receptive to the anabolic effects of insulin and metabolically-lipolytically more active than the peripheral fat tissue which refers to subcutaneous fat accumulation and comprises 80% of total adipose tissue.
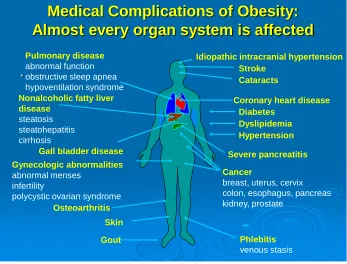
1.1.4 Obesity-associated morbidities
Many studies have shown increased morbidity and mortality among obese individuals (Bell et al 2001; Kopelman PG 2000; Berrios et al 1997) which actually begins to rise at BMI ≥25kg/m2
Medical Complications of Obesity:
Almost every organ system is affected
.
Phlebitis
venous stasis
Coronary heart disease Pulmonary disease
abnormal function obstructive sleep apnea hypoventilation syndrome
Gall bladder disease Gynecologic abnormalities
abnormal menses infertility
polycystic ovarian syndrome
Gout
Stroke
Diabetes
Osteoarthritis
Cancer
breast, uterus, cervix colon, esophagus, pancreas kidney, prostate
Nonalcoholic fatty liver disease steatosis steatohepatitis cirrhosis Hypertension Dyslipidemia Cataracts Skin
Idiopathic intracranial hypertension
[image:33.595.89.436.108.372.2]Severe pancreatitis
Fig 1.1.4 Obesity-associated morbidities
1.1.5 Obesity and T2DM relation - Diabesity
Fig 1.1.5 Prevalence of Diabetes (%) by BMI level as it is revealed by the epidemiologic studies SHIELD and NHAHES(Bayset al. 2007)
1.2 Obesity and impaired glucose metabolism
1.2.1 Physiologic Actions of Insulin and the Insulin-Signaling
Insulin is an important metabolic hormone released by the pancreatic β-cells in
signaling pathway plus the pancreatic β-cell failure to properly secrete adequate amounts
of insulin to meet the metabolic needs.
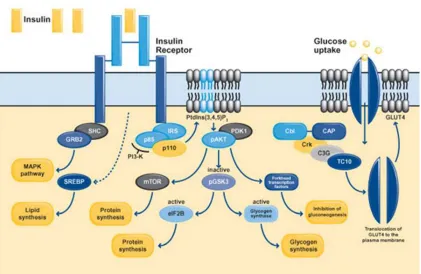
In respect to glucose metabolism, insulin exerts its effects by binding to its receptor. The latter is composed of two extracellular a-subunits and two transmembrane b-subunits linked together by disulphide bonds (Figure 3) (Bevan 2001). Binding of insulin to the extracellular a-subunit results in receptor activation and autophosphorylation of a number of tyrosine residues present in the b-subunit (Van Obberghenet al. 2001) which are in turn recognized by specific phosphotyrosine-binding domains of adaptor proteins including the insulin receptor substrates (IRS-1, IRS-2 and IRS-3) (Saltiel and Kahn 2001; Lizcano and Alessi 2002). The phosphorylation of tyrosine residues on IRS proteins by the activated insulin receptor, allows them to associate with the regulatory subunit of phosphoinositide 3-kinase (PI3K). Once activated, the catalytic subunit of PI3K phosphorylates phosphoinositides at the 3′
which GLUT4 is recruited to the plasma membrane. This pathway starts with insulin binding to its receptor, followed by phosphorylation of Cbl (which is associated to its adaptor protein CAP). The Cbl-CAP complex then translocates to the plasma membrane where via Crk, C3G, TC10 and other adaptor molecules, it promotes GLUT4 translocation to the plasma membrane.
Further to glucose metabolism, insulin is also involved in protein metabolism as it promotes cellular amino acid uptake and protein synthesis (Saltiel and Kahn 2001) while at the same time it inhibits protein degradation. The suggested pathway is that of PI3K-PDK1- Akt which deactivates GSK-3 thus facilitating protein synthesis and the storage of amino acids (Lizcano and Alessi 2002). In addition, Akt activates the mammalian target of rapamycin (mTOR), which enhances protein synthesis (Asnaghiet al. 2004).
Lipid homeostasis provides another metabolic pathway in which insulin is implicated. Exerting anabolic effects, insulin promotes the cellular uptake of fatty acids and the synthesis of lipids (via the steroid regulatory element-binding protein; SREBP)-1c) (Shimomuraet al. 1999), whilst inhibiting lipolysis (Kitamuraet al.1999). In addition, insulin also attains mitogenic properties; MAPK cascade is the leading pathway to its mitogenic responses (Ogawaet al.1998) which may be activated via two different pathways. The first cascade starts with IRS phosphorylation followed by activation of GRB2 and SOS and the second one (IRS- independent pathway) starts with the phosphorylation of SHC followed by GRB2 activation; both end up with MAPK cascade stimulation.
effectiveness. For example, the insulin/insulin receptor complexes are internalized into endosomes within which they are subsequently dissociated and degraded, providing a mechanism by which insulin receptors are downregulated in hyperinsulinaemic states as in obesity thus aggravating IR. In addition, insulin promotes the production of SOCS (suppressor of cytokine signaling) proteins that block the insulin signaling circuitry (Emanuelliet al. 2000; Krebset al. 2000; Endoet al. 1997; Matsumotoet al. 1997). Similarly, the GSK-3β activation by Akt/PKB exerts negative feedback on insulin
Fig 1.2.1 Insulin signaling pathway.Activation of the insulin receptor evokes increased transcription of SREBP and the phosphorylation of members of the IRS family, SHC and Cbl. Upon tyrosine phosphorylation, these proteins interact with signaling molecules through their SH2 domains, which results in the activation of a variety of signaling pathways, including PI 3-kinase signaling, MAPK activation and the activation of the Cbl/CAP complex. These pathways act in a coordinated manner to regulate glucose, lipid and protein metabolism (adopted by Bevan P 2001).
1.2.2 Modulation of insulin signaling in Obesity; Etiologic Factors and Molecular Mechanisms
cells failure to secrete sharply adequate amounts of insulin to meet the metabolic needs. Regarding reduced response to insulin effect, a number of defects in insulin signal transduction pathway have been described in human subjects with insulin resistance and T2DM (Krook et al. 1998; Kerouz et al. 1997; Goodyear et al. 1995; Caro et al. 1987) however, the detailed molecular basis for insulin resistance is not well understood in every case.
adipose tissue as an endocrine organ that produces and metabolizes multiple bioactive factors, which may potentially impair glucose metabolism and second, change of adipose tissue phenotype due to alow-grade inflammatory statethat impairs insulin effectiveness. Although these theories provide metabolic mechanisms that seem to be different in origin and nature, the underlying trigger factor may be related to the effect of substrate excess relative to what adipose tissue has the genetically determined capacity to store. As a result, obese individuals develop insulin resistance, which is initially compensated for by hyperinsulinemia, through which normal glucose tolerance is preserved. However, over time further deterioration of glucose metabolism, either by increased insulin resistance or by decreased compensatory insulin secretory responses or by both, accelerates the progression to impaired glucose tolerance and eventually to overt T2DM. Chronic hyperinsulinemia per-se has been also demonstrated by White et al(2003) to exacerbate insulin resistance and contribute directly to beta-cell failure and diabetes.
1.2.3 ‘Randle’s Glucose-Fatty Acid’ Hypothesis - Oxidative stress
tissues. In contrast, when carbohydrates are decreased (fasting state), the serum insulin levels fall permitting lipolysis and NEFA mobilization, which then become the major fuel for peripheral tissues. Randle went a step further, demonstrating the inhibitory effect of enhanced NEFA oxidation on glucose metabolism. This particular metabolic effect takes place in states with lipid excess, as in obesity and is considered pathogenic in the development of insulin resistance and eventually T2DM in obese individuals. This theory was later confirmed by following studies showing that adipocytes decrease glucose uptake in peripheral tissues by the release of free fatty acids (Boden 1997) as even short periods of lipid excess decrease PI3K activity and insulin-stimulated glucose uptake in muscle (Jacobsonet al. 2002; Dresneret al. 1999). It is suggested that by mass action, the increased plasma free fatty acids (FFAs) augment their cellular uptake and induce their mitochondrial β-oxidation. As a result, the cellular metabolism may be altered at the level
of substrate competition, intermediates accumulation, enzyme regulation, intracellular signaling and/or gene transcription, affecting among others, glucose metabolism. Clinical studies in healthy volunteers, in which acute elevation of plasma NEFAs resulted in whole body insulin resistance, confirmed the proposed metabolic model (Dresner et al. 1999). Obese individuals have two main sources of plasma NEFA excess, the meal-derived fatty acids (high-calorie diets) and the adipose tissue lipolysis especially the visceral adipose tissue one.
In this direction is the theory regarding pathogenic role of oxidative stress in insulin resistance and β-cell dysfunction in obese individuals. It refers to a state in which
of cellular ROS production (Newsholme et al. 2007; Turrens 2003; Lenaz 2001), while plasma or subcellular membrane-associated NADPH oxidases are secondary sources of intracellular ROS (Newsholme et al. 2009 and 2007). Normally, during the aerobic cellular metabolic processes, several reactive oxygen species (ROS) are produced. In normal concentrations, these elements act as necessary messengers in biological systems (Redox signaling) (Rhee 2006; Dröge 2002). In beta-cells in particular, the mitochondrial-produced ATP and ROS seem to be involved in maintaining normal glucose responsiveness (Leloupet al. 2009; Piet al. 2007; Bindokaset al2003). In states of prolonged excessive fuel load such as fats, the excessive mitochondrial fat oxidation results in excessive production of ROS (Li et al. 2008; Aikawa et al. 2002; Djuricet al
2001; Inoguchi et al. 2000). When abnormally high, they become cytotoxic and damage cellular structures and organelles (including mitochondria) resulting in defective cellular metabolism and enhanced cellular apoptosis. This cytotoxic condition, triggers cellular inflammatory response; it has been demonstrated that the latter stimulates the inhibitory serine phosphorylation of IRS-1, thus disrupting insulin signal transduction causing insulin resistance (Wellen and Hotamisligil 2005). B-cells are considered very sensitive to oxidative stress as they are low in antioxidant enzymes (Robertson and Harmon 2007; Tonooka et al. 2007). It has been shown that oxidative stress in β-cells disrupts mitochondrial function and ATP production which is necessary for the KATP channels
1.2.4 Ectopic Fat Storage Hypothesis
Normally, the adipocytes take up lipids from fat-rich plasma lipoproteins, through the effect of fat cell-derived lipoprotein lipase and store almost pure triglycerides in quantities of up to 95% of their volume. This process called lipogenesis is enhanced by insulin (Vague 1956). In contrast, when energy is needed elsewhere in the body, the stored fat is mobilized (lipolysis) in the form of NEFAs by the hormone sensitive lipoprotein lipase, against the effect of insulin. However, when the diet-derived fat intake is increased as in obesity, fat storage within and around other tissues and organs which under normal conditions do not store lipids has been demonstrated, including liver, skeletal muscle and pancreatic β-cells (Ectopic Fat Storage Hypothesis) (Goodpaster and Kelley 1998; Shulman 2000). There is probably a critical visceral adipose tissue threshold (CVATT), after which fat deposition is diverted to extra-adipose tissues. It has been demonstrated that although initially the peripheral organs facilitate the storage-esterification of the surplus in the form of triglycerides, their limited triglyceride buffer capacity becomes saturated soon and the excess of lipids enter catabolic pathways. As a result, excessive mitochondrial production of toxic reactive lipid species ensues (oxidative stress), which mediate organ-specific oxidative damage and cellular dysfunction, leading progressively to the development of insulin resistance, impaired glucose metabolism and finally T2DM (Jacobet al. 1999).
1.2.5 Obesity as a state of chronic low-grade inflammation
necrosis factor-(TNF-) (Dandonaet al. 1998), interleukin-1 (IL-1) and -6 (IL-6) (Van Dielen et al. 2001; Yudkin et al. 2000; Visser et al, 1999) plus the increased plasma circulating mononuclear cells and lymphocytes (Perfettoet al. 2002) in otherwise healthy overweight and obese individuals. The low-grade inflammation has been implicated in the development of IR, β-cell dysfunction and T2DM (Laaksonenet al. 2004; Pradhanet al. 2002); IL-1ß for example induces nitric oxide (NO) production in pancreatic ß-cells, and may impair of insulin secretion (Wogensen et al. 1990). It was shown that adipose tissue produces certain bioactive substances that promote inflammation (e.g. interleukin -6) (Cachofeiro et al. 2006) but also fat tissue per se is infiltrated by inflammatory cells including lymphocytes and macrophages which also secrete cytokines (e.g. IL-6 and TNF-) contributing to the whole body inflammatory process (Lumeng et al. 2007); the degree of the participation is not clear. The pro-inflammatory cytokines increase the production of serine kinases such as MAPK (mitogen-activated protein kinase), TOR (target of rapamycin), PI3K and Jnk (Jun N-terminal kinase) (Pradaet al. 2005; Ozcanet al. 2004; Hirosumiet al. 2002; Ozes et al.2001; Rui et al. 2001; De Feaet al. 1997) which in turn cause serine phosphorylation of IRS-1 thus IR (Rui et al. 2001). In addition, insulin as well as increased levels of pro-inflammatory cytokines enhance SOCS (suppressor of cytokine signaling) proteins production which blocks the insulin signaling circuitry (Emanuelliet al. 2000; Krebs et al. 2000; Endo et al. 1997; Matsumotoet al. 1997). TNF-α may also impair insulin secretion in pancreatic islet cells
high-fat meal challenges in both T2DM and healthy subjects have been shown to increase inflammation (Caniet al. 2008; Caniet al. 2007; Nappo et al. 2002), implying a direct effect of FFAs on inflammatory pathways stimulation. In addition, the stimulatory effects of monounsaturated fatty acids on TLR-4/NFκB pathway with respect to the secretion of
adipokines and chemokines (including inflammatory molecules) from adipocytes, has been demonstrated (Schäffler et al. 2008), while both pharmacological and genetic intervention in pathways such as JNK and IKK improve glucose metabolism under conditions of obesity (Uysalet al. 1997; Hotamisligilet al. 1993). Putting together, a critical role of fats on inflammatory state generation and IR ensues. It has been shown that, similarly to inflammatory factors (e.g. TNF-), elevated levels of free fatty acids (FFAs) stimulate the inhibitory serine phosphorylation of IRS-1, thus disrupting insulin signal transduction and inducing insulin resistance (Wellen and Hotamisligil 2005). The FFA-stimulated inflammatory serine/threonine kinases JNK, inhibitor of nuclear factor (NF)-κB kinase (IKK) and protein kinase C (PKC) (Schmitz-Peiffer and Biden 2008; Arkan et al. 2005; Hirosumi et al. 2002) seems to represent key intermediaries of the inflammatory pathways that mediate serine phosphorylation of IRS-1 thus block insulin action. These kinases also stimulate activator protein (AP)-1 complexes and NF-κB (Hotamisligil GS et al. 2006) thus enhancing the production of inflammatory mediators including TNF-α and IL-6 (Shoelson et al. 2003; Gao et al. 2002) providing link between FFA excess and whole body inflammation.
1.2.6 Endoplasmic Reticulum Stress, Hyperglycemia, and Insulin Resistance
As indicated previously, chronic low-grade inflammation may cause IR by increasing the production of serine kinases such as MAPK, TOR, and Jnk which in turn cause serine phosphorylation of IRS-1 inhibiting insulin signal transition (Pradaet al. 2005; Ozcanet al. 2004; Hirosumi et al. 2002; Ozes et al. 2001; Rui et al. 2001; De Fea, Roth 1997; Tantiet al. 1994) thus IR (Rui et al., 2001). In addition, the proinflammatory cytokines enhance the production of SOCS proteins that block the insulin signaling circuitry (Emanuelliet al. 2000; Krebs et al. 2000; Endo et al. 1997; Matsumoto et al. 1997). An alternative theory has been proposed implicating endoplasmic reticulum (ER) stress as a key factor in obesity-associated chronic inflammation and IR (Hotamisligil 2006; Nakatani et al. 2005; Ozcan et al. 2004). Although ER stress response has naturally a protective role in cellular survival and is activated in states of glucose or nutrition deprivation (Scheuner et al. 2001) to protect against hypoglycemia and death (Tamataniet al. 2001) in fuel-excess states as in obesity it deranges glucose metabolism. It has been suggested that NF-κB and JNK pathways
mediates ER-stress inhibitory effects on insulin signal transduction (Ozcan et al. 2006; Zhanget al. 2001).
1.3 Influence of glucose on insulin resistance.
1.3.1 Plasma glucose regulation in fasting and postprandial state
al. 2002; Stumvollet al. 1999). In contrast, postprandially, the glycogen breakdown and glucose release into the circulation are substantially reduced (Woerleet al. 2004; Meyer
et al. 2002) while the hepatic glycogen synthesis increases, so that hyperglycemia to be avoided and replenishment of glycogen stores to be facilitated. These metabolic modulations follow changes in plasma insulin (increased) and glucagon (decreased) concentrations (Woerle et al. 2004; Woerle et al. 2003; Mitrakou et al. 1992) due to which hepatic glucose-6-phosphatase and phosphorylase are reduced, while glycogen synthase is activated. Thepostprandial glucose disposal involves taken up by tissues for energy production (glycolysis; about 2/3 of taken up glucose) or storage (about 1/3, either as glycogen or as triglycerides in the adipose tissue) (Woerle et al. 2003). The major tissues responsible for postprandial glucose disposal are liver (splanchnic), muscle, brain, and kidney (Meyer et al. 2002). Brain plays a substantial role in glucose disposal which is in brain’s case insulin independent. Thus, only about 70% of postprandial glucose uptake is insulin dependent. About 2/3 of the glucose that undergoes glycolysis is oxidized, while the remainder is converted to gluconeogenic intermediates (i.e., lactate, pyruvate, and alanine) which are then released back to circulation, enter the hepatic gluconeogenic pathway and after conversion into glucose-6-phosphate are by released 50% as free glucose back to the circulation and by 50% is incorporated in hepatic glycogen for future use.
1.3.2 Defects in Skeletal Muscle Control of Glucose Homeostasis in obesity
factor T2DM. Lipid accumulation within skeletal muscle correlates quite well with insulin resistance in humans and is one of the suggested mechanisms implicated in the induction of IR in obesity (Phillips et al. 1996). It has been shown that excessive accumulation of lipids within the skeletal cells, activate at least in part via increased ceramide formation the protein kinase C and the JNK/SAPK pathway, which in turn block insulin signal transduction in muscle (Prada et al. 2005; Kimet al. 2004; Hirosumi
et al. 2002).
1.3.3 Defects in Hepatic Control of Glucose Homeostasis in obesity
in obese individuals (Dixon et al. 2001; Matteoniet al. 1999; Ludwiget al.1980), while on the other hand recent findings relate liver fat accumulation with reduced hepatic insulin sensitivity (Seppälä-Lindrooset al. 2002; Schmitz-Peiffer 2000). Putting together, liver steatosis is a manifestation of IR in obesity (Ferre, Foufelle 2007; Patti et al. 2003). This association seems to be explained by the role of the transcription factor sterol regulatory-element-binding protein-1c (SREBP-1c) in the liver that induces the expression of a family of genes involved in glucose utilization (gluconeogenic genes) and fatty acid synthesis (lipogenic genes) and can be considered as a thrifty gene (Ide et al. 2004; Azzout-Marnicheet al. 2000; Foretz et al. 1999). It has been shown that insulin at least in part via through the phosphatidylinositol 3-kinase pathway, increases the hepatocellular concentration of the transcription factor sterol regulatory-element-binding protein-1c (SREBP-1c). The subsequent SREBP-1c induced lipogenesis contributes to abnormally high hepatic content of fats (liver steatosis) which in turn reduce hepatic insulin sensitivity by mechanisms involving substrate competition, antagonism of insulin signaling or lipotoxicity (Seppälä-Lindrooset al. 2002; Schmitz-Peiffer 2000).
1.3.4 Central Nervous System Control of Glucose Homeostasis
demonstrate loss of satiety, increased appetite and severe obesity (Morton et al. 2006; Elmquist, Marcus 2003). In obesity, despite hyperleptinemia, appetite remains increased, implying attenuated response to leptin in obesity. This finding, along with the insulin sensitizing effects of leptin in peripheral tissues (Morton et al. 2006; Elmquist, Marcus 2003) may suggest a contributory effect of dysregulated leptin sensing pathway to obesity and diabetes development. Remarkably, it seems that neuronal connection between CNS and fat tissue exists which may actually play important role in appetite regulation. It has been shown that afferent-nerve signals from intra-abdominal adipose tissue modulate hunger and sense of satiety by enhancing the hypothalamic sensitivity to leptin (Yamada
et al. 2006). Further to adipose tissue-derived hormonal (leptin) and neural factors that modulate hypothalamic control of appetite and peripheral insulin effectiveness, recent data suggest that metabolic agents (long-chain fatty acids) produced by the adipocytes may also regulate energy balance and metabolic homeostasis by altering the rate of lipid oxidation in selective hypothalamic neurons (Morton et al. 2006; Elmquist, Marcus 2003). This in turn alters the hypothalamic perception of metabolic balance and changes respectively the CNS-regulated efferent pathways responsible for fuel intake and utilization (Cotaet al. 2007).
metabolism but also to decreased appetite and weight loss. Whether reduction of these agents represents a primary or secondary defect in obesity and T2DM is still unknown. What is known though is that these humoral circuits from gut do not function properly in obesity and diabetes implying the complexity of the multi-systemic modulation of energy and modulation via CNS and hypothalamus. Another gut hormone involved in energy homeostasis is ghrelin which levels increase with fasting and augments feeding (Cota et al. 2007; Mortonet al. 2006; Yamadaet al. 2006; Elmquist, Marcus 2003).
The sympathetic and parasympathetic innervation of adipose tissue has been well documented (Kahn et al. 2006; Boden, Hoeldtke 2003; Ikezu et al. 1999). By acting on the adiposal β3-adrenergic receptors, the sympathetic nervous system enhances lipolysis
while the parasympathetic nervous system has been involved in lipogenesis. Both these function suggest the close cross-talk between CNS and adipose tissue. On the other hand, it is known the interrelationship between autonomous nervous system and immune system (e.g., macrophages) (Flierlet al. 2007; Sternberg 2006). Putting together, adipose tissue cross-talks with immune system however how this is modified in obesity is still unknown.
the efferent part of the circuit it decreases the hepatic glucose output. It has been shown that this loop is defective in obesity, contributing to enhance hepatic glucose production even in postprandial states (Partonet al. 2007).
1.4 The Role of Adipose Tissue in the Pathogenesis of T2DM
Obese individuals tend to be insulin resistant (Rexrodeet al. 1996; Bonadonnaet al. 1990). As previously detailed the insulin signaling pathway, as well as the physiologic role of CNS and organs, are disrupted in subjects with T2DM where normal glucose metabolism is altered in the liver and skeletal muscle. Previous studies have also referred to the obesity-related modulations of insulin action and signaling in these organs and provided current views for the etiologic factors and molecular mechanisms involved in insulin resistance generation and subsequent impaired glucose homeostasis and T2DM development in states with excessive fuel load as in obesity. Here we present the critical role of expanding adipose tissue in insulin signaling defects generation in obesity.
1.4.1 The Role of Adipose Tissue as Source of Free Fatty Acids in the Pathogenesis of Type 2 Diabetes
Hirsch, Knittle 1970; Salans et al. 1968) so that the hormone sensitive lipase remains active, driving hydrolysis of the stored triglycerides with subsequent excessive FFAs release in the circulation. As a result, the circulating FFAs further to generating an atherogenic lipid profile, they are also taken up by peripheral tissues where they are either re-esterified and stored as triglycerides or used for energy production (oxidation). In the long term, the excessive ‘ectopic’ fat storage and oxidation generates oxidative stress that causes cellular damage and defects in cellular metabolism including IR (Li et al. 2008; Hotamisligil 2006; Aikawaet al. 2002; Djuricet al. 2001; Inoguchiet al. 2000). In addition, it also triggers cellular inflammation, resulting in serine phosphorylation of IRS-1, thus further blocking the insulin signal transduction (Wellen and Hotamisligil 2005).
1.4.2 The Role of Adipose Tissue as an ‘‘Endocrine Organ’’ in the Pathogenesis of Type 2 Diabetes
contributing to energy homeostasis regulation or peripheral insulin action. Current research has identified over 50 adipocyte-secreted bioactive factors (Table 1.4.2) with local (autocrine/paracrine) and systemic (endocrine) effects that are produced by the fat cells, and more are yet to be discovered. As individuals become obese and their adipocytes enlarge, adipose tissue undergoes molecular and cellular alterations and produces certain bioactive substances that promote inflammation including tumor necrosis factor-α (TNF-α), interleukin 6 (IL-6), IL-8 (Cachofeiroet al. 2006).
Initially, the adipocytes have been exclusively blamed for the adipose tissue-derived pro-inflammatory molecules. Recent studies however, suggest that obesity is associated with increased infiltration of macrophage (adipose tissue macrophages-ATMs) within the adipose tissue (Mozaffarian 2006; Sjöström et al. 1999; Stalmer et al. 1993; Hubert et al. 1983), which in turn secrete high concentrations of inflammatory compounds such as TNF-α and IL-6, that fuel further systemic inflammation (Lumeng et al. 2007) and induce the development of insulin resistance. Kintscher et al (2008) extended the original observations from ATMs to cells of adaptative immunity. They demonstrated increased T-lymphocytes accumulation within the adipose tissue of obese rodents mainly by using gene expression analyses and immunohistochemistry; more interestingly, the T-lymphocytes infiltration preceded that of the macrophages. Similar are the findings in human adipose tissue of morbidly obese patients as T-cell infiltration was demonstrated by Wu et al(2003) who also suggested that these T-lymphocytes may play a role in the development of IR during obesity. The accumulated T-lymphocytes could in turn produce interferon gamma (IFNγ) that stimulate monocyte chemoattractant
Several hypotheses have been suggested to explain the accumulation of macrophages in fat tissue. The most widely accepted suggests that the enlarged adipocytes become ‘fragile’, leaking chemoattractants such as M-CSF and MCP-1 that activate and recruit macrophages in adipose tissue, even at the early stages of obesity (Takahashiet al. 2008).
1.4.3 Adipokines
TNF-α for example, is highly expressed in adipose tissues of obese subjects
(Hotamisligil et al. 1995) and has been proposed as a link between insulin resistance, obesity, and diabetes (Sánchez et al. 2005). Supporting to this, is the finding that obese mice lacking either TNF-α or its receptors are protected against developing insulin
resistance (Uysal et al. 1997), while direct exposure of isolated cells to TNF-α blocks
insulin signaling transduction and induces a state of insulin resistance in several systems, including human primary adipocytes (Hotamisligil et al. 1996). TNF-α activates ERK
2003); this explains why inhibition of JNK decreases the development of obesity-associated IR (Hirosumiet al. 2002; Uysalet al. 1997; Hotamisligilet al. 1993).
Furthermore, data from studies in animal models have clearly linked resistin to IR (Satohet al. 2004; Rangwalaet al. 2004; Rajalaet al. 2004; Banerjee, Lazar 2003; Rajala
demonstrated TNF--induced resistin elevation, as a result of endotoxinemia. Furthermore, studies with thiazolidinediones (TZDs) that are insulin sensitizers show that TZDs reduce resistin levels and CRP values (Chuet al. 2002). Putting together, the lack of association between resistin and insulin resistance, with the documented presence of strong relationship between resistin and inflammatory markers may be explained by a direct stimulatory effect of resistin on inflammatory processes.
Leptin is another adipokine that is secreted by the adipocytes in direct proportion to adipose tissue mass. It serves as a metabolic signal of energy sufficiency (Friedman, Halaas 1998) and modulates the function of the hypothalamic-pituitary-adrenal/thyroid and -gonadal axes (Margetic et al. 2002; Flieret al. 2002; Hileman et al. 2000). Within the human adipose tissue, increased leptin concentration, as in obesity, exerts pro-inflammatory effects as it induces the release of TNF-a (Lappas et al. 2005) and the endothelial-derived MCP-1 production, facilitating the recruitment of macrophages into the fat tissue (Yamagishi et al. 2001). Furthermore, it has been demonstrated that leptin levels are rapidly increased by many acute phase cytokines, such as TNF- and IL-6 (Kirchgessneret al. 1997; Sarrafet al. 1997) that are both present in excess in the adipose tissue of obese individuals (Friedet al. 1998; Hotamisligil et al. 1993). Putting together, there is an established interlink between leptin and inflammatory mechanism within the adipose tissue contributing to excessive production and release of inflammatory mediators.
al. 2007). Its role in glucose metabolism remains unclear. There are animal data showing potent anti-inflammatory effects (Cash et al. 2008) and direct stimulatory effect of chemerin on adipocyte GLUT-4 and adiponectin expression via its own receptor (Bozaoglu et al. 2007; Goralskiet al. 2007; Roh et al. 2007) plus enhancement of IRS-1 tyrosine phosphorylation, suggesting that insulin sensitizing effect of chemerin in adipose tissue (Takahashia et al. 2008). On the other hand however, the plasma chemerin levels were associated with BMI, triglycerides, and blood pressure in normal glucose tolerant subjects (Bozaoglu et al. 2007). Omentin is another protein synthesized and secreted by the visceral stromal vascular cells of the adipose tissue rather than the adipocytes. It seems that it improves insulin sensitivity in human subcutaneous and visceral adipose tissue as it increases Akt phosphorylation and glucose uptake by the adipocytes Kieffer, Habener 2000) while and its plasma levels have been positively related to adiponectin and HDL and inversely to obesity and IR in human subjects (de Souza Batista et al. 2007). Whether its role in glucose metabolism is important or not still needs to be determined.
Table 1.4.2 Differences between adipocytes from subcutaneous (Sc) and visceral depots(Modified from original Source: Montague & O’Rahilly; 1998)
Factor Regional Difference Reference
Leptin mRNA & protein VisceralSc Lebreve AMet al, 1998; Harmalen VVet al, 1998; Montague CTet al, 1997
TNF- VisceralSc Hubeet al, 1999
IL-6 VisceralSc Fried SKet al, 1998
PAI-1 VisceralSc Shimomura Iet al, 1996
Angiotensinogen mRNA VisceralSc Van Harmalen Vet al, 2000
Resistin Visceral = Sc McTernan PGet al, 2002a
Adiponectin VisceralSc Fisher ffMet al, 2002
Androgen receptor mRNA VisceralSc Dieudonne Met al, 1998) PPAR visceral = Sc Montague CTet al, 1998 TZD stimulated
pre-adipocyte differentiation
VisceralSc Adams Met al, 1997 Lipolytic response to
catecholamines
VisceralSc Rebuffé-Scrive M et al, 1989
Antilipolytic effect of insulin
VisceralSc Zierath Jet al, 1998 Lefebvre A-Met al, 1998 1 and2-Adrenergic
receptor binding and mRNA
VisceralSc Hellmér Jet al, 1992; Arner Pet al, 1990 Dexamethasone-induced
increase in LPL
VisceralSc Fried SKet al, 1993 2-Adrenergic receptor
agonist inhibition of cAMP
VisceralSc Vikman H-Let al, 1996 Insulin receptor affinity VisceralSc Zierath Jet al, 1998 IRS-1 protein expression VisceralSc Zierath Jet al, 1998 Insulin receptor VisceralSc Lefebvre A-Met al, 1998 Glucocorticoid receptor
mRNA
1.5 Genetics of Obesity and T2DM
Alhtough there has been a sharp and unexpected upward turn in the prevalence of T2DM in the last couple of decades cannot be attributed to novel genetic defects, the genetic component to T2DM cannot be denied, given the high prevalence of the disease in particular ethnic groups (Knowler et al. 1990; Zimmet et al. 1983), the differences in incidence rates between monozygotic and dizygotic twins (Newman et al. 1987; Barnett
resistance/T2DM, while in other cases such as in FTO gene, different polymorphisms predisposed to T2DM or obesity (Ramyaet al. 2011).
Although a clear divide between type 1 diabetes mellitus (T1DM) and T2DM is suggested, the cross-over in terms of inflammatory pathways may blur those lines. T1DM is an autoimmune disease in which autoreactive cytotoxic (CD8+) T-cells recognize a number of antigenic determinants (insulin, IGRIP, GAD65, ICA512/IA-2, and I-A2ß) (Lieberman et al. 2003; Atkinson, Eisenbarth 2001; Wong et al. 1999) expressed in pancreatic ß-cells and progressively destroy them. Along with the cytotoxic T-cells, other components of the inflammatory responses including CD4+ T-cells, macrophages, natural killer (NK) cells and cytokines take part in insulinitis and ß-cell destruction. Remarkably, the fact that the CD8+ T-cells are the most abundant cells in T1DM-associated insulitis (Conrad et al. 1994; Bottazzo et al. 1985) suggests a potential crucial role of major histocompatibility complex (MHC) in the development of T1DM. In respect of T2DM studies, recent findings support a critical role of low grade whole body inflammation and subsequent IR development even in patients with T1DM (Chase et al. 2004); with a reduction in inflammation shown to restore response to insulin. Furthermore, gathering evidence appears to support that IR, a risk factor for progression to T1DM may also herald the onset of autoimmune diabetes (Razaviet al. 2006; Sherry
et al. 2005; Betts et al. 2005; Fourlanos et al. 2004). Taken together, chronic inflammation may accelerate ß-cell death and lead to T1DM. Support for this has been noted through recent findings showing accelerated β-cell failure and apoptosis by
specific polymorphisms in the central human major histocompatibility complex (MHC) region class III of chromosome 6, where the HLA-B associated transcript 1 (BAT1) lies (Wong et al. 2003; Spies et al. 1989) predisposes to the development of autoimmune disorders including T1DM (Allcock et al. 1999). These findings appear related to previous experiments in monocytes and T-cell lines (Allcock et al. 2001) according to which BAT1 down-regulates inflammatory cytokines such as TNF-α, IL-1 and IL-6. As
such this may suggest that BAT1 polymorphisms leads to suppressed BAT1 protein levels, leading to T1DM, via triggering inflammatory responses rather that autoimmune processes and if this is accurate, BAT1 inactivating mutations could herald the development of inflammation and subsequently IR and reduced β-cell secretory capacity
in T2DM.
1.6 The protein encoded by the HLA-B associated transcript 1 (BAT1)
1.6.1 The major histocompatibility complex (MHC)
antigens (HLAs) that are displayed on the cell surface and define an individual’s tissue type. Class III MHC genes encode a group of soluble proteins found in the blood (complement system) that target foreign cells and breaks open their membranes, while close to them is a cluster of genes that control inflammation. Because of their role to defend against a great variety of foreign particles such as bacteria, MHC genes must be able to present a wide range of peptide antigens derived from such digested particles and are therefore highly polymorphic. It has been shown that specific MHC-related polymorphisms are associated with either increased or decreased susceptibility to a range of infectious diseases including tuberculosis, hepatitis and HIV/AIDS, while loss-of-function MHC gene mutations may lead to autoimmune disorders in which the body fails to recognize self-antigens for example multiple sclerosis, some forms of arthritis and diabetes, and inflammatory bowel disease (Cheong et al. 2001; Ota et al. 2001; Price et al. 1999).
1.6.2 Relation of BAT1 to immunopathologic disorders
The HLA-B associated transcript 1 (BAT1) gene is located in the central part of class III MHC genomic locus on chromosome 6, between TNF and HLA-B genes (Wong
et al. 2003; Spieset al. 1989). Although it is difficult to study this region because of the presence of strong linkage disequilibrium within the MHC and the high gene density, it has been shown that the central part of class III MHC region contains genes that affect susceptibility to immunopathologic disorders (Cheong et al. 2001; Ota et al. 2001; Price
progression of HIV infection and to autoimmune disorders including TIDM, systemic lupus erythematosus, rheumatoid arthritis, myasthenia gravis, coeliac disease, common variable immunodeficiency, IgA deficiency and dermatitis herpetiformis (Allcock et al. 1999). These disorders are characterized by dysregulation of inflammatory cytokines hence they may be influenced by single gene. In addition several genes in the central MHC locus also have the potential to modulate immune or inflammatory responses in an antigen-independent manner, as is observed in studies of cultured cells from healthy carriers of the 8.1 ancestral haplotype however, only six genes (LTA, LTB, TNF, IKBL, AT6PG and BAT1) are conserved through modern human evolution (673) which means each constituent gene represents candidate for the observed genetic associations. Furthermore, antisense studies have shown that BAT1 protein can down-regulate inflammatory cytokines. Such studies indicate that monocytes and T-cells (Allcock et al. 2001) BAT1 may encode a negative regulator of the inflammatory cytokines TNF-α, IL-1 and IL-6 and may therefore influence immunological processes
positions -22C/G and -348C/T with chronic Chagas cardiomyopathy (Ramasawmy et al. 2006) and the haplotype block, NFKBIL1-ATP6V1G2-BAT1-MICB-MICA, with susceptibility to hepatitis C virus-associated dilated cardiomyopathy (Shichiet al. 2005).
1.6.3 Structure, biochemical function and cellular localization of BAT1