warwick.ac.uk/lib-publications
Original citation:
Despotou, George, Jones, Richard W. and Arvanitis, Theodoros N. (2016) Using event trees
to inform quantitative analysis of healthcare services. In: 14th International Conference on
Informatics, Management and Technology in Healthcare, Athens, 1-3 Jul 2016. Published in:
Studies in health technology and informatics, 226 pp. 119-122.
Permanent WRAP URL:
http://wrap.warwick.ac.uk/79948
Copyright and reuse:
The Warwick Research Archive Portal (WRAP) makes this work by researchers of the
University of Warwick available open access under the following conditions. Copyright ©
and all moral rights to the version of the paper presented here belong to the individual
author(s) and/or other copyright owners. To the extent reasonable and practicable the
material made available in WRAP has been checked for eligibility before being made
available.
Copies of full items can be used for personal research or study, educational, or not-for-profit
purposes without prior permission or charge. Provided that the authors, title and full
bibliographic details are credited, a hyperlink and/or URL is given for the original metadata
page and the content is not changed in any way.
Publisher’s statement:
“The final publication is available at IOS Press
http://dx.doi.org/10.3233/978-1-61499-664-4-119
A note on versions:
The version presented here may differ from the published version or, version of record, if
you wish to cite this item you are advised to consult the publisher’s version. Please see the
‘permanent WRAP URL’ above for details on accessing the published version and note that
access may require a subscription.
Using Event Trees to Inform Quantitative
Analysis of Healthcare Services
George DESPOTOUa,1, Richard W. JONESb, Theodoros N. ARVANITISa aInstitute of Digital Healthcare, WMG, University of Warwick, UK
bDepartment of Computer Science, University of York, UK
Abstract. The paper illustrates how event tree diagrams, used in safety engineering, can be applied to test the design of a healthcare service. Event tree diagrams can be employed to inform quantitative approaches to quality, by providing justification with respect to safety, of operational aspects to be monitored and measured.
Keywords. Event tree analysis, lean healthcare, quantitative analysis, metrics.
Introduction
Quality improvement involves understanding the operational aspects of every service, improving potential weaknesses. It considers potential failures in the intended service, identifying whether they are plausible, and if so, what controls can be introduced to manage their negative effects (e.g., safety risk to patients). Quantitative methods have been used in healthcare to identify how operational elements affect the overall goals of the service, and subsequently drive quality improvement. The Gershon review [1], carried out during 2003-4, stipulated that the UK National Health Service (NHS) would be expected to make £6.5bn a year savings by 2008 with an improvement in productivity. It was expected that patient care will also improve as a result of the productivity improvement. This provided impetus to efforts to introduce the Lean and Six Sigma methods in the NHS (although the emphasis has been on the introduction of Lean thinking) [2, 3, 4].
Quantitative methods provide good evidence and data, on which to act, for improvement. However, a drawback is that their efficiency depends on the relevance of the data collected. For example, a quantitative approach may show a very good achievement of a metric X (e.g., 6σ), but metric X may not explain how it achieves a wanted attribute (e.g., safety levels of the service) [5]. Compliance to goals prescribed in guidance and standards provides some assurance about relevance of metrics. However, guidance may not apply as-is to all organisations, due to local variation in practice; something that is increasingly appreciated in practice. For example, the UK health IT Information Standards Board (ISB) standards ask for an explicit explanation of achievement of safety supported by evidence. This entails an understanding of the causal chain from failure to harm, as well as the controls employed to manage the associated risk.
Event Tree Analysis (ETA) is a method in safety engineering, designed to explore the potential outcomes of failures, testing the suitability of the controls in place (or highlight the lack of) [6]. ETA can help to identify the critical elements of the service
with respect to safety, which should be on the focus of quantitative analysis. The paper illustrates, how ETA can be applied to a pathway supporting safety improvement. ETA is used to inform quantitate analysis, providing justification about the relevance of the parts of the service that should be monitored, with the safety of the service.
1.Controlling risks in a healthcare service
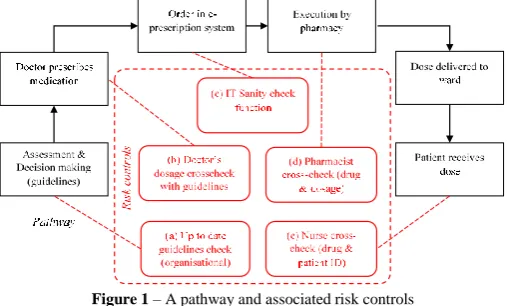
[image:3.595.180.434.331.484.2]When a service is identified as capable to contribute to harm, controls are implemented to prevent the harm, or mitigate its effects. There are various types of controls focusing on: a) the social aspect of the service (e.g., skill), b) the organisational aspect (e.g. procedures and best practice used) as well as on c) the technical aspect (e.g., IT or devices). Not all controls are suitable for all circumstances, the characteristics of which, as well as their cost, needs to be considered. For example, an IT prescription function that checks thousands of doses automatically, can be more effective than manual checks; whereas IT is less efficient with unique situations when judgment and research is needed.
Figure 1 – A pathway and associated risk controls
Figure 1 illustrates an example of a healthcare service, annotated with controls during each step that have been introduced to prevent harm to the patient.
2.Using event trees to explore safety outcomes and sufficiency of risk controls
administered to patient (where the event tree in Figure 2 ends), which would explore the respective controls. It is worth noticing that detection mechanisms can be seen as risk controls. The results of ETA may lead to re-design of the service and its risk controls.
Figure 2– Event Tree Diagram of the prescription pathway
Quantitative event trees have been used, annotated with the probability of each event, to estimate risk (i.e. severity and likelihood of outcomes). Given the initiating event, probability P of each outcome can be calculated by the different paths in the event tree. For example, for outcome O.1.1.1, P(O.1.1.1) = P(A.1.1.1)*P(A.1.1)*P(A.1). In order to create a quantitative event tree data about the failure rates of each control, which requires a monitoring mechanism that will collect the necessary metrics.
3.. Event trees informing the metric selection process
Event trees and quantitative methods, such as 6-Sigma and statistical analysis, complement each other well. Event trees explore a service, but on their own can only provide one dimension of risk (i.e. severity), and they need reliable data to estimate the likelihood of an outcome, hence defining risk. On the other hand, quantitative methods are not alien in healthcare, and provide a good set of methods to collect data. However, the relevance of this data is often stipulated in standards, neglecting the actual causal chain that can lead to risk in each organization. ETA can interface with quantitative approaches, providing the necessary safety justification to formulate safety specific goals, which then can be broken down to more detailed metrics. For example, a 6-Sigma
process can be applied to a
pharmacist dosage cross-check
success rate goal.
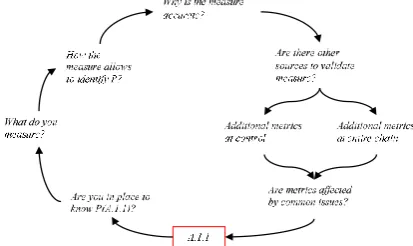
By applying ETA we manage to establish a viewpoint of the service, with the functions that are most crucial to safety. ETA allows to highlight the risk controls that are designed to address a failure from harming patients. Figure 3 presents a set of questions critically evaluating the available metrics (if any are existing), focusing on
[image:4.595.126.333.578.701.2]identifying the probability of a tree branch (i.e. the failure likelihood of a risk control). Following establishing whether P can be calculated (steps 1 & 2), step 3 highlights the importance to examine potential inference leaps from metrics to conclusion, by asking for a justification. Next, accuracy of the metrics is considered; for example, automated data collection may be more reliable than questionnaires. Additional data sources that validate the result (P) separately should be considered, as this will increase the confidence in the data. This may include additional sources locally, but also in the entire service (see causal chain validity in next paragraph). Finally, care should be taken to check whether these metrics, albeit presented in different format, have a common metric in another place (e.g. both extracted by the same source). These metrics would be as good as their common metric, and cannot be used to independently verify calculations for P.
The end goal should be used to check the validity of the causal chain established by the ETA (or in combination with other analysis methods). For example, if the observed
probability (i.e. harm caused) of outcome O.1.1.1 does not match the calculated
probability of A.1.1.1, it could indicate a problem with the causal chain. This could be true even if the observed probability is better than expected, as the team in charge of ETA may have missed a control, which if not rectified may lead to the control not being properly maintained, becoming in the future even a source of risk.
Conclusions
ETA can provide significant benefits to safety analysis of a healthcare service by testing potential outcomes of a failure. Participants can examine and discuss the role or risk controls and how they are expected to manage risks. ETA can provide necessary context to quantitative analysis, justifying the selection of goals (and detailed metrics) explicitly with respect to safety. This addresses issues such as relevance of metrics, as well as it acknowledges the variation of risk controls in each organisation, something that is not addressed by guidance and best practice. The method in the paper also provides a framework for critical evaluation of metric collection. Employing this kind of framework is expected to contribute to making healthcare services more amenable to safety certification, which requires consideration of the causal chain. The work presented in this paper has resulted in a rudimentary framework, but further larger scale clinical analysis is needed in the future to establish more evidence about the benefits of ETA.
References
[1]P. Gershon, Releasing resources to the front line; Independent Review of Public Sector Efficiency,
http://webarchive.nationalarchives.gov.uk/20130129110402/http://www.hm-treasury.gov.uk/d/efficiency_review120704.pdf (accessed March 17, 2016).
[2]D.T. Jones, J. Filochowski, Lean healthcare. Think yourself thin, Health Service Journal supplement,
116(6000):Suppl. 6-7 May 2006
[3]N.Westwood, K.Silvester, Leaning towards efficiency, HealthcareFinance,. pp. 13-16. November 2006.
[4] N. Westwood, M.J. Moore, M. Cooke, Going lean in the NHS, NHS Institute for Innovation and
Improvement,
http://www.institute.nhs.uk/option,com_joomcart/Itemid,26/main_page,document_product_info/produc ts_id,231.html accessed (17 March 2016)
[5]J. Galli, N. Riebling, C Paraso, G. Lehmann, M. Yule, Using Six Sigma to Improve Patient Safety in the
Perioperative Process, Patient Safety & Quality Healthcare, July/August 2013.
[6]Anon, Next Generation Nuclear Plant Probabilistic Risk Assessment White Paper, Idaho National
Laboratory Report, INL/EXT-11-21270, September, 2011
[7]A. Ronza, S. Fe´lez, R.M. Darbra, S. Carol, J.A. Vı´lchez, J. Casal, Predicting the frequency of accidents