go.warwick.ac.uk/lib-publications
Original citation:
Thring, C. B., Fan, Yichao and Edwards, R. S. (Rachel S.) (2017) Multiple focused EMAT
designs for improved surface breaking defect characterization. In: 43rd Annual Review of
Progress in Quantitative Nondestructive Evaluation, Atlanta, GA, USA, 17-22 Jul 2016.
Published in: AIP Conference Proceedings, 1806 (1). 020019.
Permanent WRAP URL:
http://wrap.warwick.ac.uk/89547
Copyright and reuse:
The Warwick Research Archive Portal (WRAP) makes this work by researchers of the
University of Warwick available open access under the following conditions. Copyright ©
and all moral rights to the version of the paper presented here belong to the individual
author(s) and/or other copyright owners. To the extent reasonable and practicable the
material made available in WRAP has been checked for eligibility before being made
available.
Copies of full items can be used for personal research or study, educational, or not-for profit
purposes without prior permission or charge. Provided that the authors, title and full
bibliographic details are credited, a hyperlink and/or URL is given for the original metadata
page and the content is not changed in any way.
Publisher’s statement:
This article may be downloaded for personal use only. Any other use requires prior permission of the author and AIP Publishing.
The following article appeared in Thring, C. B., Fan, Yichao and Edwards, R. S. (Rachel S.) (2017) Multiple focused EMAT designs for improved surface breaking defect characterization. In: 43rd Annual Review of Progress in Quantitative Nondestructive Evaluation, Atlanta, GA, USA, 17-22 Jul 2016. Published in: AIP Conference Proceedings, 1806 (1). 020019.and may be found at
http://dx.doi.org/10.1063/1.4974560
A note on versions:
The version presented here may differ from the published version or, version of record, if
you wish to cite this item you are advised to consult the publisher’s version.
Multiple
Focused
EMAT
Designs
f
or
Improved
Surface
Breaking
Defect
Characterization
C.
B.
Thring
1,
Y.
Fan
1, a
nd
R.
S.
Edwards
1,a)1DepartmentofPhysics,UniversityofWarwick,CoventryCV47AL,UnitedKingdom
a)Corresponding author: [email protected]
Abstract.UltrasonicRayleighwavescanbeemployedforthedetectionofsurfacebreakingdefectssuchasrollingcontact fatigueandstresscorrosioncracking.ElectromagneticAcousticTransducers(EMATs)arewellsuitedtothistechniqueas theycandirectlygenerateRayleighwaveswithinthesamplewithouttherequirementforwedges,andtheyarerobustand inexpensivecomparedtolaserultrasonics.ThreedifferentEMATcoiltypeshavebeendeveloped,andthesearecompared toassesstheirabilitytodetectandcharacterizesmall(downto0.5mmdepth,1mmdiameter)surfacebreakingdefectsin aluminium.Thesedesignsare:apairoflinearmeandercoilsusedinapseudo-pulse-echomode,apairoffocusedmeander coilsalsousedinpseudo-pulse-echomode,and apairoffocusedracetrackcoils usedin pitch-catchmode. Thelinear meandercoilsareabletodetectmostofthedefectstested,buthaveamuchlowersignaltonoiseratioandgivelimited sizinginformation.Thefocusedmeandercoilsandthefocusedracetrackcoilscandetectalldefectstested,buthavethe advantagethattheycanalsocharacterizethedefectsizesonthesamplesurface,andhaveastrongersensitivityattheir focalpoint. Measurements usingall threeEMAT designs are presentedandcompared forhighresolution imagingof surface-breakingdefects.
INTRODUCTION
EMAT methods are a unique ultrasonic non-destructive testing solution due to their generation mechanism which requires no contact or coupling, and as such are well suited to a variety of difficult testing situations, such as hot, rough, and rusted metals, or through coatings. They generate in electrically conducting materials via the Lorentz force mechanism. An EMAT consists of a wire coil through which a strong alternating current is pulsed, and as such can operate without contacting a material, and their main temperature limitation is their magnet Curie temperature [1]. A magnet is typically used as an enhancement to the fluctuating magnetic self-field created by the AC pulse in the wire coil for generation [2]. This fluctuating field causes an alternating Lorentz force on the delocalized electrons in a material causing them to oscillate. Due to the disparate size of the electrons and typical sample ions transfer of momentum is relatively inefficient. The detection process is more efficient as it does not require this momentum transfer as the electrons will be moving already as part of the ultrasound wave, causing induction in a detection coil with a magnetic field present. EMAT detection is therefore sensitive to the particle velocity [3]. The magnet is a requirement for detection.
For early stage defect detection of surface breaking defects, sub-millimeter defect depth detection is neces-sary [4]. When directly compared to piezoelectric methods EMAT generation is relatively inefficient, making detec-tion of sub-millimeter defects a challenge. Larger EMATs will typically generate a stronger signal pulse, however, this comes at the expense of reducing the spatial resolution capabilities. A method for enhancing ultrasonic signal strength, and to improve resolution, is to focus the beam profile. This has been done with a variety of ultrasonic techniques, such as focusing using piezoelectric arrays [5], laser beam optics [6], and laser beam patterning [7]. Previous work on EMAT focusing includes line focusing [8] and point focusing [9] of EMAT shear waves into a sample bulk, and some designs are available on focused meander line generation coils for Rayleigh waves [10], however, little work has been done to characterize their behavior.
also performed in both reflection and transmission [11]. For ultrasonic Rayleigh waves the majority of the wave energy travels within one wavelength of the sample surface, so for a strong reflected signal the ultrasonic peak frequency should correspond to a wavelength the same size or smaller than the defect to be detected for the majority of the energy to be reflected. For this study, as sub-millimeter defects are of particular interest, the target frequency of operation is 2 MHz, giving a wavelength of 1.5 mm in aluminum. This is therefore optimized for detecting defects of around 1.5 mm depth or deeper. Higher frequency would improve depth sensitivity, however, increasing the frequency increases the complexity of the design and the difficulty of keeping a high signal strength.
In transmission the ultrasound signal is always detected unless a defect of sufficient size is present between the generator and detector coils. For a maximum change in signal strength, again, the signal should have a wavelength the same size or smaller than the defect so the defect blocks the majority of the signal, and this loss of signal indicates the defect presence. It has been found in previous work [3] that when using a broad band signal for surface defect detection in transmission, the defect depth effects the signal frequencies that can be transmitted under the defect; so a shallow defect will allow higher frequencies to transmit underneath than a deeper defect. It can be useful to use a frequency range deliberately designed to allow some signal transmission, i.e. a lower frequency signal, so that the frequency range of the transmitted signal can be analyzed [3]. When in transmission, defect depth is more typically gauged using the loss in signal strength than this frequency alteration as it is a simpler measurement to make, however, for EMATs this can be easily affected by variations in the transducer lift-offfrom the surface. Analysis of the frequency changes can therefore prove to be a more robust method for depth measurements, although other compensation techniques have been investigated [12]. This depth gauging, however, while being part of the motivation behind developing the focused transmission design, will be the subject of later work.
METHOD
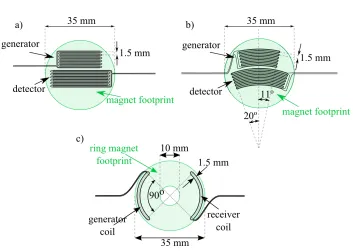
FIGURE1. EMAT coil schematics, a) shows a linear meander line pulse-echo design, b) shows a focused meander line pulse-echo
design,andc)showsafocusedracetrackpitch-catchdesign.
[image:3.612.132.485.334.585.2]circuit for both coils to improve the signal to noise ratio. They work in pseudo-pulse echo as two separate coils are used for the generation and detection of reflected waves, allowing for individual tuning and improving the noise dead time by partly isolating the detector from the generator. The generation and detection coils for the focused meander line design (b)) are both fitted under the same magnet to allow for precise and consistent alignment of their focal points for optimal detection of reflections, and also for the simplicity of scanning with only one transducer unit.
FIGURE2.AnexampleA-scanasdetectedbythetransmissiondesigninfigure1c),showingsingleshotdatawitha3cycle,2 MHz generation pulse.
Design c) had to be simplified compared to b) to allow operation in pitch-catch mode, while still keeping the simplicity and alignment of a single unit transducer, and without greatly increasing the transducer size. Meander line designs for transmission when held under a 35 mm diameter magnet would be so close together that any Rayleigh wave signal traveling between the two would be lost in the dead time caused by cross-talk between the two coils in close proximity. The racetrack design decreases the dead time to a minimum of about 2.8µs, although this increases with transducer lift off, permitting observation of the expected signal which arrives at approximately 11 µs. This can be seen experimentally from the example A-scan shown in figure 2, with the wave arriving at 10.5µs after the generation pulse start. The detection of a faster, but weaker, surface skimming longitudinal wave also indicates that this design has some in-plane generation as well as out-of-plane, unlike the meander line designs which had no detectable longitudinal components.
The magnets used for the designs in figure 1a) and b) are the same: a 35 mm diameter, 25 mm height, cylindrical NdFeB permanent magnet. The magnet used for part c) is a 35 mm diameter, 25 mm height, NdFeB ring magnet, with a 10 mm diameter central hole. The hole was primarily due to the occurrence of a Rayleigh type wave found to be generated in the magnet itself that traveled from the generator to the detector coil at a similar velocity to the Rayleigh wave velocity in aluminium, making monitoring of changes in the sample signal more complex. A useful addition to this is that it permits wave field imaging of the focal point position using a Polytec laser vibrometer scanned over the same surface and directed through the hole.
The driving current for the EMATs is provided using an adapted Ritec RAM-5000 pulser-receiver. The signal pulse used for the meander line designs was a 2 MHz, 7 cycle sinusoid. The racetrack design for transmission was powered by a 3 cycle pulse, also at 2 MHz for most of this work, however, the optimal signal strength for the design was found to be at 1 MHz. For improved signal detection, all the data shown in this work has been processed to show only the signal power; a more in depth explanation of the technique can be found in previous work by the authors [13]. This has been calculated by cross-correlating the raw data with a synthetic signal designed to mimic the generation signal, taking the absolute value of the output, to extract the signal wave packet, and then squaring it to give a power. The synthetic signal,G, was generated as follows:
G=e
−(t−t0)2
wheretis the time values over which the data has been measured,t0 is the time offset of the pulse from 0, f is the frequency, andais the bandwidth of the signal in the time domain. These were set as f=2 MHz,t0=20µs anda=1µs for the 7 cycle data, anda=0.5µs for the 3 cycle data, to match the generation pulses.
WAVE FIELD IMAGING
A laser vibrometer was used with the beam incident on the surface of an aluminium sample, to image the Rayleigh wave generated by all three transducers, with a spatial scan resolution of 0.5 mm. The output signal powers detected on the aluminium surface at particular instances in time can be seen in figures 3 and 4. The time at which the data is shown for figure 3 has been chosen such that the beam in part b) is at its strongest power, i.e. at the optimum focal position for how this coil pair behaves (see [13] for more on its profiling). The magnet positioning has been lost in part a) due to minor changes in the vibrometer focusing set up, but is aligned to match part b) where the magnet can be seen clearly due to its height change affecting the laser beam focus. The x-axes scalings are set to zero at the coil back edge. In part a) the symmetric backwards traveling waveform can just about be seen leaving the scanning range on the left hand side. The time image chosen for figure 4 is such that it matches the expected arrival time of the signal at the center of the transducer, and the same magnet interference can be seen around the edges, from the inner edge of the ring magnet.
FIGURE3. Normalized signal power of the ultrasound beams from a) the linear meander line EMAT design shown in figure 1a)
and,b)thefocusedmeanderlineEMATdesignshowninfigure1b)[13].Thepointintimeimagedhasbeenchosentoshowthe beamshapeswhenthebeamfromthefocuseddesigninb)isroughlyatitsfocalpoint.
It can be seen that the signal beam width from the linear coil is comparable to the width of the coil, 20 mm, giving a broad, weak beam, whereas the signal beam from the focused coil has a beam width of 3 mm, with a much stronger signal despite being generated by a similar sized coil. The focused racetrack beam, figure (4), has an even smaller spot size, 1.5 mm in width, as it has a larger aperture angle, however, it has a signal power of roughly half that of the meander line design as it is not optimized for a 2 MHz signal.
FIGURE4. Normalized signal power as generated by the focused racetrack EMAT design shown in figure 1c), on the aluminium
surface,measuredinsidethecentralringmagnetholeonly.Thetimeimageshownisfromabout5.5µsaftersignalgeneration initiates,whichistheexpectedarrivaltimeforthebeamatthecenterofthetransducer.
DEFECT MEASUREMENTS
FIGURE5.Scanningsetupfordefectmeasurements,a)usingareflectionEMAT,b)usingthetransmissionEMAT.
were scanned across the sample with the meander line designs parallel to the defects with the focal point aligned so as to be incident on the defect, as shown in figure 5a), and the racetrack design was scanned directly over the defects, again so as to put the focal point incident on the defect, figure 5b). The scanning resolution used was 0.25 mm.
Some example scanning results from the 1 mm depth defects using all three EMATs are shown in figure 6. All data has been processed using the respective cross-correlations outlined in the method section to show signal power in the color scale, normalized for each scan between 0 and 1, where 1 corresponds to the maximum signal power, shown as white. The scanning position of the center of the EMAT coil relative to the center of the sample is shown on the y axes, the signal time is shown on the x axes, and the defect lengths are given in the figure headers. Figure 6a) shows the results from the linear coils (design figure 1a)), b) shows the results from the focused meander line coils (design figure 1b)), and c) shows the results from the focused transmission coils (design figure 1c)). Figure 6 parts a) and b) are both reflection techniques, therefore a defect is detected at a particular displacement when the reflection signal appears (white). Part c) is the transmission technique and therefore a defect is detected at a displacement where the transmitted signal is obstructed.
FIGURE6.B-scanresultsfromthethreeEMATcoiltypes.a)showsthelinearmeanderlinereflectionresults,b)thefocused meanderlinereflectionresults,andc)thefocusedracetracktransmissionresults.
to noise ratio for reflections from defects than the other coils, although it is able to detect them. There is also no obvious change in the lateral dimensions of the reflected signals between the different length defects. In contrast, the signals from the focused designs, even on the smallest defect, can be seen to have high signal to noise ratio and a clear variation with the defect lengths. The transmission design has some transmission around the smallest defect as it is smaller than the beam width, but the wider defects do still allow a very weak amount of transmission, likely due to the defect depth being less than the ultrasound wavelength and signals being transmitted underneath.
The data from both the focused designs can be used to make defect length predictions. The maximum detected signal is found for each displacement position, eliminating the time base information. The total maximum is already normalized to 1, so a signal threshold is chosen as to quantify how much of an increase in signal (for the reflection data) or how much of a decrease in signal (for the transmission data) indicates the presence of a defect. Once a threshold level has been chosen, the maximum signal against displacement data can be interpolated to find where the signal crosses this threshold. The distance between the two crossing points was then used to give an estimate of the defect length. This was performed for a range of thresholds between 0.1 and 0.9.
Figure 7 shows how some example length measurements compared with the actual defect lengths by plotting the predicted offset: the difference between the actual defect length and the length predicted. As the data is self-normalized to 1 and already using a power scaling, taking a signal change of 0.5 gives the 3 dB point, a typical definition used for a significant signal change in ultrasonic signals. However, it was found that for the reflection data this under-estimates the defect length, and over-estimates it for the transmission data. This is likely due to the rounded ends of the defects reflecting weaker signals and diffracting more signal, and the finite size of the beams meaning there is a transition stage where the beam is only partially incident on the defect at the ends.
For all the defects scanned, the threshold at which the predicted length matches the real length for all measure-ments was found, and then the average taken. For the reflection data this was found to be a threshold of 0.3, and for the transmission this was a threshold of 0.7, i.e. a signal drop of 0.3. Using these calibrated thresholds, the reflection technique was able to predict defect lengths within an accuracy of±1 mm, and the transmission technique within
±0.6 mm. The transmission design has a higher accuracy as it has a wider aperture angle, and hence a much smaller beam spot, reducing the error introduced by the beam width moving on and offthe defect ends. It can also be seen that the 1 mm length defects, so the cylindrical hole defects, have quite a different offset to the others in the reflection technique, a), and as such are skewing the data. A higher accuracy can be achieved with the reflection technique if these are excluded when calibrating the threshold.
FIGURE7.ThedifferenceinlengthbetweentheactualdefectlengthandthelengthpredictedfromtheBscanfortwodifferent defectdepths,andtwodifferentpowerlevels,a)fromthereflectionmeander-lineEMAT,andb)fromthetransmissionracetrack
[image:8.612.74.541.434.616.2]CONCLUSION
Two focused EMAT techniques were employed to detect and size a variety of defects, and were compared to the performance of a more standard linear meander EMAT. The focused EMATs were found to pick up defects with a greatly improved signal to noise ratio when compared to the standard EMAT and were able to size defect lengths to within±1 mm in reflections and±0.6 mm in transmission, while the standard EMAT could not distinguish varied lengths, likely as they were all narrower than the transducer size.
Initial tests also show that the racetrack transmission EMAT design has the potential to be used for frequency dependent defect depth calibration, as, when used at 1 MHz, significant transmission can be found under the defects with a clear frequency shift due to the defect depth. Work is ongoing to use this for a robust calibration of the defect depths, independent of variations in transducer lift-off. Further work is also looking at a versatile design of a set of four such coils, with the second two coils also under the same magnet and identical to the first pair but oriented at 90◦ to the first two coils. This can be employed as two separate pitch-catch pairs, and so covering a wide range of defect angles, or used as one generator with three detectors, looking for side reflections from angled defects.
ACKNOWLEDGMENTS
CBT would like to thank EPSRC and the University of Warwick for funding her PhD studies.
REFERENCES
1 2 3 4 5 6 7 8 9M.HiraoandH.Ogi,EMATsforScienceandIndustry:NoncontactingUltrasonicMeasurements(Kluwer AcademicPublishers,Boston,2003).
S.DixonandX.Jian,AppliedPhysicsLetters89,p.193503(2006). R.S.Edwards,S.Dixon, andX.Jian,Ultrasonics44,93–98(2006). J.W.Ringsberg,InternationalJournalofFatigue23,575–586(2001).
W.A.K.Deutsch,A.Cheng, andJ.D.Achenbach,IEEETransactionsonUltrasonics,Ferroelectrics,and FrequencyControl2A,333–340(1983).
S.Dixon,T.Harrison,Y.Fan, andP.A.Petcher,JournalofPhysicsD:AppliedPhysics45,p.175103(2012). T.Stratoudaki,J.A.Hernandez,M.Clark, andM.G.Somekh,MeasurementScience &Technology 18, 843–851(2007).
H.Ogi,M.Hirao, andT.Ohtani,Ferroelectrics,andFrequencyControl46,341–346(1999).
T.Takishita,K.Ashida,N.Nakamura,H.Ogi, andM.Hirao,JapaneseJournalofAppliedPhysicsl54,p. 07HC04(2015).
10 American Society for Testing and Materials: Standard practice for ultrasonic examinations using electro-magnetic acoustic transducer (EMAT) techniques, Designation: E 1816 - 96 ( 1996).
11 M. H. Rosli, B. Dutton, and R. S. Edwards,NDT&E International49, 1–9 (2012). 12 J. P. Morrison, S. Dixon, M. D. G. Potter, and X. Jian,Ultrasonics44, 1401–1404 (2006).