, 20132883, published 15 January 2014
281
2014
Proc. R. Soc. B
Ewan D. Wakefield, Richard A. Phillips and Jason Matthiopoulos
black-browed albatross
central-place forager: the sky is not the limit for the
Habitat-mediated population limitation in a colonial
Supplementary data
tml
http://rspb.royalsocietypublishing.org/content/suppl/2014/01/13/rspb.2013.2883.DC1.h
"Data Supplement"
References
http://rspb.royalsocietypublishing.org/content/281/1778/20132883.full.html#ref-list-1
This article cites 43 articles, 6 of which can be accessed freeThis article is free to access
Subject collections
(257 articles)
environmental science
(1573 articles)
ecology
Articles on similar topics can be found in the following collections
Email alerting service
right-hand corner of the article or click Receive free email alerts when new articles cite this article - sign up in the box at the topherehttp://rspb.royalsocietypublishing.org/subscriptions
go to:
rspb.royalsocietypublishing.org
Research
Cite this article:
Wakefield ED, Phillips RA,
Matthiopoulos J. 2014 Habitat-mediated
population limitation in a colonial central-place
forager: the sky is not the limit for the
black-browed albatross.
Proc. R. Soc. B
281
:
20132883.
http://dx.doi.org/10.1098/rspb.2013.2883
Received: 7 November 2013
Accepted: 10 December 2013
Subject Areas:
ecology, environmental science
Keywords:
population regulation, seabirds, density
dependence, habitat preference, net primary
production, spatial segregation
Author for correspondence:
Ewan D. Wakefield
e-mail: ewan.wakefield@glasgow.ac.uk
†
Present address: Institute of Biodiversity,
Animal Health and Comparative Medicine,
University of Glasgow, Glasgow G12 8QQ, UK.
Electronic supplementary material is available
at http://dx.doi.org/10.1098/rspb.2013.2883 or
via http://rspb.royalsocietypublishing.org.
Habitat-mediated population limitation
in a colonial central-place forager:
the sky is not the limit for the
black-browed albatross
Ewan D. Wakefield
1,2,†, Richard A. Phillips
1and Jason Matthiopoulos
31British Antarctic Survey, Natural Environment Research Council, High Cross, Madingley Road,
Cambridge CB3 0ET, UK
2Scottish Oceans Institute, School of Biology, University of St Andrews, Fife KY16 8LB, UK
3Institute of Biodiversity, Animal Health and Comparative Medicine, University of Glasgow, Glasgow G12 8QQ, UK
Animal populations are frequently limited by the availability of food or of habitat. In central-place foragers, the cost of accessing these resources is distance-dependent rather than uniform in space. However, in seabirds, a widely studied exemplar of this paradigm, empirical population models have hitherto ignored this cost. In part, this is because non-independence among colonies makes it difficult to define population units. Here, we model the effects of both resource availability and accessibility on populations of a wide-ranging, pelagic seabird, the black-browed albatross Thalassarche melanophris. Adopting a multi-scale approach, we define regional populations objectively as spatial clusters of colonies. We consider two readily quantifiable proxies of resource availability: the extent of neritic waters (the preferred fora-ging habitat) and net primary production (NPP). We show that the size of regional albatross populations has a strong dependence, after weighting for accessibility, on habitat availability and to a lesser extent, NPP. Our results pro-vide indirect support for the hypothesis that seabird populations are regulated from the bottom-up by food availability during the breeding season, and also suggest that the spatio-temporal predictability of food may be limiting. More-over, we demonstrate a straightforward, widely applicable method for estimating resource limitation in populations of central-place foragers.
1. Introduction
A fundamental question posed by ecologists is: what factors regulate population growth? Often, food availability is assumed to be limiting [1]. However, many mobile species, including all birds and many insects and mammals, not only gather food, but also return it to a breeding site or refuge. Foraging costs therefore increase as a function of distance from that central place [2]. Hence, not only resource availability but distance-dependent accessibility (sensu Matthiopoulos [3]) may be hypothesized to limit population size. However, population studies on colonial central-place foragers, such as seabirds, bats and hirundines, frequently make the implicit assumption that resources are equally accessible [4–8], with the potential consequence that an important limitation on population size is ignored. Seabirds have long been used to test theories on population regulation [5,9–11]. Latterly, however, the need to understand their population dynamics has become more than academic, because many species are endangered by fisheries bycatch, over-fishing, invasive species and climate change [12–14]. Such anthropogenic factors are additive to natural limits on population growth [13], so in order to understand their impacts, it is necessary to first quantify the processes that natu-rally limit seabird populations. Food availability is usually considered to be a key driver of population change [9,10], but parasites, disease and nesting habitat availability can also have negative, density-dependent effects [15–17], whereas
episodic environmental perturbations may also limit some populations [18]. By contrast, natural predation has a minor impact on most species, and adult survival is high compared with other avian groups [19]. As such, the natural regulation of seabird populations is primarily thought to be a bottom-up process, driven by environmental regulation of food supply [14]. Owing to spatio-temporal variability in physical forcing in the marine environment, seabird prey are patchily distrib-uted [20]. In order to meet the energetic demands associated with self-maintenance and provisioning of offspring, pelagic seabirds range widely (10 –1000s km) from their colonies during breeding. Consequently, seabird populations are hypothesized to be limited by the distribution of food relative to their colonies. However, most studies of regional popu-lation limitation have made the implicit assumption that prey within potential foraging range are uniformly distribu-ted and equally accessible [4– 6,10,19]. This assumption is perhaps expedient, because the distribution of seabird prey cannot be measured simultaneously at wide scales [21]. How-ever, proxies of food availability may be more easily surveyed. For example, it is assumed that foraging birds preferentially select profitable habitats [22]. Hence, habitat preference, which can be defined using indices measurable at ocean-wide scales (e.g. bathymetry, thermal gradients, ocean colour, etc. [21,23,24]), may reflect prey availability. However, habitat preference is not only dependent on food abundance. For example, in a patchy, dynamic environment, it could also reflect prey predictability [25]. Hence, preferred foraging habitat may be more usefully regarded as a limiting resource in itself, rather than as a proxy for food availability. An alternative proxy, which can be estimated from remotely-sensed data [26], is net primary production (NPP). Primary production is spatio-temporally patchy but integrated over time and space it limits the distribution of mid-trophic level species (fish, squid and crustaceans) [27,28], which in turn sup-port pelagic seabirds. However, owing to the complexities of trophic transfer and interspecific competition [29], the food available to foraging seabirds may not be directly proportional to primary production.
The principal mechanism through which food availability is hypothesized to limit seabird populations is density-dependent competition during the breeding season [9]. As individual colonies grow in size, prey in surrounding waters are depleted or disturbed in widening halos. Consequently, birds must travel ever further to provision their young, such that the net delivery rate decreases, eventually becoming unsustainable. This is supported by evidence of prey depletion around colonies [30], correlations between foraging range and colony size [11], home range area and colony size [31], and breeding success and proxies of food abundance [14,19,32]. However, the situation becomes more complex in areas where adjacent colonies are very large or located relatively close together. Here, density-dependent intraspecific compe-tition between birds from adjacent colonies can result in segregation of foraging areas [31]. Hence, even apparently dis-tinct colonies may not be functionally independent [5,31], potentially confounding the relationship between regional population size and food availability. If neighbouring colonies compete for the same resources, then it has been predicted that colony size will correlate negatively with the number of neigh-bouring conspecifics within the potential foraging range [5]. However, if colony size is limited largely by regional food availability, these two factors would be positively correlated.
Black-browed albatrossesThalassarche melanophrisare very wide-ranging pelagic seabirds (max. foraging range approx. 3000 km [23]) and probably the world’s most abundant alba-tross species (approx. 600 000 breeding pairs; electronic supplementary material, table S1). They breed in archipelagos and on isolated islands throughout the sub-Antarctic (figure 1). Black-browed albatrosses are useful model colonial central-place foragers, because all of their major colonies have been censused in recent years, and their habitat use and preferences quantified [23,24,33]. Moreover, there is an urgent need to understand natural population regulation in this species, because it is currently threatened by bycatch in longline and trawl fisheries [13].
Black-browed albatrosses prefer to forage in neritic waters, which are markedly more productive than oceanic waters (e.g. fish production is an order of magnitude higher in shelf waters [27]). However, the oceanographic regime in waters around their colonies varies considerably by region (reviewed by [34]). Black-browed albatross demographic par-ameters have been linked to oceanographic variability [13,32] and population size to regional resource availability [19]. We therefore hypothesized that regional albatross population
100 1000 1000 50 km
50 km 50 km 60° W 30° W
30° S
(a)
(b)
(c) 50° S
70° S
30° E 60° E 90° E 120° E 150° E 0°
regional population (breeding pairs): colony
(a) (b)
(c)
1 2
3
4 5
7
6
8
9
10 11
12 13 14 15
16 17
18
[image:3.595.316.551.42.402.2]19
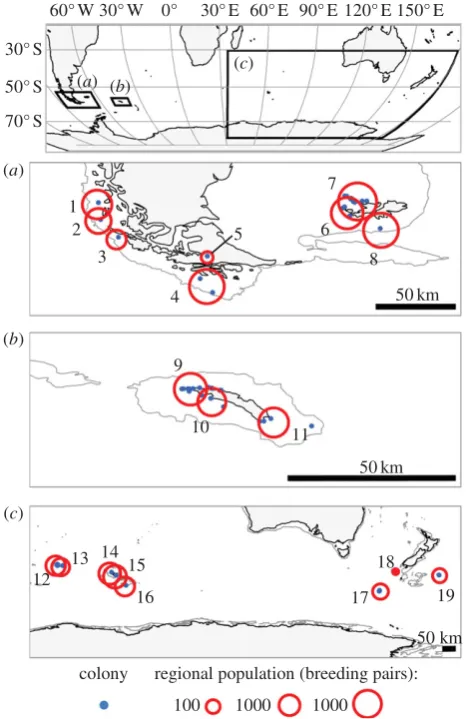
Figure 1.
Location and size of black-browed albatross colonies. All known
colonies (
n
¼
48) were grouped into regional populations by cluster analysis
such that the maximum distance by sea between colonies within regional
populations
d
i,jwas
50, 100, 200, 400 and 800 km. For illustration,
open circles indicate the number of pairs of birds breeding annually in
regional populations defined by
d
i,j100 km ( population numbers
corre-spond to those in the 100 km column; electronic supplementary material,
table S2). (Online version in colour.)
rspb.r
oy
alsocietypublishing.org
Pr
oc.
R.
Soc.
B
281
:
20132883
size is limited principally by the availability and accessibility of foraging resources during the breeding season (we use the term foraging resources advisedly to indicate foraging habitat or NPP, which we consider indirect proxies of either food availability or predictability). Owing to environmental stochasticity, equilibrium population size is generally lower than the theoretical carrying capacity of the environment [35]. Therefore, although we analysed factors limiting observed population size, we assume that these also limit car-rying capacity. We define population units objectively as spatial clusters of colonies and test whether habitat, NPP or both together best describe observed population size. By repeating our analysis at several spatial scales, we provide strong evidence that regional albatross populations are lim-ited by both the availability and accessibility of foraging habitat during the breeding season. We suggest that the causal mechanism is density-dependent competition for food. Our intuitive models of resource limitation are appli-cable to other colonial central-place foragers, including seabirds, pinnipeds, hirundines and bats.
2. Material and methods
(a) Defining regional populations
We collated colony size estimates (breeding pairs) for all extant black-browed albatross colonies (see the electronic supplementary material, table S1). If data were available for more than one breed-ing season, then we selected estimates that coincided with NPP data coverage (see below). Using cluster analysis [36], we grouped adjacent colonies into nominal regional populations according to the intervening distances. Because albatrosses avoid crossing large land masses, we used the minimum great-circle distance by seadthroughout our analysis. On a 1/68regular grid, we calcu-lated minimum distancesdi,xfrom theith colony to each grid cell
xat sea as well as the distancesdi,jbetween all pairs of coloniesi and j. We then used a complete-linkage clustering algorithm, implemented with the function ‘hclust’ in the R package ‘cluster’ [37], to group adjacent colonies hierarchically by distance into regional populations. Colony clusters were determined at five spatial scales (di,j¼50, 100, 200, 400 and 800 km). At each scale, we then defined regional population size Nas the number of pairs of albatrosses breeding annually within each cluster. Scales were chosen to group colonies with potentially overlapping fora-ging ranges likely to be subject to the same meso- to macroscale habitat availability and oceanographic regimes. Oceanographic variability at finer scales could not be resolved using available NPP data, and larger scale clustering would have resulted in too few clusters for meaningful analysis. Because potential compe-tition between seabirds from adjacent colonies is thought to be density-dependent [31], our results are likely to be sensitive to assumeddi,jat smaller rather than at larger distances. For compu-tational efficiency, we therefore specified a logarithmic range of values ofdi,j.
(b) Resource availability and accessibility
We used gridded proxies of foraging resource abundance to explore the factors limiting population size. We deemed grid cells accessible from each colony to be those within the maximum foraging range of breeding adultsdmax. This we assumed to be
3200 km (1.1the maximum observed foraging range of 163 black-browed albatrosses satellite-tracked from eight colonies throughout the breeding distribution [23]). In order to characterize the habitat type, we obtained bathymetric data from the ETOPO2 Global Relief 2v2 dataset (US Department of Commerce, National
Oceanic and Atmospheric Administration, National Geophysical Data Center, 2006), and re-sampled these on a 1/68grid. On the basis of previous research [23], we defined the extent of preferred foraging habitatH as waters,500 m deep (i.e. neritic waters). Accordingly, cells were flagged as preferred, if the depthzxwas less thanzp¼500 m.H, the total area of preferred habitat available to birds from theith regional population, is then
Hi¼
X
Allx
Axdi;xjx; where di;x¼
1; ifdi;x,dmax
0; otherwise
and jx¼
1; ifzx,zp 0; otherwise
;
ð2:1Þ
whereAxis the area of thexth grid cell. The relative accessibility of grid cells is assumed to be inversely proportional to colony dis-tance [23] and is defined as
ai;x¼ dmax
di;xþ1
: ð2:2Þ
The total preferred accessibility-weighted (hereaftera-weighted) habitat available to each population is then
H0
i¼
X
Allx
Axdi;xjxax: ð2:3Þ
Monthly NPP climatology data (mg carbon (C) m22d21) for
the period 1998–2007 were supplied by Robert O’Malley and the Ocean Productivity website (http://science.oregonstate. edu/ocean.productivity; 2009) on a 1/68 grid for the black-browed albatross breeding period (September –April). NPP estimates were generated using a vertically generalized production model [26]. In order to describe regional variation in the rate of NPP, we calculated the decadal mean of the monthly median NPP in waters accessible to each population. We next quantified the total amount of NPP available to each population, in each month:
Pi¼
X
Allx
AxNPPxdi;x; ð2:4Þ
and the total availablea-weighted NPP is
P0i¼
X
Allx
AxNPPxdi;xax: ð2:5Þ
(c) Breeding success
Estimates of the annual breeding success ( proportion of eggs laid that resulted in a fledged chick) of black-browed albatrosses were made available from a long-term study colony on Bird Island, South Georgia (548000S, 388030W). Each year during laying,
daily visits are made to the colony, and all nests with an egg are marked. Thereafter, breeding outcome is monitored in weekly visits, until the time of fledging.
(d) Statistical analysis
In order to test whether adjacent colonies have a limiting effect on one another, following Furness & Birkhead [5], we calculated the Pearson correlation coefficient between colony size and the square-root of the number of pairs breeding at neighbouring colo-nies. Neighbouring colonies were defined as those within putative foraging range, which was successively assumed to be 50, 100, 200, 400, 800, 1600 or 3200 km. Colony size, which in seabirds is generally lognormally distributed [38], was loge-transformed to improve normality.
In order to determine whether resource availability limits alba-tross population size, we first modelledNas a function ofHorP
using linear and quadratic regression. We then assessed whether resource accessibility was also limiting by modelling N as a function of H0 or P0 and comparing relative model fit using
second-order Akaike’s information criterion (AICc) andR2. The
rspb.r
oy
alsocietypublishing.org
Pr
oc.
R.
Soc.
B
281
:
20132883
same procedure was used to assess seasonal variation in the dependence of population size on primary production. Similarly, in order to test whether monthlyPorP0limits breeding success,
and therefore population size (through the putative mechanism of food limitation), we tested for correlations between breeding success at Bird Island and these covariates.
Having determined whether it was appropriate to weightH
andPby accessibility, we used likelihood ratio tests and AICcto
test whether these covariates acted in concert or alone to limit population size. We proceeded, by backward selection, to consider models ofNcontaining additive and multiplicative combinations ofH0andP0. We checked for collinearity between explanatory
vari-ables using variance inflation factors (VIFs). Models with VIFs exceeding 10 were regarded as unreliable [39]. We repeated model selection procedures at each regional population scale. To improve normality, assessed using Anderson–Darling tests, all covariates were loge-transformed. We assessed heteroscedasticity and spatial autocorrelation using residual plots and semivario-grams [40]. Throughout our analysis, we consideredp-values to be significant at the 0.05 level.
3. Results
Colony size was lognormally distributed (Anderson–Darling test logecolony size,A¼0.25,p¼0.711,n¼48). Depending
on the clustering scale, our analysis identified between eight and 27 regional populations (see the electronic supplementary material, figures S1–S2 and table S2). At the largest scale con-sidered (di,j¼800 km), regional populations coincided with
readily identifiable isolated islands or island groups: the coastal islands of Chile; the Falkland Islands; South Georgia; Crozet Island; Kerguelen; Heard, Bishop and Clerk Islands; Snares Island; and Bollons Island). At the scale di,j¼50 km,
regional populations tended to comprise individual island colonies in the Chilean and Indian Ocean regions, and sub-groups of colonies within the Falkland and South Georgia archipelagos. Note that at the smallest scale (di,j¼0), regional
populations are synonymous with individual colonies. At scales ofdi,j50 km, regional population size (N) was
positively correlated with the total availability of neritic habitat (H) within the maximum foraging range (figure 2aand table 1) anda-weighted habitat availability (H0; figure 2b). However, at
all clustering scales considered,H0was a better predictor ofN
than H (table 1). This pattern was clearest when colonies were clustered at scales of 50 km or more (at di,j¼50 km,
logeN¼228.6þ2.4loge H0, F1,22¼55.79, p,0.001).
At this scale and above, up to 88% of the variability inNwas explained byH0, whereasHexplained at most 64%.
The mean rate of NPP in the study area varied seasonally, peaking in December–January (figure 3a), which corresponds to the brood–guard stage. The decadal (1998–2007) mean rate of NPP in water accessible to albatrosses varied marke-dly among regions (see the electronic supplementary material, figure S3). At the scaledi,j¼100 km, the mean rate
was highest in waters accessible to birds from colonies in the Falkland Islands, South Georgia and western Australasia (range 402–408 mg C m22d21); it was intermediate in waters
accessible to Chilean and eastern Australasian breeders (379–385 mg C m22d21); and lowest around Indian Ocean colonies (312–325 mg C m22d21). This pattern was similar at
all regional population scales under consideration (see the electronic supplementary material, figure S3).
Nwas positively correlated both with total available NPP (P) and a-weighted NPP (P0) during austral midsummer
(table 1 and figure 2c). The strength of this relationship peaked in January (see the electronic supplementary material, table S3 and figure 3b). At all scales,P0proved a better
predic-tor ofN thanP (table 1 and figure 2b,c). JanuaryP andP0
explained up to 64% and 87% of the variation inN, respect-ively. There was no significant correlation between the breeding success of black-browed albatrosses at South Georgia and JanuaryP(r¼20.04,n¼10,p¼0.917). How-ever, JanuaryP0correlated positively with breeding success
(r¼0.65, n¼10, p¼0.041; electronic supplementary material, figure S4). Variance inflation factors associated
(a)
(b)
(c)
logeH
logeH'
logeP'
l o ge N 14 15 12 10 8 6 4 2 0 l o ge N 12 10 8 6 4 2 0 l o ge N 12 14 10 8 6 4 2 0
12.8 13.3
13.5
23.7 23.9 24.1 24.3 24.5
14.5 15.5 16.5
13.8 14.3 14.8
16 13 12 17 1 18 11 9 19 5 3 2 6
4 8 7
10
13 12 16
19 17 15 14 10 11 9 18 5 3 2 1 4 8 6 7 16
15 14
13 12
11 10 9 17 4 18 2 1 3 6
8 7
19
[image:5.595.321.538.40.475.2]5
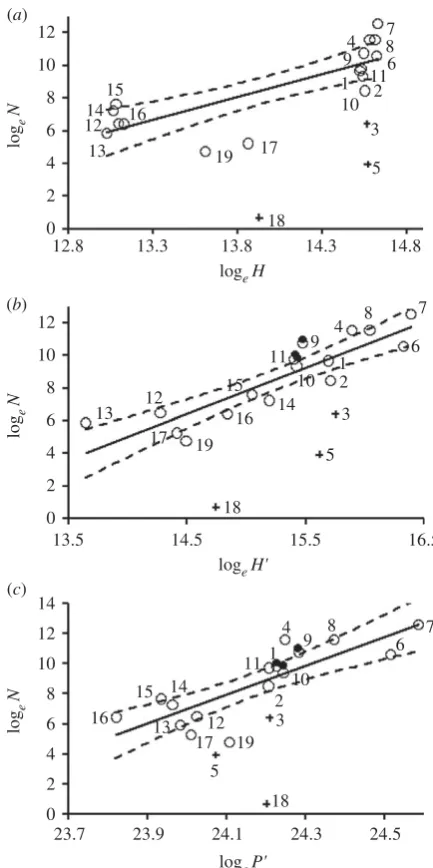
Figure 2.
Black-browed albatross population size varies with foraging
resource availability and accessibility (
n
¼
45). (
a
)
H
, the total area (km
2)
of preferred habitat (waters
,
500 m deep) within maximum foraging
range (3200 km) explains regional population size (
N
, breeding pairs)
poorly in comparison to (
b
)
H
0, the total
a
-weighted preferred habitat
and (
c
)
P
0, the total
a
-weighted daily NPP during January (Gg C d
21).
a
¼
maximum foraging range/colony distance. Colonies were grouped at
d
i,j100 km, but the trend was similar at all clustering scales. Open circles
indicate populations used to fit models, closed circles the South Georgia
population censused in 1986, and crosses known outliers (three Islote
Leo-nard, five Islote Albatros and 18 Snares Island). Population numbers refer
to figure 1 and the electronic supplementary material, table S1. Dotted
lines indicate estimated 95% CIs.
with multiplicative models ofN as a function ofH0 andP0
showed that these two covariates were highly co-linear (see the electronic supplementary material, table S4; correlation betweenH0and JanuaryP0atdi,j¼100 km:r¼0.80,n¼19,
p,0.001). However, at all scales, the most parsimonious models of N contained only one explanatory covariate, H0
(see the electronic supplementary material, table S4).
H0 and P0 explained N more effectively when colonies
were clustered into regional populations (up to 88% and 87% of the variance, respectively) than when individual colo-nies were regarded as population units (33% and 19% of population size explained, respectively). Regardless of puta-tive foraging range, we found no evidence of a negaputa-tive relationship between colony size and the number of pairs of birds breeding at other colonies within the potential foraging range (table 2). On the contrary, at putative foraging ranges of 100 km and above, there was a significant positive correlation between these factors.
4. Discussion
Our results clearly indicate that the size of regional black-browed albatross populations (N) is limited by the availability of foraging resources (preferred habitat or NPP). Weighting either resource by accessibility (the inverse of distance to breed-ing colonies) significantly improved our models, supportbreed-ing the hypothesis that resource accessibility limits the population sizes of colonial central-place foragers. Although the most parsimonious model ofN did not includeP0, annual
breed-ing success at Bird Island was correlated with January P0
. Below, we consider the implications of these findings in more detail and the rationale for our methods, which are potentially applicable to other species.
[image:6.595.38.561.101.241.2]Black-browed albatross colonies are clustered in space; larger colonies often have smaller satellite colonies in their immediate vicinity (figure 1 and the electronic supplementary material, figure S2). In these cases, neighbouring birds poten-tially compete for the same resources, so colonies may not be independent in terms of density-dependent population-regulation [5,6,31]. Depending on breeding stage, the foraging utilization distributions (UDs) of albatrosses from adjacent colo-nies are either overlapping or mutually exclusive [23,24]. The extent of colony UDs is likely to depend on colony locations, sizes and the distribution of resources [31]. By regarding regional populations as comprising all birds breeding within a particular area, we aimed to delineate population units whose potential resource use is largely independent. We defined regional
Table 1.
Goodness of fit of linear models of log
eregional black-browed albatross population size as a function of the availability and accessibility of foraging
habitat and primary production. (Values in italics indicate minimum AIC
cfor each clustering scale.
H
, total preferred habitat;
H
0,
total accessibility-weighted
preferred habitat;
P,
total net primary production in January;
P
0, total accessibility-weighted net primary production in January (all covariates log
e-transformed).
n.s.
,
not significant. *
p
,
0.05, **
p
,
0.01, ***
p
,
0.001.)
scale (km)
an
AIC
c,
R
2H
H
0P
P
00
b48
216.4, 0.13*
204.2
, 0.33***
218.5, 0.09*
212.9, 0.19**
50
24
89.3, 0.55***
78.3
, 0.72***
95.3, 0.42**
90.2, 0.54***
100
16
61.8, 0.64***
52.8
, 0.79***
64.7, 0.57**
59.6, 0.68***
200
11
47.6, 0.61**
35.0
, 0.88***
48.9, 0.56**
45.4, 0.68**
400
9
42.3, 0.58*
31.3
, 0.87***
42.8, 0.55*
39.7, 0.68**
800
7
36.8, 0.55 n.s.
27.9
, 0.88**
35.3, 0.64*
28.2, 0.87**
a
Maximum distance
d
i,j
between colonies within clusters comprising regional populations.
b
At this scale, regional populations correspond to individual colonies.
(a)
(b)
P'
(Gg C d
–1
)
R2 50
40
30
20
10
1.0 90
80
70
60 R2
AICc
AIC
c
0.8
0.6
0.4
0.2
0
Oct Nov Dec Jan month
Feb Mar Apr inc.
BG
PB
Falkland Is. S. Georgia Kerguelen
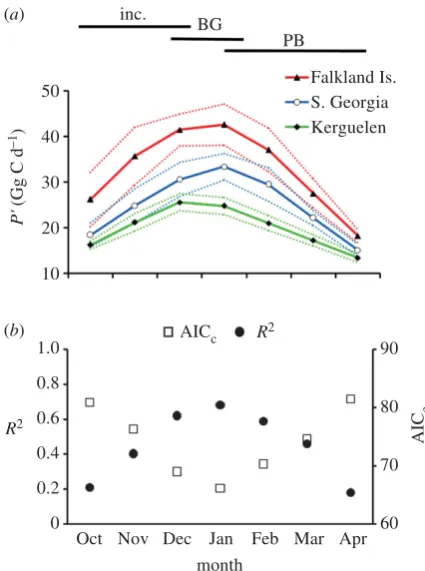
Figure 3.
Monthly variation in total net primary production (NPP) and
good-ness of fit of population models. (
a
)
P
0(accessibility-weighted NPP, in
Gg C d
21) available to breeding albatrosses. Dashed lines indicate 95%
CIs. (
b
) The goodness of fit of models of regional population size as a
func-tion of
P
0(monthly averages, 1997 – 2007). Horizontal bars indicate the
temporal extent of incubation (inc.), brood – guard (BG) and post-brood
chick-rearing (PB) periods. Colonies were grouped at
d
i,j100 km, but
the trend was similar at all clustering scales. (Online version in colour.)
rspb.r
oy
alsocietypublishing.org
Pr
oc.
R.
Soc.
B
281
:
20132883
[image:6.595.53.266.301.587.2]populations as clusters of colonies with potentially overlapping ranges (specified by the maximum distance between colonies within clusters, di,j). Importantly, this definition is based on
thepotentialrather than therealizedUD of each population. An alternative would be to define populations, using tracking data, as groups of colonies with overlapping realized foraging UDs. However, this approach would be inappropriate in the context of our analysis, because the extent of realized foraging UDs is likely to be proportional to colony size [31], leading to the circular argument that population size is dependent on habitat availability, which is dependent on population size.
The scale at which clusters of seabird colonies occur is limited by the spatial distribution of suitable sites [15]. How-ever, there is no consensus on whether this or other factors are the key constraints on distribution. Furthermore, although we assumed that regional populations were spaced suffi-ciently far apart that the potential for interpopulation competition was negligible, the minimum between-cluster distance to independence is unknown. We therefore con-ducted our analysis at multiple spatial scales (by specifying values ofdi,jranging from 50 to 800 km), allowing us to
deter-mine whether varyingdi,jaffected our results. It is possible
that albatrosses from populations more than 800 km apart compete for the same resources. However, habitat use tends to decline as an inverse function of colony distance [23], and competition among seabirds is likely to be density-dependent [9,11,31]. Hence, among-population competition is only expected to be significant between relatively close regional populations.
Adult black-browed albatrosses have very high survival rates [41]. However, over the past two decades, major declines have occurred in some populations owing to incidental mortality in human fisheries [13]. In particular, the South Georgia population declined by ca 30% over this period [42], and the Falkland Islands population by 1% per annum between 2000 and 2005 [43]. Conversely, by providing sup-plementary food, fishery waste may have enhanced breeding success in some areas [13]. As a consequence, Nmay differ from its natural equilibrium. However, albatross colony sizes are lognormally distributed and larger populations are those most affected by fisheries. Hence, the relationship between population size and resource availability is rather insensitive to proportionately slight changes in loge N (cf. loge N for
South Georgia in 1984 and 2004; figure 2b,c). The large amount of variation in N explained by habitat availability and accessibility (up to 88%; table 1) indicates that factors such as fisheries mortality accounted for relatively little
regional variation in population size. Nonetheless, global mortality owing to fisheries is high [13], and the relative effects of this and natural population limitation should be investigated further. This could be achieved by modellingN
as a function of both foraging resources and spatial proxies of potential fisheries–bird interaction rates (e.g. by integrating bird distribution and fishing effort [44]). Fisheries mortality occurs predominantly outside the breeding season [13,45], so bird–fishery encounter rates in areas used by juveniles, pre-breeders, and wintering adults would probably prove most informative [13]. Unfortunately, the distributions of many populations during these life-history stages remain poorly understood. Filling these knowledge gaps should therefore be a priority [12].
In order to interpret our results further, it is prudent to consider what mechanisms might link N to H0 or P0.
Although the hypothesis remains difficult to test directly, sea-bird populations are generally considered to be regulated from the bottom-up, by food availability during the breeding season [9,10,19]. Black-browed albatrosses predominantly consume middle-to-upper trophic level prey, such as notothe-niid and channichthyid fish, Antarctic krillEuphasia superba
and ommastrephid squid [46]. These species are typically an order of magnitude more abundant in neritic than oceanic waters [27]. Like most pelagic seabirds, black-browed alba-trosses are highly philopatric, so the number of recruits to a colony depends largely on its breeding output in previous years [41]. Hence,H0could limit population size simply by
limiting food availability and therefore chick provisioning rates. However, because the distribution of prey exploited by seabirds is characteristically patchy in time and space [20], its predictability might also determine habitat preferences [25]. At the coarse to mesoscale, the distribution of biological production in shelf seas is strongly tied to bathymetry [47], which is largely fixed over the lifespan of seabirds. Hence, the preference of birds for neritic habitats may reflect the cost of locating prey as well as its abundance. For example, foraging black-browed albatrosses from South Georgia target waters overlying shallow submarine banks, which cause spatially pre-dictable aggregations ofE. superbaand mesotrophic fishes [33]. Because chick provisioning rates, and thusN, may therefore be limited by food variability, as well as abundance [32], foraging habitat may be regarded as a resource in itself, rather than as a proxy for prey.
[image:7.595.40.559.66.207.2]Black-browed albatrosses travel 100–1000s of km from the colony during breeding, with birds from some populations foraging in oceanic as well as neritic waters [23]. At this
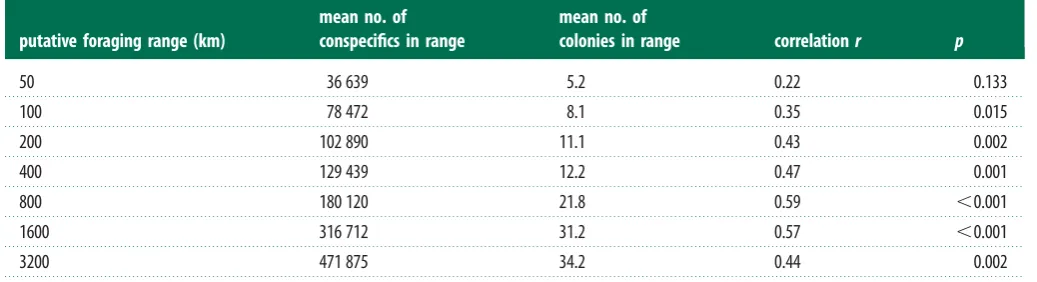
Table 2.
Correlations between black-browed albatross colony size and number of pairs breeding at other colonies within a given range (
n
¼
48).
putative foraging range (km)
mean no. of
conspecifics in range
mean no. of
colonies in range
correlation
r
p
50
36 639
5.2
0.22
0.133
100
78 472
8.1
0.35
0.015
200
102 890
11.1
0.43
0.002
400
129 439
12.2
0.47
0.001
800
180 120
21.8
0.59
,
0.001
1600
316 712
31.2
0.57
,
0.001
3200
471 875
34.2
0.44
0.002
rspb.r
oy
alsocietypublishing.org
Pr
oc.
R.
Soc.
B
281
:
20132883
scale, the abundance of mesotrophic organisms in both bathymetric regimes is determined largely by NPP [27,28]. The physical drivers that determine NPP vary markedly in type and intensity across the breeding range of albatrosses. Estimated NPP is highest in waters accessible to birds from Chile, the Falkland Islands and South Georgia (see the electronic supplementary material, figure S3), where the oceanographic regimes are dominated by three very different but productive features: the Humboldt current, a large-scale upwelling system; the Patagonian shelf, an extensive shelf sea; and the Ant-arctic polar front [34]. These three regions hold 99% of the world population of black-browed albatrosses. By contrast, total NPP in waters accessible to birds from the relatively small colonies in the Indian Ocean is low owing to a largely oceanic regime. Primary production in the Southern Ocean peaks from Decem-ber to February (figure 3a). We found thata-weighted NPP in these months was the best predictor of regional population size (figure 3b). This corresponds to late incubation and early chick-rearing, when albatross breeding attempts at Kerguelen and South Georgia are most likely to fail [32,41]. Variability in prey abundance during this period, when energetic demand probably peaks [48], offers a mechanism linking the availability of NPP to population size. This is further supported by a posi-tive correlation between the breeding success of black-browed albatrosses at South Georgia and JanuaryP0(see the electronic
supplementary material, figure S4).
As noted above, neritic waters are markedly more productive than oceanic waters. Hence,P0is inevitably
colli-near withH0. Nevertheless, we found that models ofNas an
additive function ofH0andP0 were less parsimonious than
single covariate models (table 2) and thatP0 explained less
variation inNthanH0(table 1). There are a number of reasons
why NPP may be less closely correlated withNthan habitat availability: first, the dependence of N on P0 may be an
artefact of the strong relationship between depth and NPP. This is improbable however, because the positive correlation between breeding success at South Georgia andP0is unlikely
to have arisen by chance. Moreover, breeding success at Kerguelen is correlated with local environmental indices, with the causative mechanism thought to be bottom-up regulation of prey availability [13,32]. Second, variation in prey-taxis, advection, growth rates and phenology can cause spatio-temporal lags of the order of days to years and 100– 1000s of km between primary producers and higher trophic level organisms [29,47]. However, the mean abundance of
E. superba at South Georgia reaches a maximum in the last week of January [49], the month in which NPP peaks (figure 3b), so trophic lags in this ecosystem are apparently short. Third, interspecific competition could reduce the availability of mesotrophic biomass resulting from primary production. The black-browed albatross belongs to a guild of epipelagic consumers of swarming nekton and macro-zooplankton that includes many fishes, whales, sympatrically breeding seabirds and pinnipeds [50]. It would be difficult to test this hypothesis because of the lack of data on the degree of interspecific competition. However, niche partitioning between heterospecifics is greater than that between conspeci-fics [51], suggesting a stronger limiting effect of intra- than interspecific competition.
We found that the availability of H0 and P0 explained
population size increasingly well as the scale (di,j) at which
regional populations were defined was increased (table 1). Conversely, these factors explained variation in individual
colony size poorly. This may be owing simply to the higher natural variability likely to exist in disaggregated (i.e. indi-vidual colony) data. However, it has been hypothesized that competition among seabirds from neighbouring colonies limits colony size, leading to the prediction that colony size correlates negatively with the number of conspecifics in neighbouring colonies [5]. We found no evidence of this effect (table 2). On the contrary, these covariates were posi-tively correlated, and the relationship was strongest when neighbouring colonies were defined as those within 800 km (table 2). This implies that mean colony size varies by region. Only 33% of variation in colony size was explained by resource availability and accessibility (table 1), suggesting that other factors must be limiting at this scale. These may include parasites and disease [16,17], but two other possibili-ties are suggested by outliers in our data. At clustering scales of less than or equal to 100 km, the sizes of regional popu-lations 3, 5 and 18 lie well below those predicted by either
H0orP0 (figure 2b,c). The first two of these are small islets
(Islote Leonard and Islote Albatros, approx. areas 0.15 and less than 0.5 km2, respectively) which provide limited areas
of nesting habitat. Indeed, as albatrosses require steep slopes or cliffs for take-off on calm days, the availability of suitable breeding habitat may also be limited on some of the larger islands. The remaining outlier, in the Snares Islands, is thought to be a new colony in a region that has only recently been colonized by this species [52]. As such, it may not yet have approached its equilibrium size, which our best estimate suggests is approximately 880 pairs (95% CIs 350– 2220).Ncould be further regulated by natural pro-cesses occurring outside of the breeding season [13], but it is unlikely that these would impact colonies within the same regional population differentially.
On balance, our results provide indirect support for the hypothesis that albatross populations are limited by prey availability during the breeding season [9], with the caveat that prey predictability may also be limiting [32]. We found that weighting measures of resource availability by accessibil-ity improved their explanatory power (table 1), implying that existing population and demographic models for other cen-tral-place foragers may be improved simply by weighting resource availability by accessibility. The mechanism linking albatross population size to resource accessibility seems clear: central-place theory predicts that the total cost, in time or energy, of accessing resources increases as a function of distance from the central place [2]. Hence, albatross chick provisioning rates, and ultimately colony size, will be lower if birds have to travel further to find food [9]. Importantly, this implies that population limitation in albatrosses and other central-place foragers will fluctuate with resource acces-sibility. For example, recent studies have shown that penguin breeding success declines when icebergs reduce habitat acces-sibility [18], and albatross breeding success improves in response to wind-mediated increases in habitat accessibility [53]. In the coming years, climate change is expected to cause shifts in the distribution of marine productivity [27,28]. Similarly, in the terrestrial sphere, human develop-ment has already caused widespread habitat fragdevelop-mentation. By increasing the distance between available breeding locations or refuges and foraging resources, these changes may result in declines in populations of a diverse range of central-place foragers. It is important therefore that the rela-tive effects of accessibility and other limiting factors are
rspb.r
oy
alsocietypublishing.org
Pr
oc.
R.
Soc.
B
281
:
20132883
better understood. In the case of some seabird species, habitat preferences, and therefore resource availability may be diffi-cult to quantify because they forage in association with dynamic or ephemeral features [21]. However, proxies of for-ging resource availability have been identified in many other groups of colonial central-place foragers, including bats, hirundines and pinnipeds [7,8,54]. In principle, our method-ology may therefore be used to test whether population limitation owing to resource availability and accessibility occurs more widely. Similarly, if the future distribution of resources such as NPP or foraging habitat can be predicted,
then the potential effects of environmental change on central-place forager populations may be investigated.
Acknowledgements.We thank Robert O’Malley for supplying NPP data; the many researchers who censused the world’s black-browed albatross colonies; fieldworkers at Bird Island; John Croxall for sup-porting the long-term studies there; Simeon Hill and Jaume Forcada for statistical advice; and two anonymous referees for helpful comments on an earlier draft. This study represents a contribution to the Ecosystems Programme of the British Antarctic Survey.
Funding statement. This work was supported by the UK Natural Environment Research Council (NER/S/A/2005/13648).
References
1. Berryman AA. 1999Principles of population dynamics and their application. Cheltenham, UK: Stanley Thornes Ltd.
2. Orians GH, Pearson NE. 1979 On the theory of central place foraging. InAnalysis of ecological systems(eds DJ Horn, GR Stairs, RG Mitchelle), pp. 155 –177. Columbus, OH: Ohio State University Press. 3. Matthiopoulos J. 2003 The use of space by animals as
a function of accessibility and preference.Ecol. Model. 159, 239–268. (doi:10.1016/S0304-3800(02)00293-4) 4. Laidre KL, Heide-Jorgensen MP, Nyeland J, Mosbech A, Boertmann D. 2008 Latitudinal gradients in sea ice and primary production determine Arctic seabird colony size in Greenland.Proc. R. Soc. B275, 2695 – 2702. (doi:10.1098/rspb.2008.0874) 5. Furness RW, Birkhead TR. 1984 Seabird colony
distributions suggest competition for food supplies during the breeding season.Nature311, 655 – 656. (doi:10.1038/311655a0)
6. Cairns DK. 1989 The regulation of seabird colony size: a hinterland model.Am. Nat.134, 141 – 146. (doi:10.1086/284970)
7. Petit S, Pors L. 1996 Survey of columnar cacti and carrying capacity for nectar feeding bats on Curacao. Conserv. Biol.10, 769 – 775. (doi:10.1046/j.1523-1739.1996.10030769.x)
8. Brown CR, Sas CM, Brown MB. 2002 Colony choice in cliff swallows: effects of heterogeneity in foraging habitat.Auk119, 446 – 460.
9. Ashmole NP. 1963 The regulation of numbers of tropical oceanic birds.Ibis103, 458 – 473. 10. Diamond AW. 1978 Feeding strategies and
population-size in tropical seabirds.Am. Nat.112, 215 – 223. (doi:10.1086/283261)
11. Lewis S, Sherratt TN, Hamer KC, Wanless S. 2001 Evidence of intra-specific competition for food in a pelagic seabird.Nature412, 816 – 819. (doi:10. 1038/35090566)
12. Croxall JP, Butchart SHM, Lascelles B, Stattersfield AJ, Sullivan BJ, Symes A, Taylor P. 2012 Seabird conservation status, threats and priority actions: a global assessment.Bird Conserv. Int.22, 1 – 34. (doi:10.1017/S0959270912000020)
13. Rolland V, Barbraud C, Weimerskirch H. 2008 Combined effects of fisheries and climate on a migratory long-lived marine predator.J. Appl. Ecol. 45, 4 – 13. (doi:10.1111/j.1365-2664.2007.01360.x)
14. Cury PMet al. 2011 Global seabird response to forage fish depletion: one-third for the birds. Science334, 1703 – 1706. (doi:10.1126/science. 1212928)
15. Forbes LS, Jajam M, Kaiser GW. 2000 Habitat constraints and spatial bias in seabird colony distributions.Ecography23, 575 – 578. (doi:10. 1034/j.1600-0587.2000.230508.x)
16. Duffy DC. 1983 The ecology of tick parasitism on densely nesting peruvian seabirds.Ecology64, 110 – 119. (doi:10.2307/1937334)
17. Weimerskirch H. 2004 Diseases threaten Southern Ocean albatrosses.Polar Biol.27, 374 – 379. (doi:10. 1007/s00300-004-0600-x)
18. Kooyman GL, Ainley DG, Ballard G, Ponganis PJ. 2007 Effects of giant icebergs on two emperor penguin colonies in the Ross Sea, Antarctica. Antarctic Sci.19, 31 – 38. (doi:10.1017/ S0954102007000065)
19. Weimerskirch H. 2002 Seabird demography and its relationship with the marine environment. In Biology of marine birds(eds EA Schreiber, J Burger), pp. 115 – 135. Boca Raton, FL: CRC Press. 20. Fauchald P, Erikstad KE, Skarsfjord H. 2000
Scale-dependent predator – prey interactions: the hierarchical spatial distribution of seabirds and prey. Ecology81, 773 – 783.
21. Wakefield ED, Phillips RA, Matthiopoulos J. 2009 Quantifying the habitat use and preference of pelagic seabirds using individual movement data: a review.Mar. Ecol. Prog. Ser.391, 165 – 182. (doi:10. 3354/meps08203)
22. Rosenzweig ML. 1981 A theory of habitat selection. Ecology62, 327 – 335. (doi:10.2307/1936707) 23. Wakefield EDet al. 2011 Accessibility, habitat
preference and conspecific competition limit the global distribution of breeding albatrosses.Ecol. Monogr.81, 141 – 167. (doi:10.1890/09-0763.1) 24. Catry P, Lemos RT, Brickle P, Phillips RA, Matias R,
Granadeiro JP. 2013 Predicting the distribution of a threatened albatross: the importance of competition, fisheries and annual variability.Prog. Oceanogr.110, 1 – 10. (doi:10.1016/j.pocean.2013.01.005) 25. Weimerskirch H. 2007 Are seabirds foraging for
unpredictable resources?Deep-Sea Res. II, Top. Stud. Oceanogr.54, 211 – 223. (doi:10.1016/j.dsr2.2006. 11.013)
26. Behrenfeld MJet al. 2006 Climate-driven trends in contemporary ocean productivity.Nature444, 752 – 755. (doi:10.1038/nature05317)
27. Jennings S, Melin F, Blanchard JL, Forster RM, Dulvy NK, Wilson RW. 2008 Global-scale predictions of community and ecosystem properties from simple ecological theory.Proc. R. Soc. B275, 1375 – 1383. (doi:10.1098/rspb.2008.0192)
28. Chassot E, Bonhommeau S, Dulvy NK, Melin F, Watson R, Gascuel D, Le Pape O. 2010 Global marine primary production constrains fisheries catches.Ecol. Lett.13, 495 – 505. (doi:10.1111/j. 1461-0248.2010.01443.x)
29. Rice J. 2001 Implications of variability on many time scales for scientific advice on sustainable management of living marine resources.Prog. Oceanogr.49, 189 – 209. (doi:10.1016/S0079-6611(01)00022-2)
30. Birt VL, Birt TP, Goulet D, Cairns DK, Montevecchi WA. 1987 Ashmole halo-direct evidence for prey depletion by a seabird.Mar. Ecol. Prog. Ser.40, 205 – 208. (doi:10.3354/meps040205)
31. Wakefield EDet al. 2013 Space partitioning without territoriality in gannets.Science341, 68 – 70. (doi:10.1126/science.1236077)
32. Pinaud D, Weimerskirch H. 2002 Ultimate and proximate factors affecting the breeding performance of a marine top-predator.Oikos 99, 141 – 150. (doi:10.1034/j.1600-0706.2002. 990114.x)
33. Wakefield ED, Phillips RA, Belchier M. 2012 Foraging black-browed albatrosses target waters overlaying moraine banks: a consequence of upward benthic-pelagic coupling?Antarctic Sci.24, 269 – 280. (doi:10.1017/S0954102012000132)
34. Longhurst AL. 1998Ecological geography of the sea, p. 398. San Diego, CA: Academic Press. 35. Hui C. 2006 Carrying capacity, population
equilibrium, and environment’s maximal load.Ecol. Model.192, 317 – 320. (doi:10.1016/j.ecolmodel. 2005.07.001)
36. Kauffman L, Rousseeuw PJ. 2005Finding groups in data: an introduction to cluster analysis, p. 342. Hoboken, NJ: John Wiley & Sons.
37. Maechler M, Rousseeuw P, Struyf A, Hubert M, Hornik K. 2012 cluster: cluster analysis basics and extensions. R package version 1.14.2.
rspb.r
oy
alsocietypublishing.org
Pr
oc.
R.
Soc.
B
281
:
20132883
38. Jovani R, Mavor R, Oro D. 2008 Hidden patterns of colony size variation in seabirds: a logarithmic point of view.Oikos117, 1774 – 1781. (doi:10.1111/j. 1600-0706.2008.17065.x)
39. Heiberger RM, Holland B. 2004Statistical analysis and data display: an intermediate course with examples in S-Plus, R, and SAS. New York, NY: Springer.
40. Cliff AD, Ord JK. 1981Spatial processes: models and applications, p. 260. London, UK: Pion.
41. Prince PA, Rothery P, Croxall JP, Wood AG. 1994 Population-dynamics of black-browed and gray-headed albatrossesDiomedea melanophrisandD. chrysostoma at Bird Island, South Georgia.Ibis136, 50–71. (doi:10.1111/j.1474-919X.1994.tb08131.x) 42. Poncet S, Robertson G, Phillips RA, Lawton K,
Phalan B, Trathan PN, Croxall JP. 2006 Status and distribution of wandering, black-browed and grey-headed albatrosses breeding at South Georgia. Polar Biol.29, 772 – 781. (doi:10.1007/s00300-006-0114-9)
43. Huin N, Reid T. 2006Census of the black-browed albatross population of the Falkland Islands 2000 and 2005, p. 37. Stanley, Falkland Islands: Falklands Conservation.
44. Tuck GN, Phillips RA, Small C, Thomson RB, Klaer NL, Taylor F, Wanless RM, Arrizabalaga H. 2011 An assessment of seabird-fishery interactions in the Atlantic Ocean.ICES J. Mar. Sci.68, 1628 – 1637. (doi:10.1093/icesjms/fsr118)
45. Phillips RA, Silk JRD, Croxall JP, Afanasyev V, Bennett VJ. 2005 Summer distribution and migration of nonbreeding albatrosses: individual consistencies and implications for conservation. Ecology86, 2386 – 2396. (doi:10.1890/04-1885) 46. Cherel Y, Klages NTW. 1998 A review of the food of
albatrosses. InAlbatross biology and conservation (eds G Robertson, R Gales), pp. 113 – 136. Chipping Norton, UK: Surrey Beatty & Sons.
47. Mann KH, Lazier JRN. 2006Dynamics of marine ecosystems, 3 edn., p. 496. Malden, MA: Blackwell Publishing.
48. Salamolard M, Weimerskirch H. 1993 Relationship between foraging effort and energy requirement throughout the breeding-season in the wandering albatross.Funct. Ecol.7, 643 – 652. (doi:10.2307/ 2390184)
49. Saunders RA, Brierley AS, Watkins JL, Reid K, Murphy EJ, Enderlein P, Bone DG. 2007 Intra-annual variability in the density of Antarctic krill (Euphausia
superba) at South Georgia, 2002 – 2005: within-year variation provides a new framework for interpreting previous ‘annual’ estimates of krill density.CCAMLR Sci.14, 27 – 41.
50. Croxall JP, Prince ED. 1980 Food, feeding ecology and ecological segregation of seabirds at South Georgia.Biol. J. Linn. Soc.14, 103 – 131. (doi:10. 1111/j.1095-8312.1980.tb00101.x)
51. Armstrong RA, McGehee R. 1980 Competitive exclusion.Am. Nat.115, 151 – 170. (doi:10.1086/ 283553)
52. Moore PJ, Burg TM, Taylor GA, Millar CD. 2001 Provenance and sex ratio of black-browed albatross, Thalassarche melanophrys, breeding on Campbell Island, New Zealand.Emu101, 329 – 334. (doi:10. 1071/MU00074)
53. Weimerskirch H, Louzao M, de Grissac S, Delord K. 2012 Changes in wind pattern alter albatross distribution and life-history traits.Science335, 211 – 214. (doi:10.1126/science.1210270) 54. Aarts G, MacKenzie M, McConnell B, Fedak M,
Matthiopoulos J. 2008 Estimating space-use and habitat preference from wildlife telemetry data. Ecography31, 140 – 160. (doi:10.1111/j.2007.0906-7590.05236.x)