Measuring the effect of the reflection of sound from the
lips in brass musical instruments
J. A. Kemp
aand R. A. Smith
ba
University of St Andrews, 65 North Street, KY16 9AJ St Andrews, Fife, UK
bSmith Watkins Trumpets, Cornborough, YO60 6RU Sheriff Hutton, Yorkshire, UK
The lips of the player are often assumed to perfectly reflect sounds that strike them. Experimental and theoretical calculations of input impedance demonstrate the pressure that would build up if a flat, perfectly reflecting volume velocity source were used to excite the air into vibration. In reality the lips should project slightly into the instru-ment mouthpiece and absorb a small amount of the energy that strikes them and this study will quantify this effect using wave separation/impedance apparatus. For closed lips it is expected that the strength of resonances will be reduced, but that the correction will be small. The condition for reflection from lips that are not fully closed will differ more significantly from perfect reflection and it is anticipated that this data will be useful for integration into physical models of brass instruments.
1
Introduction
The resonance frequencies of musical instruments are fre-quently characterised by the input impedance. This quantity is defined as being the ratio of the pressure and volume ve-locity when the mouthpiece is closed by a perfectly reflecting source. Input impedance may be measured most directly by the use of a capillary to provide a volume velocity as a source in a plate placed across the mouthpiece. The input impedance may also be calculated indirectly from a measurement of the reflectance (or input impulse response), which is the ratio of reflected to input amplitude for a perfectly absorbing source. Acoustic pulse reflectometry methods achieve this result us-ing apparatus where the input side of the instrument opens into a source tube containing one or more microphones.
Peaks of impedance are frequently used to characterise the frequencies that can be played and the lip reed described as outward striking or inward striking depending on whether the sounding pitch is slightly above or below the frequency of a peak in input impedance [1]. Physical models used to simulate the interaction of the lips with the air column reso-nances include the simple Helmholtz model [2, 3] and may be contrasted with the one mass model with two degrees of freedom set out by Adachi and Sato [4]. These models im-plicitly assume that the energy that impacts upon the lips is reflected perfectly and that the effect of lips bulging into the mouthpiece may be neglected (other than in generating an additional contribution to the volume velocity is the case of two dimension motion). The level of projection of the lips into the mouthpiece (which is itself a dynamic variable in re-ality) is crucial to the tuning of the peaks in input impedance and any deviation from unity of the reflection of sound from the lips may have an additional effect. The effect of the lips projecting slightly into the mouthpiece can be simulated by the inclusion of a volume placed inside the mouthpiece dur-ing an input impedance measurement and the BIAS input impedance/bore measurement and optimisation system [5, 6] includes an rubber pad for this purpose. When such a volume is included it raises the frequency of the input impedance peaks to more closely match the observed playing frequen-cies of the instrument, but the effect will vary from mouth-piece to mouthmouth-piece and player to player.
During playing, the pressure in the mouthpiece of a brass will feature large negative acoustic pressures when the lips are closed while positive pressures happen in phase with the lips being slightly opened and this should ideally be taken into account with a non-unity reflection of incident pressure for this condition. The resonances of the vocal tract have been shown to have a strong effect on clarinet sounding pitch [7] but tuning vocal tract resonances on the trumpet appears to be less noticeable in measurements of trumpet players as they use control of the lips to bend notes where appropri-ate (with although the effect of vocal tract resonances on
high notes has not yet been measured due to the difficulty of sounding such notes while the mouth pressure is being probed)[8, 9].
In this paper we first define the term ”soft source impedance” as the pressure that would be measured at a source of volume velocity waves which differs from a flat perfectly reflecting plate in that it may have a non-unity reflectance for incident energy. This means that it may absorb some of the energy which strikes it and may introduce a frequency dependent phase shift (or time delay) in reflections from it (due to the lips projecting into the mouthpiece for instance). We discuss the reflection coefficient implied by an idealised air-tissue in-terface at the lips. A recent wave separation technique [10] is then used to measure the reflectance of the lips of a human player (placed on a truncated mouthpiece section) with the lips in a state of readiness as though about to play a note on the trumpet. The extent to which the absorption is greater than the idealised assumption and the effect of the lips pro-jecting into the mouthpiece then may be observed. Plots of the soft source impedance are then presented for various dif-ferent embouchure conditions.
Due to the requirement to measure the pressure and vol-ume velocity accurately for waves striking the lips at all fre-quencies, it was a requirement that the lips of the player be held in a fixed position by the player with zero DC flow. In measuring the reflectance when the lips are placed on the end of a truncated trumpet mouthpiece we use low ampli-tude exponential sine sweep excitation so that linear propa-gation holds good (although it should be acknowledged that non-linear effects are significant in brass instruments under playing conditions). We will also ignore the effects of higher modes of propagation in the mouthpiece due to the low fre-quencies and low tube widths being investigated.
2
Soft Source Impedance
Consider a trumpet characterised by a complex frequency domain reflectance (for a perfectly absorbing source) ofR(ω). Now if the energy striking the input plane is partially re-flected with a reflectance ofV(ω), a forward going impulse produced at the beginning of the mouthpiece experiences mul-tiple reflections so that, in the frequency domain, the result-ing forward goresult-ing pressure at the mouthpiece is:
P+δ(ω) =1+V(ω)R(ω)+(V(ω)R(ω))2+. . .
= 1
1−V(ω)R(ω) (1) and the backward going wave at the mouthpiece will be:
P−δ(ω) =R(ω)+V(ω)(R(ω))2+(V(ω))2(R(ω))3+. . .
= R(ω)
The total pressure at the soft source due to a forward going impulsive input is then:
Pδ(ω)=P−δ(ω)+P+δ(ω)= 1+R(ω)
1−V(ω)R(ω). (3) Since a forward going waves have an acoustic impedance of
ρc/S, whereρis the density of air,cis the speed of sound and
S is the cross-sectional area of the input to the mouthpiece, we can deduce that the soft source impedance (the pressure built up when a forward going impulse of volume velocity is input at the soft source) will be:
Zδ(ω)= ρc
S
1+R(ω)
1−V(ω)R(ω). (4) This soft source impedance formula reduces to the standard formula for input impedance for a perfectly reflecting souce (V(ω)=1) as desired.
3
Reflection at an air-tissue boundary
The acoustic impedance of various biological materials in the ultrasound frequency range is shown the Chapter 21 of Springer Handbook of Acoustics [11]. The acoustic impedance of human biological soft tissues typically occupy the range between 1.4 and 1.7 MRayles with muscle having the highest impedance (approximately 1.7 MRayles) and fat having the lowest impedance (approximately 1.4 MRayles), with blood and water lying between these values. Air, on the other hand has an acoustic impedance of 415 Rayles. The reflection co-efficient, for normal incidence, for sound waves travelling in a material of impedanceZ1reflecting at the boundary with a
material of impedanceZ2can then be calculated using
R= Z2−Z1 Z2+Z1
(5)
giving a minimum ofRair−f at=0.999407 and a maximum of
Rair−muscle =0.999512 to 6 s.f. It should be noted that this
calculation is based on the acoustic impedance for ultrasonic frequencies at normal incidence.
A non-trivial angle of incidence for ultrasound results in a lower reflected amplitude and some energy conversion into surface waves within the flesh, leading to some energy being lost to capillary waves that decay, creating heat. Taking into account the effect of Snell’s law on the reflection coefficient [11] for incidence atπ/2 radians then ranges from 0.99917 to 0.99932 to 5 s.f. for sound waves incident on soft tissues from the air. These reflection coefficients clearly could be used as support for the hypothesis that the lips of a player ab-sorb a negligible amount of the energy in reflecting incoming pressure waves from the air. In reality the significant incident energy is not ultrasonic, the lips of the player are thin in re-lation to the wavelength of sound, and the lips are tight such that they have a resonant frequency close to the intended note fundamental frequency intended to be sounded. These facts imply that the idealised view of the reflection coefficient is worthy of investigation.
4
Wave separation
Wave separation or impedance measurement apparatus may be used to measure the frequency dependent reflection
of sound from objects [12, 10, 13, 14, 15]. We set out the calibration procedure here before going on to describe results for the reflection from the lips.
Wave separation in a cylindrical pipe requires the transfer between pairs of microphones to be charactered by transfer functions which may be defined ashabandhbawere:
p+b =p+a ⊗hab, p−a =p−b ⊗hba (6)
with p+b being the forward going pressure wave at micro-phoneb and p−
a being the forward going pressure wave at
microphonea etc. and⊗denoting convolution in the time domain (or multiplication in the frequency domain).
4.1
Inter-microphone transfer function
mea-surement
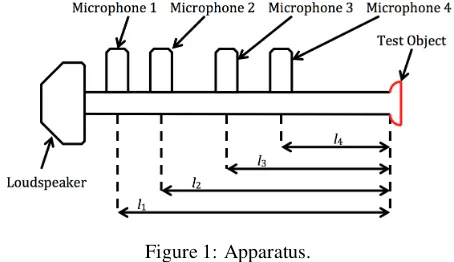
The apparatus used for experimental work is shown in figure 1. Knowledge of the precise inter-microphone dis-tances is not required due to the calibration procedure, but werel3−l4 ≈ 3 cm,l2 −l4 ≈13 cm andl1−l4 ≈ 25 cm
(all±0.5 cm). Transfer functions between two microphones could be measured using an infinite cylindrical continuation of the source tube as the ”test object”. In practice the cylin-drical continuation or calibration tube need not be infinite as demonstrated in [10]. For each pair of microphones, we denote the signal measured at the left hand microphone as
Pa(ω) and the signal measured at the right hand microphone
asPb(ω) (in the frequency domain). Frequency domain
di-vision of the two microphone signals produces azdomain signal:
Pb(z)
Pa(z)
= Hab(z)+
Hab(z).
z−MbR
b(z)−z−MaRa(z)
×
1−z−MaR
a(z)+z−2MaR2a(z)−. . .
, (7)
wherez−MaR
a(z) is a multiple reflection sequence that begins
with a reflection from the end of the cylindrical pipe to the right of microphoneaandz−MbR
b(z) is a multiple reflection
sequence that begins with the reflection from the end of the cylindrical pipe to the right of microphoneb. The pure delays
Ma =2laFs/candMb =2lbFs/care the number of samples
before these sequences start given that the cylindrical pipe carries on for a distance ofla to the right of microphonea,
and a distance oflbto the right of microphoneb, andcis the
[image:3.595.318.545.621.752.2]speed of sound andFsis the sample rate.
Figure 1: Apparatus.
sinceMb < Mafollows by definition (N.B. the direction of
the inequality in [10] is wrong). The resulting time domain signal is approximately impulsive when smooth bandwidth limiting is applied [10], and hab may be obtained by time
domain windowing. Differences in the microphone channel responses mean that the forward and backward going transfer functions,habandhbaare measured separately with the
loud-speaker and cylindrical continuation situated at either end of the source tube. After the transfer functions have been mea-sured, impedance measurement can be performed using the time domain wave separation algorithm [10] or in the fre-quency domain [14].
4.2
Reflectance measurement
Using the frequency domain version of the (time domain windowed) transfer functions (Hab(ω) andHba(ω)), for
trans-fer between microphones a and b and vice versa, the re-flectance, as measured at microphonebcan be calculated us-ing [10, 14]:
Rb(ω)=
Hab(ω).y(ω)−1
Hab(ω).Hba(ω)−Hab(ω).y(ω)
(8)
wherey(ω)=Pa(ω)/Pb(ω).
As with all such two microphone measurements, micro-phones separated by a distance ofLcause measurement sin-gularities at the frequencies f =nc/(2L) for integern. The approximately impulsive time domain transfer functions have approximately linear phase in the frequency domain giving values of approximately 0 orπat the singular frequencies. Multiple microphone measurements may thus be obtained by selecting the microphone pair, for each frequency of interest, that is closest to±π/2, so minimises the function:
θab(ω)=
|∠Hab(ω)| − π 2 . (9)
where∠is the phase angle operator.
The reflectance calculated using equation 8 is measured at microphonebrather than at the end of the source tube. In order to measure the reflectance at the end of the source tube we may do two measurements of the reflectance, one with the source tube closed at the end with a flat metal cap (to provide perfect reflection) and one with the object under test on the end giving the reflectance at the source tube end:
Rse(ω)=
Rob jb (ω)
Rcapb (ω) (10)
4.3
Admittance and projection
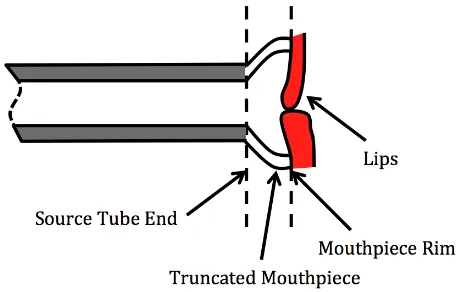
The source tube used in the experiments has an inside diameter of 9.8 mm, making it much narrower than the rim of standard trumpet mouthpiece (inside diameter of approx-imately 16.2 mm). For this reason a trumpet mouthpiece (Kelly model 7C) was cut in such a way as to smoothly join the rim side of the mouthpiece to the source tube. A schematic of this arrangement is shown in figure 2.
[image:4.595.317.547.49.195.2]In order to measure the reflectance at the lips, it is nec-essary to project a measured acoustic variable, taking into account the mouthpiece shape, to the rim of the mouthpiece. The known radiation impedance is projected backward down a piecewise cylindrical approximation of the bore shape to
Figure 2: Schematic of trumpet mouthpiece truncated and smoothly joined on to the end of the source tube.
the input (to calculate input impedance) in the standard tech-nique [16]. For this study the direction of the projection is re-versed: the measured impedance may be projected forwards to the end of the bore shape. The impedance at plane at plane 1 (labelledZ(1)) calculated from the impedance a distanced
to the left at plane 0 (labelledZ(0)) using the equation:
Z(1)= cos(kd)Z
(0)−jsin(kd)Z c
cos(kd)−jsin(kd)Z−1 c Z(0)
, (11)
whereZc=ρc/S is the characteristic impedance withS
be-ing the cross-sectional area andkis the lossy (i.e. complex) wavenumber. Since the impedance of a perfectly reflecting surface is infinity it is sensible, numerically, to use admit-tance defined asY =1/Z(so will have values close to zero). Converting the projection to be in terms of admittance gives:
Y(1)= cos(kd)Y
(0)−jsin(kd)Z−1 c
cos(kd)−jsin(kd)ZcY(0)
. (12)
Admittance (as with impedance) is unchanged by projection across a change in cross-section. The admittance at the rim of the mouthpiece is then obtained by using equation 12 with the output fed into the input multiple times withZcchanging
to reflect the changing cross-section. In order to begin this process, the admittance at the source tube end (and therefore the beginning of the mouthpiece section) is:
Yse(ω)=
S
ρc
1−Rse(ω)
1+Rse(ω)
(13)
4.4
Experimental procedure
The time domain windowed inter-microphone transfer func-tions are measured as set out in section 4.1. Measurements of the reflectance are made using equation 8 (and the results for multiple microphones combined by selecting microphone pairs for each frequency bin to minimise equation 9) for both the object under test (eg. mouthpiece section with the human player’s lips on the end) and the metal cap. The reflectance at the source tube end for the object under test is then ob-tained using equation 10. The admittance at the source tube end is then obtained using formula 13 and this admittance is then projected down the measured mouthpiece section shape using equation 12 repeatedly to obtain the admittance at the lips, which we labelYlips. The reflectance of the lips, which
we define asRlips(ω) is then obtained using the formula:
Rlips(ω)=
1−Ylips(ω)Zc
1+Ylips(ω)Zc
A measurement of Rlips will then allow the complex,
fre-quency dependent reflection coefficient of the lips to be plot-ted and also may be used to calculate the soft source impedance of a trumpet (characterised by the instrument’s measured or theoretically calculated reflectance R(ω)) using equation 4 with the substitutionV(ω)=Rlips(ω).
5
Results
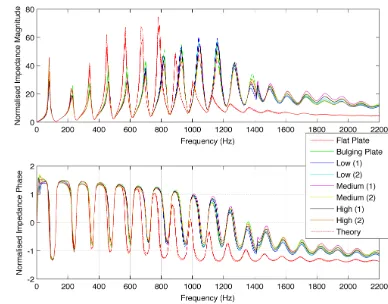
Experiments were performed with the player’s lips tight across the mouthpiece section. No DC flow was occurring between the mouth cavity, mouthpiece section or outside air. The results seen in figure 3 show the absolute value and phase of the reflectance at the end of the mouthpiece section. An initial measurements was performed with the mouthpiece sec-tion terminated in an aluminium plate and the results show a good level of accuracy in measuring a reflection magnitude of one and a phase of zero. A further test was made with the same aluminium plate modified with the addition of a 0.8±0.1 cm3 of poster adhesive putty in order to simulate
the effect of lips projecting into the mouthpiece. The results, labelled ”bulging plate” in figure 3 show a reflectance mag-nitude very close to one with a phase angle which is close to being directly proportional to frequency, as is the case for a pure negative time delay, indicating that the projection to the end of the mouthpiece section overshoots the apparent closed end position due to the volume of air replaced with poster adhesive putty.
The measurements of the trumpet player’s lips were made with the player’s lips touching while adjusting the back pres-sure in their mouth. Meapres-surement of the back prespres-sure was provided using a water Manometer (Monument 259i Gas Test Gauge 90 mb 900 mm) connected to a football pump adap-tor which was placed in the corner of the player’s mouth. There is a discontinuity at around 1400 Hz in these measure-ments probably due to this frequency being relatively close to singularities for all microphone combinations and the cali-bration degrading due to a slight change in temperature. The results in figure 3 show that the lips have a reflection mag-nitude of less than one, absorbing up to 6% of the incident amplitude at low frequencies, and the phase angle is consis-tent with the lips projecting into the mouthpiece volume by around 0.8 cm3. Two different measurements were taken for
different amounts of back pressure in the mouth, and these pressures are labelled as Low (meaning 30 mb or 3 kPa), Medium (meaning 60 mb or 6 kPa), and High (meaning 90 mb or 9 kPa). There is a loose correlation between increasing back pressure in the mouth and increasing frequency for the notch in the reflectance situated between around 100 Hz and 300 Hz and the phase angle of the reflected sound is consis-tent with the lips projecting into the mouthpiece to a similar extent for different back pressures with a very slight tendency for the lips to project slightly more into the mouthpiece for higher back pressures.
In order to estimate the effect of this non-unity reflectance of the lips on playing properties, the soft source impedance of a trumpet (characterised by the instrument’s reflectance
R(ω) calculated using multi-modal decomposition [16]) was calculated. The substitutionV(ω) = Rlips(ω) was used in
equation 4.
The results are shown in figure 4 and it is clear that the resonant peaks are higher in frequency and the overall
en-Figure 3: Reflectances for varying back pressure in the mouth.
[image:5.595.330.539.49.203.2]velope of the soft source impedance plot is also shifted to a higher frequency range and this is mainly due to the pro-jection of the lips into the mouthpiece. Differences between the bulging plate and the closed lips measurements include a slight reduction in resonance in the lower frequency range for the lips (as expected given the reflectance of the input plane). The peaks in impedance correspond to points where the impedance phase angle crosses from positive to negative with increasing frequency and there are more of these clear resonances (i.e. at higher mode numbers) when the effect of lip projection is taken into account. Variability of this ef-fect with different performers is worth investigating, and a consequence of this, known to trumpeters, is that sometimes performers with lips of different physical dimensions will re-quire different sizes of mouthpiece in order to play in tune or optimise playing in a particular pitch range.
Figure 4: Soft Source Impedances for varying back pressure in the mouth.
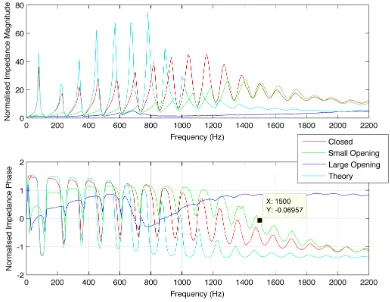
[image:5.595.332.526.473.625.2]was from the area of opening between the lips which was not measurable in the current experimental setup. Two typical results are presented here. The result marked ”Small Open-ing” was assessed as such from the fact that at low frequen-cies the reflection coefficient approximates -1 (magnitude 1 with phase angleπ) while at high frequencies the reflection coefficient approximates 1. The ”Large Opening” lip con-dition was labelled as such because there was evidence of a significant effect due to a resonance in the vocal tract ab-sorbing energy just above 800 Hz and this produces very poor resonances in the soft source impedance. It is notable that the ”Small Opening” lip condition actually makes high notes resonate slightly more strongly. In particular, peaks in impedance occur when the phase of the impedance crosses from positive to negative, and this happens at higher frequen-cies for the soft source impedance for the ”Small Opening” lip condition (up to the 13th resonance marked at roughly the frequency marked with a black square in the plot, instead of the 11th resonance for the ”Closed” lip condition). The implications for playability are not straightforward as the lip opening will vary dynamically but it is clear that including such effects would be useful in physical modelling synthesis in order to illuminate this area further.
Figure 5: Reflectances for varying lip opening.
Figure 6: Soft Source Impedances for varying lip opening.
6
Conclusion
The wave separation apparatus has been used to show that the reflectance from the lips is not unity at frequencies in the
playing range and an indirect measurement made of the vol-ume displaced by a trumpet player’s embouchure has been made. Investigating the relationship between the deviation of the reflectance from unity and lip resonant frequencies would be advisable, as would investigating the embouchure of more players. In addition, repeating the experiment on a flat plate with a hole drilled, and performing accompanying theoreti-cal computations, would allow the likely effective open area for different measurements of the lips in a partially open con-dition, and the degree to which lip absorption may be safely ignored, to be assessed. Physical modelling can be used to assess the impact on playability. The degree to which these effects change the tuning of resonances may also have impli-cations on the frequency ranges in which the lips may be de-scribed as obeying outward and sideways striking behaviour.
Acknowledgments
Thanks to trumpet player Bede Williams for being the subject of experiments and Murray Campbell and Wilfried Kausel for helpful discussions.
References
[1] D. Ayers Basic tests for models of the lip reed. In
Proceedings of ISMA 2001 (Fondazione Scuola Di San Giorgio, Venice, 2001.
[2] C. Vergez and X. Rodet. Trumpet and trumpet player: Model and simulation in a musical context. In
ICMC’01, La Habana, Cuba, 2001.
[3] T. Helie, C. Vergez, J. Levine, and X. Rodet. Inversion of a physical model of a trumpet. InDecision and Con-trol, 1999. Proceedings of the 38th IEEE Conference on, volume 3, pages 2593–2598, 1999.
[4] S. Adachi, M. Sato Trumpet sound simulation using a two-dimensional lip vibration model, J. Acoust. Soc. Am., 99, 1200–1209, 1996.
[5] G. Widholm Brass Wind Instrument Quality Measured and Evaluated by a new Computer System. Inof the 15th Int. Congress on Acoustics, Trondheim, Vol. III, 517–520, 1995.
[6] W. Kausel Brass Wind Instrument Quality Measured and Evaluated by a new Computer System.IEEE Trans. Instrum. Meas., 53, 1097–1105, 2004.
[7] J. M. Chen, J. Smith, and J. Wolfe Pitch bending and glissandi on the clarinet: Roles of the vocal tract and partial tone hole closure. J. Acoust. Soc. Am., 126(3), 1511–1520, 2009.
[8] T. Kaburagi, N. Yamada, T. Fukui, and E. Minamiya A methodological and preliminary study on the acoustic effect of a trumpet player’s vocal tract, J. Acoust. Soc. Am., 130(1), 536–545, 2011.
[image:6.595.68.263.544.695.2][10] J. Kemp, M. van Walstijn, M. Campbell, J. Chick, and R. Smith. Time domain wave separation using multiple microphones. J. Acoust. Soc. Am., 128(1), 195–205, 2010.
[11] T. Rossing (Ed.). Springer Handbook of Acoustics. Springer, 2007.
[12] J. P. Dalmont. Acoustic impedance measurement, part i: A review Journal of Sound and Vibration243, 427– 439, 2001.
[13] P. Dickens, J. Smith, and J. Wolfe. Improved preci-sion in measurements of acoustic impedance spectra using resonance-free calibration loads and controlled error distribution, J. Acoust. Soc. Am., 121(3), 1471– 1481, 2007.
[14] G. de Sanctis and M. van Walstijn. A frequency domain adaptive algorithm for wave separation. In 12th Int. Conference on Digital Audio Effects (DAFx-09), Como, Italy, 2009.
[15] J. Kemp, S. Logie, J. Chick, R. Smith, M. Campbell. Analysis of transients for brass instruments under play-ing conditions usplay-ing multiple microphones. In Proceed-ings of the 10th French Congress on Acoustics, Lyon , France, 2010.