ISSN Online: 2161-1238 ISSN Print: 2161-122X
DOI: 10.4236/jst.2019.94006 Nov. 26, 2019 54 Journal of Sensor Technology
Attention Detection System Based on the
Variability of Heart Rate
Ubaldo Enrique Rodríguez de Avila
1, Isaac Campos Braga
2,
Fabíola Rodrigues de França Campos
3, Adriano Chiombacanga Nafital
41Department of Psychology of the Universidad del Magdalena, Santa Marta, Colombia 2Biomedicine Graduation of Universidade Federal do Rio Grande do Norte, Natal, Brasil 3Department of Physiotherapy of the Universidade Federal do Rio Grande do Norte, Natal, Brasil 4Department of Biology of the Universidade Pungi, Chimoio, Mozambique
Abstract
Attention is a cognitive and psychobiological variable that lacks objective measures in natural contexts of formal learning. However, it can be objec-tively measured from the heart autonomic activity. In the present study, the validity and reliability of a system for recording heart rate variability are demonstrated. Twelve prototypes were created and paired with standard electrocardiogram. Long segments with cardiac pulse recordings were used within ten minutes. A highly significant correlation index (p < 0.01) and a significantly high Cronbach’s alpha were obtained. In the variance analysis, all data analyzed presented a value of p < 0.05. It is concluded that there is no significant variation between paired systems; therefore, the attention detec-tion system based on heart rate variability is valid and reliable.
Keywords
Arduino, RR Interval, Heart Rate Variability, Attention
1. Introduction
The Porges Polyvagal Perspective relates the autonomic function with the beha-vior and defines the Autonomic Nervous System (ANS) as “system” [1] [2] [3]
and in that line, Thayer, Hansen, Saus-Rose and Johnsen [4] proposed the Neu-rovisceral Integration Model, which exposes the existence of a network of neural structures related to the regulation of physiological processes, cognitive processes and emotional processes, which they called Central Autonomic
Net-How to cite this paper: de Avila, U.E.R., Braga, I.C., de França Campos, F.R. and Nafital, A.C. (2019) Attention Detection System Based on the Variability of Heart Rate. Journal of Sensor Technology, 9, 54-70.
https://doi.org/10.4236/jst.2019.94006
Received: October 23, 2019 Accepted: November 23, 2019 Published: November 26, 2019 Copyright © 2019 by author(s) and Scientific Research Publishing Inc. This work is licensed under the Creative Commons Attribution International License (CC BY 4.0).
http://creativecommons.org/licenses/by/4.0/
DOI: 10.4236/jst.2019.94006 55 Journal of Sensor Technology
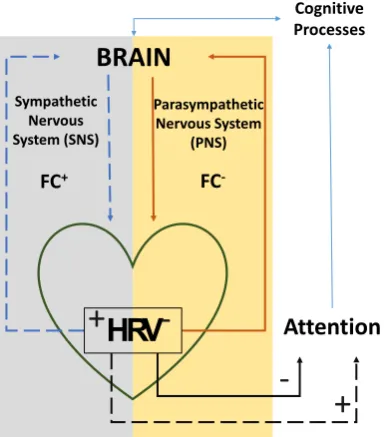
work (CAN), which is part of an internal regulation system that innervates the heart through the pathways of the Sympathetic Nervous System (SNS) and Pa-rasympathetic Nervous System (PNS) [5]. In summary, the regulatory activity of CAN is related to Heart Rate Variability (HRV), which is the result of interac-tions between the SNS and the PNS [6], with an impact on cognitive and emo-tional processes [5] [7].
Thus, the activation of the SNS produces an increase in the Heart Rate (HR) by slow impulses of low frequency, due to physical and mental stress. In con-trast, PNS lowers HR by high-frequency vagal electrical impulses and manages changes in the HR due to signals from arterial baroreceptors and the respiratory system [5]. This is why the HRV study allows us to observe the fluctuating pre-dominance of the SNS and PNS, which makes it possible to measure the Atten-tion objectively. In this way, the associaAtten-tion of the communicaAtten-tion pathways between the heart and the brain is responsible for the generation of Heart Rate Variability (HRV).
Therefore, the fundamental premise of the present study is deduced, which consists in the idea that the care has a physiological substrate, regulated by the activity of the ANS (SNS and PNS) to the extent that the SNS has as a function the acceleration of the responses of the organism and the preparation for action (stress) and therefore increases the levels of cognitive attention, and thus, the HR increases [8] [9] [10]. On the other hand, the predominance of PNS causes a resting body state in the body, reducing the level of stress [6]. Therefore, atten-tion, in addition to being a central and fundamental aspect of cognition [11], is related to the models of neuronal integration and learning regulated by attention
[12] [13]. There is already evidence that the ANS plays a fundamental role in implicit learning [14], in cognition, emotion and mainly in attention [15].
Also, the electrophysiology in the study of the HRV, has been experiencing a growing and rapid expansion with increasing complexity and the number of techniques performed [16] that together with the scientific evidence set forth above, it is found that HRV is emerging as a simple non-invasive measure, or quantitative marker, of autonomic activity [16], which can also be used as an objective measure for the study of autonomic processes related to cognitive processes [17] [18] [19] [20] (Luque-Casado, Perales, Cárdenas & Sanabria, 2016) (Figure 1).
Flexible electronic devices are emerging as powerful tools to measure biologi-cal signals, such as HR or a person’s blood pressure [21]. The basic research based on objective psychobiological records provides foundations for future flexible technologies [22], but these advances can only be transformed into con-crete products if technological innovation advances from the laboratory, even more so when they are systems designed to be applied in life research and peda-gogical or formative activity.
DOI: 10.4236/jst.2019.94006 56 Journal of Sensor Technology
Figure 1. Simplified theoretical model scheme.
Source: The authors.
expensive programmable devices, with adaptive threshold calculation, filter banks, transformations and mathematical operations, among other alternatives of mea-surement [23] [24]. They also use programmable digital devices, advanced ma-chines type RISC (Reduced Instruction Set Computer), which is a 32-bit RISC ar-chitecture developed by ARM Holding, becoming a dominant alternative in the mobile electronics market [25]. We can also mention the Olimexino STM32, which is an open source development card, Arduino type, with STM32F103RBT6 microcontroller, with DC-DC power supply from 9 to 30 V, low consumption voltage regulators and with Micro SD-card system for data storage [25]. There is also a history of reliable use of systems such as the Shiel EKG-EMG, Arduino DUE, or the Arduino Ethernet Shield, etc. [25].
In a study developed by Weippert et al.[26] three mobile devices were com-pared to measure the RR intervals and HR. The devices were the Polar S810i, Suunto t6 and an ambulatory EKG system. The participants were subjected to simultaneous recordings of the RR interval with the three instruments during rest in the supine and sitting position, moderate dynamics and moderate to vi-gorous static exercise of the upper and lower limb. For each subject, 17 series of RR intervals with 3-minute recordings were extracted and then analyzed in the frequency domain using the Fast Fourier Transform (FFT). To compare the re-liability of the data (measurement matching criteria), the researchers determined the intraclass correlation coefficients (ICC) and the Bland-Altman agreement limits method (LoA). The results showed agreement between all the devices.
Also, Urbano [25] carried out a study whose objective was to design an algo-rithm for the quantification of the average heart rate, from the detection of the R wave, oriented to its implementation in programmable digital devices of the
Attention
BRAIN
Cognitive Processes
Sympathetic Nervous System (SNS)
Parasympathetic Nervous System
(PNS)
HRV
+
-+
-DOI: 10.4236/jst.2019.94006 57 Journal of Sensor Technology
ARM type; where one of the specific objectives was to identify the possibility of implementing an integration strategy with data storage devices in removable memory and communication with the personal computer, in order to facilitate the exposure of the data quickly.
As far as we know, there are no technological development studies for the registration of the HRV with a simple device, easy to program, agile to assemble and robust enough to be used in scientific research and in pedagogical activity, low cost and free use.
Therefore, the objective of this study was to design and validate an accessible, low-cost, flexible and easy-to-use tool for researchers and students, with the same performance of sophisticated controls and more complex tools, which can be used to the development of the investigation of records of the HRV, or to be connected to a central computer based on the online pedagogical activity.
2. Method
2.1. Attention Detection System Based on the Variability of Heart
Rate (ADS-VHR1)
The study is design and validation of ADS-VHR1. The measurement of observa-tion is the registered cardiac pulses. With twelve (12) systems paired with a Standard Electrocardiogram (EKG-P). The sample was defined a posteriori, that is: It was identified after the cardiac pulse records. The participating subjects were: Three volunteers, men, who enjoyed good health, and before or during the test, did not take any substance that altered their physiology.
The ADS-VHR1 is based on Arduino Technology. This technology is a plat-form for free hardware electronic prototypes and a single board, projected with a microcontroller, by integrated input and output gate and standard programming language [27] [28]. It is composed of an Arduino UNO microprocessor; a pulse sensor; an SD Card Module; a Protoboard; a Psh-button for event marking. The components of the System are basically five, in addition to the wiring and sup-port. They described below:
1) Arduino: It is an open-source electronic prototype platform based on flexi-ble hardware and software. The board’s microcontroller is programmed using the Arduino Programming Language (based on Wiring) and the Arduino De-velopment Environment (based on Processing). It can also be defined as a tiny computer that can be programmed to process inputs and outputs between the device and the external components that connect to it [28].
The ADS-VHR1 prototype was designed with software running on a common computer for later use, powered by a 9-volt battery (see code in Appendix). Sys-tem components were purchased from authorized suppliers, and then assembled by hand. The reference hardware designs are available under an open-source li-cense, so it is free to be adapted to the different needs of the user [27] [28].
DOI: 10.4236/jst.2019.94006 58 Journal of Sensor Technology
safe to alter the position of a certain component, including its replacement.
3) Micro SD Memory Card Module: It is a device that uses the recorded
in-formation, in text format, on a standard micro SD card as storage. It allows to store the information during a variable registration time and then be processed in the computer.
4) Heart Rate Sensor: It is an amplified optical sensor that makes the reading of the heartbeat. The Arduino microcontroller processes it, by means of the code that converts the registered signal into numbers, which correspond to the dis-tance in milliseconds of each heart pulse or RR interval, and then that data is sent through cables connected to the Protoboard, which in turn, it sends the in-formation to the Micro SD Card Module and stored there, to be later down-loaded to a conventional PC and the data processed.
5) 9 Volt Battery (9 V): It is the power source or power supply of the ADS-VHR1, when it is not connected to the computer.
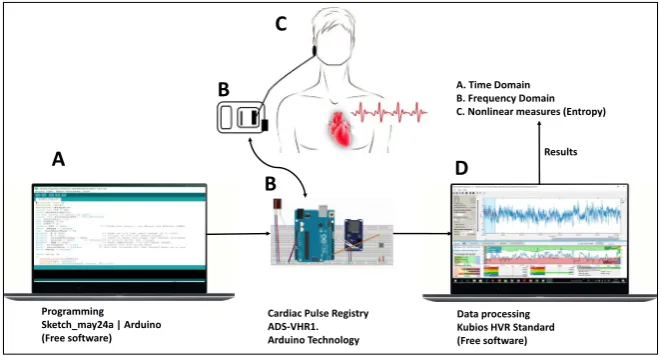
The ADS-VHR1 is programmed with free software that does not need to be on-line, is used in a portable way and the information is removable to be processed in a conventional computer, using other free software that also does not need to be connected to the web (Figure 2).
2.2. Design of the ADS-VHR1
[image:5.595.208.539.478.656.2]Initially, three ADS-VHR1 prototypes were built, which were subjected to pre-pilot tests, which allowed to adjust the Arduino’s processing code, Heart Rate sensors, the power supply system and the storage capacity. After this phase, the rest of the prototypes were assembled, which were also subjected to a pre-vious Pilot to verify that the components were adequate and suitable for defini-tive use.
Figure 2. Schematic representation of the use of ADS-VHR1. A: Conventional computer with
specialized software, free to use, with ADS-VHR1 programming algorithm. B: ADS-VHR1 as-sembled and programmed for recording cardiac activity. C: Subject with the ADS-VHR1 heart rate sensor in the ear. D: Processing of the registered data extracted from the ADS-VHR1, using specialized software for free use. Source: The authors.
A. Time Domain B. Frequency Domain C. Nonlinear measures (Entropy)
Programming Sketch_may24a | Arduino (Free software)
Cardiac Pulse Registry ADS-VHR1. Arduino Technology
Data processing Kubios HVR Standard (Free software)
Results
C
A
B
DOI: 10.4236/jst.2019.94006 59 Journal of Sensor Technology
After verifying that the hardware and software components were adequate, the test for the final validation was carried out. Twelve (12) paired records were made (corresponding to one for each ADS-VHR1 system). The tests were done with subjects in a sitting position, at rest.
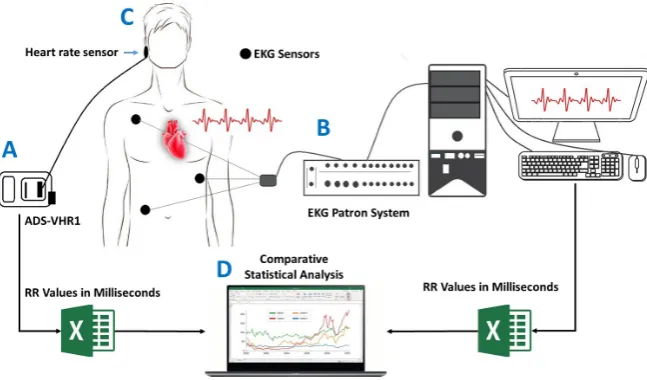
The EKG-P used was the LabChart, which is software supplied by PowerLab, which is part of a group of systems for research. LabChart software transforms the computer into a digital recorder and oscilloscope that records and displays EKG data in real time. The benefits it presents are easy acquisition, graphic presentation and powerful analysis functions. The values of the RR intervals recorded and processed were extracted from LabChart software; they were stored on the local PC using the interfaces and software supplied by the manu-facturer. The records of the values of the RR intervals were then imported into an Excel 2007 version.
On the other hand, the cardiac pulse registers recorded by the ADS-VHR1, were stored in the SD memory card of this system, were exported for the Excel 2007 version on a local computer for later analysis.
In the validation analysis, the long segments of the recordings of the cardiac pulse values (RR intervals) in ten (10) minute time were used, also extracting for each system a random sample of the number of RR Intervals to be able to com-pare the system data objectively. Twelve (12) paired records were made, corres-ponding to twelve (12) ADS-VHR1 (Figure 3).
2.3. Information Processing
[image:6.595.211.535.453.643.2]The data is described by descriptive statistics (central tendency, dispersion and
Figure 3. Validation of ADS-VHR1 by paired systems method. A: The ADS-VHR1
DOI: 10.4236/jst.2019.94006 60 Journal of Sensor Technology
distribution). Data were explored to verify Normality using the Kolmogo-rov-Smirnov tests. The validity of ADS-VHR1 was explored by calculating the correlation between paired systems, intra-class correlation (individual and aver-age) and Cronbrach’s Alpha. Then, in a confirmatory manner, a Variance Anal-ysis (ANOVA) is performed between the paired systems. And it also shows graphically the correlation of the systems by means of scatter plots for each paired system.
The following computer packages were used:
• Sketch_may24a|Arduino1.8.9 (for Windows): Used for mounting the
ADS-VHR1 code (Appendix).
• IBM Statistics SPSS 20. Computer statistical program widely used in the
so-cial, health and economic sciences.
• Microsoft Excel for Windows. Statistical support program and establishment
of databases.
3. Results
Table 1 presents the descriptive statistics and the standard deviation of the data obtained from the paired EKG-P and ADS-VHR1 Systems.
The criteria to determine Normality were the following: p Value > 0.05, accept Ho = Data have normal distribution
p Value < 0.05, accept H1 = Data does NOT have normal distribution
The data recorded by the standard EKG (EKG-P) and the ADS-VHR11-10 had a NO Normal distribution. While the data recorded for the EKG-P and ADS-VHR111-12 followed a Normal distribution (Table 1).
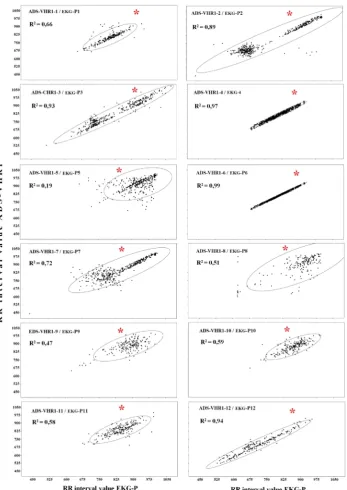
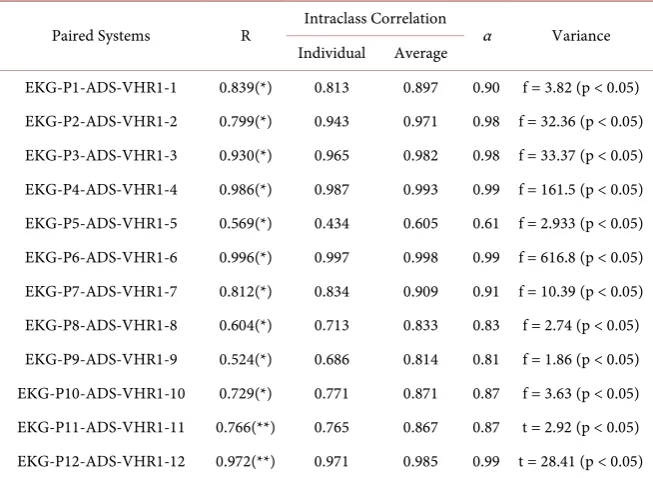
In the cross-correlation (bivariate), it was verified that there is a highly signif-icant correlation index (p < 0.01) (Table 2). In addition, the correlation was plotted using a scatter plot to observe the correspondence between the systems, calculating the estimated vector distance-R2 (Figure 4).
As an exploratory analysis, cross-correlation (paired), intraclass correlation was calculated and Cronbach’s Alpha (α) was verified; an α = 0.61 was found for ADS-VHR1-5, whose α is considered weak (Table 2), which means low reliabil-ity (61%).
Subsequently, a confirmatory analysis was carried out, beyond the data offered by the Cronbach Alpha, by means of an Analysis of the Variance for all the data, resulting in the validity of all the systems, including the ADS-VHR1-5. The hy-potheses were established as follows:
Ho = There is significant VARIANCE between the Paired Systems. H1 = There is no significant VARIANCE between the Paired Systems. If P Value < α, Ho is rejected (H1 is accepted).
If P Value > α, H1 is rejected (Ho is accepted).
The value of α = 0.05 (5% error and 95% confidence) was determined.
DOI: 10.4236/jst.2019.94006 61 Journal of Sensor Technology
These results suggest, on the one hand, a very good agreement between ADS-VHR1 and EKG-P. Therefore, it can be affirmed that there are no relevant biases for the measurements of the RR intervals by the ADS-VHR1.
[image:8.595.190.538.187.678.2]However, referring to the reliability data offered by intraclass correlations and Cronbach’s Alpha value, we notice a 38% difference between extreme values of Cronbach’s Alpha (see Table 2), which somehow indicates that the ADS-VHR1 has a certain variability that the researcher must take into account when using.
Figure 4. Correlation graph between paired systems. The ellipse shows the minimum
DOI: 10.4236/jst.2019.94006 62 Journal of Sensor Technology
4. Conclusions
[image:9.595.212.538.244.689.2]The programmable digital device based on the Arduino platform, has sufficient reliability, as found in previous research [25], however it is necessary to take into account that this variability found between the various measures performed with the ADS-VHR1 and the EKG-P, it can be due to a possible instability in its components, for example in cardiac pulse sensors, in the storage system in micro SD cards or, mainly, in the feeding system by means of 9 v batteries, since it is necessary to have noted that the EKG-P system works with electric current and therefore provides greater stability in its operation.
Table 1. Descriptive statistics and normality test for data from ADS-VHR1 and EKG-P.
Systems Descriptions Normality Test N Minimum Maximum M DS p value EKG-P1 260 610 952 777.6 64.09 * ADS-VHR1-1 260 605 937 775.5 73.61 * EKG-P2 437 441 1008 774 133.78 * ADS-VHR1-2 437 445 1018 778.8 124.22 * EKG-P3 423 441 1075 812.5 111.96 * ADS-VHR1-3 423 445 1106 816.6 110.48 * EKG-P4 767 685 926 808.3 51.77 * ADS-VHR1-4 767 672 940 810.3 52.86 * EKG-P5 371 665 1013 927.5 61.88 * ADS-VHR1-5 371 669 1015 917.4 62.51 * EKG-P6 767 685 926 808.3 51.77 * ADS-VHR1-6 767 680 932 809.3 52.14 * EKG-P7 414 441 1014 841.4 93.86 * ADS-VHR1-7 414 445 1015 852 86.03 * EKG-P8 184 621 995 892 92.61 * ADS-VHR1-8 184 600 1000 887.7 94.98 * EKG-P9 186 628 1003 882.2 63.09 * ADS-VHR1-9 186 650 1001 881.7 57.99 * EKG-P10 207 677 990 869.6 50.31 * ADS-VHR1-10 207 674 985 873.6 49.37 * EKG-P11 213 674 992 842.6 55.36 0.20** ADS-VHR1-11 213 693 999 838.3 52.32 0.08** EKG-P12 229 527 952 711.7 95.18 0.92** ADS-VHR1-12 229 526 945 703.5 92.02 0.35**
DOI: 10.4236/jst.2019.94006 63 Journal of Sensor Technology
Table 2. Correlation and analysis of the variance in paired systems data.
Paired Systems R Intraclass Correlation α Variance Individual Average
EKG-P1-ADS-VHR1-1 0.839(*) 0.813 0.897 0.90 f = 3.82 (p < 0.05) EKG-P2-ADS-VHR1-2 0.799(*) 0.943 0.971 0.98 f = 32.36 (p < 0.05) EKG-P3-ADS-VHR1-3 0.930(*) 0.965 0.982 0.98 f = 33.37 (p < 0.05) EKG-P4-ADS-VHR1-4 0.986(*) 0.987 0.993 0.99 f = 161.5 (p < 0.05) EKG-P5-ADS-VHR1-5 0.569(*) 0.434 0.605 0.61 f = 2.933 (p < 0.05) EKG-P6-ADS-VHR1-6 0.996(*) 0.997 0.998 0.99 f = 616.8 (p < 0.05) EKG-P7-ADS-VHR1-7 0.812(*) 0.834 0.909 0.91 f = 10.39 (p < 0.05) EKG-P8-ADS-VHR1-8 0.604(*) 0.713 0.833 0.83 f = 2.74 (p < 0.05) EKG-P9-ADS-VHR1-9 0.524(*) 0.686 0.814 0.81 f = 1.86 (p < 0.05) EKG-P10-ADS-VHR1-10 0.729(*) 0.771 0.871 0.87 f = 3.63 (p < 0.05) EKG-P11-ADS-VHR1-11 0.766(**) 0.765 0.867 0.87 t = 2.92 (p < 0.05) EKG-P12-ADS-VHR1-12 0.972(**) 0.971 0.985 0.99 t = 28.41 (p < 0.05)
* Spearman’s correlation (p < 0.01). ** Pearson correlation (p < 0.01). α = Cronbach’s alpha. f = Fish-er-Snedecor. t = T-Student statistic. It is concluded that there is no significant difference between the sys-tems analyzed.
Thus, in regard to the sensors of the cardiac pulses, for example, we discover that it presents inconveniences in what seems to be the capture of the cardiac pulses in people with dark skin. In the same way, the storage card in the micro SD memory, presents conflicts and did not allow to tax the information when the SD-card memory exceeded the 8G storage capacity. Therefore, the ADS-VHR1 must be periodically reviewed to verify its components and change them when necessary; being this condition, at the same time, an advantage, since being low cost, allows the replacement of its parts in an easy and affordable way
[27] [28] [29] [30].
Despite these limitations of ADS-VHR1, there was no systematic bias in its operation. On the other hand, the individual data recorded by each ADS-VHR1 paired with the EKG-P, suggest that the agreement between the devices may also depend on the different positions of the electrodes of the EKG-P and the heart rate sensors of the ADS-VHR1, and therefore, the effects on the time of detec-tion of cardiac pulses in fracdetec-tions of thousandths of seconds. However, all the differences in the records were within accepted limits to conclude their validity.
It was shown that Arduino technology, free and open base, is a powerful tool for research activity, at low cost and easily accessible to teachers and new re-searchers who do not have proficient knowledge in the area of programming.
Disclaimer
DOI: 10.4236/jst.2019.94006 64 Journal of Sensor Technology
Ethical Aspects
This study was financed in part by the Coordenação de Aperfeiçoamento de Pessoal de Nível Superior-Brasil (CAPES)-Finance Code 001. Approved by the ethics committee of the UFRN (Parecer Consubstanciado do CEP No: 2,683,191). It is a product of the Doctoral Thesis carried out at the Universidade Federal do Rio Grande do Norte, Brasil, titled: ATENÇÃO SUSTENTADA NA SALA DE AULA: MODULAÇÃO DA PERSONALIDADE, EMOÇÃO E CRONOTIPO.
Conflicts of Interest
The authors declare no conflicts of interest regarding the publication of this pa-per.
References
[1] Porges, S.W. (1995) Orienting in a Defensive World: Mammalian Modifications of Our Evolutionary Heritage: A Polyvagal Theory. Psychophysiology, 32, 301-318. https://doi.org/10.1111/j.1469-8986.1995.tb01213.x
[2] Porges, S.W. (2001) The Polyvagal Theory: Phylogenetic Substrates of a Social Nervous System. International Journal of Psychophysiology, 42, 123-146.
https://doi.org/10.1016/S0167-8760(01)00162-3
[3] Porges, S.W. (2007) The Polyvagal Perspective. Biological Psychology, 74, 116-143. https://doi.org/10.1016/j.biopsycho.2006.06.009
[4] Thayer, J.F., Hansen, A.L., Saus-Rose, E. and Johnsen, B.H. (2009) Heart Rate Va-riability, Prefrontal Neural Function, and Cognitive Performance: The Neuroviscer-al Integration Perspective on Self-Regulation, Adaptation, and HeNeuroviscer-alth. BehaviorNeuroviscer-al Medicine, 37, 141-153.https://doi.org/10.1007/s12160-009-9101-z
[5] Fonfría, A., Poy, R., Segarra, P., López, R., Esteller, A., Ventura, C., Moltó, J., et al. (2011) Variabilidad de la tasa cardíaca (HRV) y regulación emocional. Fòrum de Recerca, 16, 903-913.
[6] Holzman, J. and Bridgett, D. (2017) Heart Rate Variability Indices as Bio-Markers of Top-Down Self-Regulatory Mechanisms: A Meta-Analytic Review. Neuroscience and Biobehavioral Reviews, 74, 233-255.
https://doi.org/10.1016/j.neubiorev.2016.12.032
[7] Capuana, L.J., Dwyan, J., Tays, W.J., Elmers, J.L., Witherspoon, R. and Segalowitz, S. (2014) Factors Influencing the Role of Cardiac Autonomic Regulation in the Ser-vice of Cognitive Control. Biological Psychology, 102, 88-97.
https://doi.org/10.1016/j.biopsycho.2014.07.015
[8] Shaffer, F. and Venner, J. (2013) Heart Rate Variability Anatomy and Physiology. Biofeedback, 41, 13-25.https://doi.org/10.5298/1081-5937-41.1.05
[9] Shaffer, F., McCraty, R. and Zerr, C. (2014) A Healthy Heart Is Not a Metronome: An Integrative Review of the Heart’s Anatomy and Heart Rate Variability. Frontiers in Psychology, 5, 1040.https://doi.org/10.3389/fpsyg.2014.01040
DOI: 10.4236/jst.2019.94006 65 Journal of Sensor Technology
[11] Yoo, K., Rosenberg, M., Hsu, W., Zhang, S., Li, C., Scheinost, D., Constable, T. and Chun, M. (2018) Connectome-Based Predictive Modeling of Attention: Comparing Different Functional Connectivity Features and Prediction Methods across Data-sets. NeuroImage, 167, 11-22.https://doi.org/10.1016/j.neuroimage.2017.11.010
[12] Rohr, C., Arora, A., Cho, I., Katlariwala, P., Dimond, D., Dewey, D. and Bray, S. (2018) Functional Network Integration and Attention Skills in Young Children. Developmental Cognitive Neuroscience, 30, 200-211.
https://doi.org/10.1016/j.dcn.2018.03.007
[13] Onley, A., Risko, E., D’mello, S. and Graesser, A. (2015) Attention in Educational Contexts: The Role of the Learning Task in Guiding Attention. In: Fawcett, J., Risko, E. and Kingstone, A., Eds., The Handbook of Attention, MIT Press, London, 623-641.
[14] Forman-Alberti, E.B. and Benjamin-Hinnant, J. (2016) Links between Autonomic Activity and Implicit Learning. International Journal of Psychophysiology, 110, 75-80. https://doi.org/10.1016/j.ijpsycho.2016.10.014
[15] Ohyama, T., Kaga, Y., Goto, Y., Aoyagi, K., Ishii, S., Kanemura, H., Aihara, M., et al. (2016) Developmental Changes in Autonomic Emotional Response during an Ex-ecutive Functional Task: A Pupillometric Study during Wisconsin Card Sorting Test. Brain & Development, 39, 187-195.
https://doi.org/10.1016/j.braindev.2016.10.002
[16] Sanchis, L., Prat, P. and Sitges, M. (2016) Imagen cardiovascular en la sala de elec-trofisiología. Revista Española de Cardiología, 69, 595-605.
https://doi.org/10.1016/j.recesp.2016.01.028
[17] Bermudez, E., Klerman, E., Czeisler, C., Cohen, D., Wyatt, J. and Phillips, A. (2016) Prediction of Vigilant Attention and Cognitive Performance Using Self-Reported Alertness, Circadian Phase, Hours since Awakening, and Accumulated Sleep Loss. PLoS ONE, 11, e0151770.https://doi.org/10.1371/journal.pone.0151770
[18] Graveline, I.M. and Wamsley, E.J. (2017) The Impact of Sleep on Novel Concept Learning. Neurobiology of Learning and Memory, 141, 19-26.
https://doi.org/10.1016/j.nlm.2017.03.008
[19] Itzek-Greulich, H., Randler, C. and Vollmer, C. (2016) The Interaction of Chrono-type and Time of Day in a Science Course: Adolescent Evening Types Learn More and Are More Motivated in the Afternoon. Learning and Individual Differences, 51, 189-198.https://doi.org/10.1016/j.lindif.2016.09.013
[20] Luque-Casado, A., Perales, J., Cárdenas, D. and Sanabria, D. (2016) Heart Rate Va-riability and Cognitive Processing: The Autonomic Response to Task Demands. Bi-ological Psychology, 113, 83-90. https://doi.org/10.1016/j.biopsycho.2015.11.013
[21] Zhang and Cicoira (2018) Flexible Self-Powered Biosensors. Nature, 561, 466-467. https://doi.org/10.1038/d41586-018-06788-1
[22] Nathan, A., Ahnood, A., Cole, M., Lee, M., Suzuki, Y., Hiralal, P., Milne, W., et al. (2012) Flexible Electronics: The Next Ubiquitous Platform. Proceedings of the IEEE, 100, 1486-1517. https://doi.org/10.1109/JPROC.2012.2190168
[23] González-Barajas, J.E. (2014) Cálculo del umbral para detección de la onda R del complejo cardiaco. Tecno Lógicas, 17, 47-55. https://doi.org/10.22430/22565337.198
http://www.scielo.org.co/pdf/teclo/v17n32/v17n32a05.pdf
[24] Javier, G., Davis, M., Cristian, V. and Johann, N. (2015) R-Wave Detection Algo-rithm Using Integration of Virtual Instruments. 20th Symposium on Signal Processing, Images and Computer Vision, Bogota, 1-6.
DOI: 10.4236/jst.2019.94006 66 Journal of Sensor Technology
[25] Urbano (2017) Diseño de algoritmo para cuantificación de frecuencia cardiaca promedio en dispositivo ARM (máquinas avanzadas tipo RISC) Universidad Santo Tomás: Bogotá.
[26] Weippert, M., Kumar, M., Kreuzfeld, S., et al. (2010) Comparison of Three Mobile Devices for Measuring R-R Intervals and Heart Rate Variability: Polar S810i, Suun-to t6 and an AmbulaSuun-tory ECG System. European Journal of Applied Physiology, 109, 779-786. https://doi.org/10.1007/s00421-010-1415-9
DOI: 10.4236/jst.2019.94006 67 Journal of Sensor Technology
Appendix
Code on the ARDUINO Platform of the Attention Detection System Based on HRV
#include <SPI.h> #include <SD.h> #include <stdlib.h> const int CS = 10; char dataString[7]; // all above is about sd card
const int livingledIBI = LED_BUILTIN; int sensorPin = 0;
int Signal = 0; int idle = 0;
double IBI = 600; // 600ms per beat = 100 Beats Per Minute (BPM) bool Pulse = false;
int lastBeatTime = 0;
double P = 512; // peak at 1/2 the input range of 0..1023 double T = 512; // trough at 1/2 the input range. double threshSetting = 550; // used to seed and reset the thresh variable double thresh = 480; // threshold a little above the trough
double amp = 100; // beat amplitude 1/10 of input range. bool firstBeat = true; // looking for the first beat
bool secondBeat = false; // not yet looking for the second beat in a row bool debug = false;
void setup () {
Serial.begin(115200); pinMode(10, OUTPUT);
Serial.print("Carregando cartao SD..."); if (!SD.begin(CS))
{
Serial.println("Falha no cartao SD!"); return;
}
Serial.println("SD carregado."); }
void loop () {
DOI: 10.4236/jst.2019.94006 68 Journal of Sensor Technology
int now = millis();
int N = now - lastBeatTime; // monitor the time since the last beat to avoid noise
// find the peak and trough of the pulse wave
if (Signal < thresh && N > (IBI / 5) * 3) { // avoid dichrotic noise by waiting 3/5 of last IBI
if (Signal < T) { // T is the trough
T = Signal; // keep track of lowest point in pulse wave
} }
if (Signal > thresh && Signal > P) { // thresh condition helps avoid noise P = Signal; // P is the peak
} // keep track of highest point in pulse wave
// NOW IT'S TIME TO LOOK FOR THE HEART BEAT // signal surges up in value every time there is a pulse
if (N > 250) { // avoid high frequency noise if ( (Signal > thresh) && (Pulse == false) && (N > (IBI / 5) * 3) ) {
Pulse = true; // set the Pulse flag when we think there is a pulse
IBI = now - lastBeatTime; // measure time between beats in mS lastBeatTime = now; // keep track of time for next pulse idle = 0;
if(!debug){
dtostrf(IBI,5,2,dataString); //sets IBI to sd
File pulsoIsaac = SD.open("pulso.txt", FILE_WRITE); //open pulso.txt pulsoIsaac.println(dataString); // write IBI to sd
pulsoIsaac.close(); // closes pulso.txt and save data
//Serial.print(IBI); //Serial.print(","); Serial.println(dataString);
}
DOI: 10.4236/jst.2019.94006 69 Journal of Sensor Technology
secondBeat = false; // clear secondBeat flag }
if (firstBeat) { // if it's the first time we found a beat, if firstBeat == TRUE
firstBeat = false; // clear firstBeat flag secondBeat = true; // set the second beat flag // IBI value is unreliable so discard it
return; } } }
if (Signal < thresh && Pulse == true) { // when the values are going down, the beat is over
Pulse = false; // reset the Pulse flag so we can do it again
amp = P - T; // get amplitude of the pulse wave thresh = amp / 2 + T; // set thresh at 50% of the amplitude P = thresh; // reset these for next time T = thresh;
}
if (N > 2500) { // if 2.5 seconds go by without a beat thresh = threshSetting; // set thresh default
P = 512; // set P default T = 512; // set T default lastBeatTime = now; // bring the lastBeatTime up to date firstBeat = true; // set these to avoid noise
secondBeat = false; // when we get the heartbeat back idle++;
}
if (idle >= 4){ Serial.println("cls"); idle = 0;
}
if(debug){
DOI: 10.4236/jst.2019.94006 70 Journal of Sensor Technology
if(Signal > thresh){ // If the signal is above "550", then "turn-on" Arduino's LED.
digitalWrite(livingledIBI,HIGH); } else {
digitalWrite(livingledIBI,LOW); // Else, the sigal must be be-low "550", so "turn-off" this LED.
delay(20); }
}