FOREWORD
The attached paper describes a system for run-time profiling of programs carried out, in the
pre-UNIX days, under the George 3 operating system on ICL 1906A hardware. DIDYMUS involved
setting up a monitoring process and multi-tasking it, alongside the program to be profiled, under
operating system control. SCAMP was a tool specific to the Algol 68-R language. which
pre-parsed the program to be profiled in order to create a new version, with profiling procedures
inserted. In this way run-time profiling could be made specific down to the level of assignment
statements, DO loops etc.
Shortly after this paper was published a tidal wave called “UNIX” spread over the academic
com-puter science community. Its philosophy of being ‘programmer friendly’ and more specifically,
‘system programmer friendly’, meant that all the tools for creating multi-tasked child processes
were already present, together with system calls such as ptime specifically designed for run-time
monitoring and debugging. What had required considerable ingenuity and effort under George 3
became almost routine under UNIX.
Readers unfamiliar with Michael Foster’s SID package (mentioned in the text) should note that,
in modern parlance, it was an ‘LL(k) parser-generator’. The ICL terminology ‘Executive’ is
equivalent to ‘Kernel’ in UNIX terminology.
The attached paper was presented at a conference on Algol 68 held at the University of
Strath-clyde in 1977, organised by Andrew McGettrick. Thanks to Andrew’s efforts the papers were
published in a uniform typewritten style and made wore widely available in Volume 12 number 6
of ACM SIGPLAN Notices. The entire Proceedings is available (to subscribers) as PDF Image +
Text via
http://portal.acm.org
.
COLOPHON
The rebuild of this final draft version started with acquiring the recognised ‘hidden text’ from the
ACM scanned version (see above). The recognition accuracy on the main paper was generally
very good but relapsed into being abysmal for the sample output in the Appendix. UNIX troff
was used to set up the correct typeface (Courier) and to get the line and page breaks reasonably
accurate. The tables and the graph in the main paper and in the Appendix, were re-set using the
tbl and grap pre-processors for troff .
Run-Time Profiling of Algol 68-R programs using
DIDYMUS and SCAMP
by
D.F. Brailsford, E. Foxley, K.C. Mander*
and D.J. Morgan.
Mathematics Department, University of Nottingham,
Nottingham, NG7 2RD.
*Present address: Department of Computational and
Statistical Science, University of
Liverpool, LIVERPOOL, L69 3BX, England.
Abstract
Information concerning the run-time behaviour of
programs ("program profiling") can be of the
greatest assistance in improving program efficiency.
Two software devices have been developed for use on
ICL 1900 Series machines to provide such information.
DIDYMUS is probabilistic in approach and uses multi- tasking
facilities to sample the instruction addresses used by a
program at run time. It will work regardless of the source
language of the program and matches the detected addresses
against a loader map to produce a histogram.
SCAMP is restricted to profiling Algol 68-R programs, but
provides deterministic information concerning those language
constructs that are monitored. Procedure calls to
appropriate counting routines are inserted into the source
text in a pre-pass prior to compilation. The profile
information is printed out at the end of the program run.
It has been found that these two approaches complement each
other very effectively.
1.
Introduction to DIDYMUS
DIDYMUS (Device for Investigating the DYnamic Machinations of User
Software) consists of a small run-time segment which samples the
behaviour of a given program at run time, together with an analyser
program which prepares a histogram from the sampled information. Both
the sampler and the analyser were written in Algol 68-R. For monitoring
programs written in high level languages other than Algol 68-R, a PLAN
version of the sampler (translated by hand from the Algol 68-R original)
is available. This can be interfaced via the standard ICL consolidator
scheme. Language-independent run time profiling can be provided on any
ICL machine which supports the ICL multi-member (i.e. multitasking)
facilities, and is capable of running the Algol 68-R analyser.
2.
The mechanism of DIDYMUS
DIDYMUS profiles a given program by sampling the instruction
addresses used during execution. These addresses are then matched up
with a loader map by the analyser and a histogram is produced. The
program to be profiled (PBP) is run as member 1 and the sampler as
member 0 of a two-task program running on a single processor machine
[1]. These members share a common working store, except for their first
16 words of storage which are saved whenever Executive de-activates a
member. Thus, member 0 (the sampler), whenever it is allowed to run,
inspects word 8 of the PBP which contains the address of the next
instruction to be executed. Care has to be taken in detecting when the
PBP has failed to run since the last address sample was taken, for this
would lead to detection of spurious sequences consisting of the same
instruction address.
The valid sample addresses that are detected are
buffered and transferred to a disc file.
The sampler task is given a high priority, relative to the PBP, in
the above scheme to ensure that the sampling is as frequent as possible.
However, in the scheme just outlined this would lead to large
consumption of processor time by the sampler in traversing a program
loop many times waiting for the lower priority PBP to do some more
computing. What is needed is a mechanism for the sampler to suspend
itself from running and to be interrupted periodically by Executive, for
the purpose of taking a new sample. This effect is achieved in the
implementation of DIDYMUS under the George 3 and 4 operating systems by
using the ICL Range Compatible Trusted Program (RCTP) facilities, which
allow such spasmodic interrupts to be given by Executive [2].
3.
Analysis of the addresses
The analyser program reads the disc file of addresses produced by
the sampler, relates them to a loader map and produces a histogram,
which is an approximate measure of processor time spent in various
portions of the program.
address "hits" in the PBPs address space. It is found that for a medium
size Algol 68-R program (say lOK of 24 bit words allocated to program
code) a run-time of about 1 minute is needed for reasonable accuracy.
For programs with run times falling short of what is needed, an
"incremental" facility is provided allowing for address hits from many
runs of the same program to be accumulated in one disc file.
4.
Discussion of DIDYMUS
The main use of DIDYMUS so far has been the detection of
pathological "bottlenecks" which slow up the running of a given program.
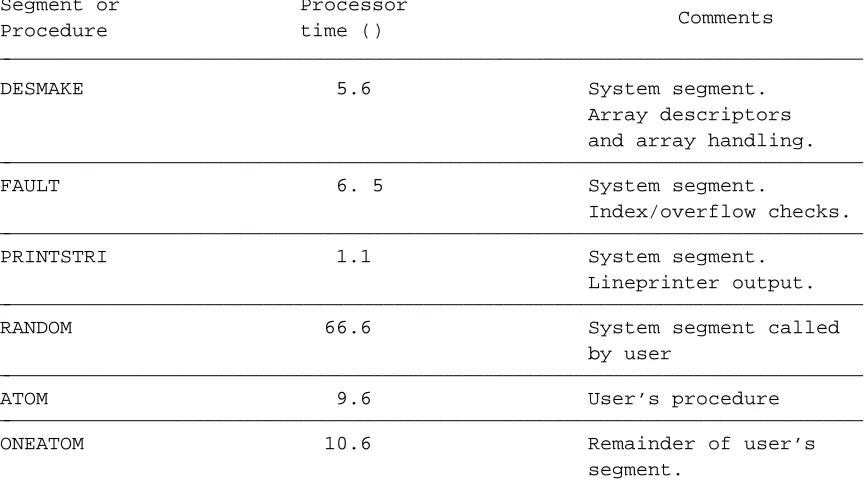
This is illustrated in Table 1 which shows the heavy use of the random
number generator by a student program NORAPROGD (which has an execution
time of 5 minutes on an ICL 1906A).
Segment or
Processor
Procedure
time ()
Comments
DESMAKE
5.6
System segment.
Array descriptors
and array handling.
FAULT
6. 5
System segment.
Index/overflow checks.
PRINTSTRI
1.1
System segment.
Lineprinter output.
RANDOM
66.6
System segment called
by user
ATOM
9.6
User’s procedure
ONEATOM
10.6
Remainder of user’s
[image:4.594.72.504.229.474.2]segment.
TABLE 1
DIDYMUS statistics for processor time usage in program
NORAPROGD (RANDOM is called from within the procedure ATOM).
and those which mean "this portion of the program was executed so
infrequently that the sampling process did not detect it".
5.
Introduction to SCAMP
SCAMP (Syntax Constructed Algol 68-R Monitoring Package) is a
syntax-driven pre-processor which inserts monitoring calls into an Algol
68-R text and arranges for subsequent analysis of the run-time behaviour
of the given program.
The SCAMP system monitors five Algol 68-R constructs: blocks,
routine bodies, if, case and do clauses. The system is an extension of
SARA [3,5], a skeleton syntax analyser which takes as its input an Algol
68-R source segment. Providing the segment is syntactically correct the
output from the SCAMP analyser will be an amended text containing extra
code to enable profiling information to be built up during the run of
this revised program. The monitoring information gives precise counts on
the number of times each construct of the original program was executed
and proves very useful in the development of test programs to ensure
that they exercise all of a program’s code and in the detection of
run-time bottlenecks, where a little optimisation of the coding could yield
great benefits in terms of increased execution speed.
6.
Mechanism of SCAMP
To produce the syntax analyser of SCAMP the SID package [4] is
compiled and run with the grammar of Algol 68-R (expressed in Backus
Normal Form) as its input. SID transforms the grammar into an equivalent
set of rules which can steer a one-track syntax analyser. This analyser
works in such a way that at any given moment in the course of the
analysis any semantic action can be obeyed. It is by this method that
SCAMP amends the user’s text at the correct syntactic positions in the
program. As an example consider the analysing of
do count plus 1 ;
This corresponds to
DO <DO1> UNC <DO2> in the grammar of Algol 68-R, where <DO1>, <DO2>
indicate the position of semantic actions and UNC is the controlled
unitary clause. In this situation, SCAMP transforms the original text to
do (mondos[l,2] plus 1; count plus 1);
unitary clause; mondos is an integer array which monitors the use of do
statements.
When SCAMP has successfully parsed the source text it possesses
sufficient information to declare data structures for use by the amended
program. The information passed over consists of the number of each of
the various constructs in the text, the line numbers on which they
appear, and the names of procedures and operators.
A standard SCAMP prelude containing the declarations of monitoring
procedures and a procedure to print the final profiling information is
edited into the amended text to form a revised program which is then
suitable for compiling and running, during which time its activity is
monitored.
7.
Operation of SCAMP and its limitations
The main limitations arise because of the lack of mode analysis in
SCAMP. Some of these problems could be circumvented by making the input
syntax to SID rather more complicated but this was felt to be unwise at
the present stage of development. Consequently if and case clauses must
be written in the full form. The brief forms using ( , | etc. are not
monitored. Furthermore, the full form case clauses must involve an
integral-chooser and not the UNITED-chooser of the case conformity
clause. In fact if the latter is to be used it must be written in the
brief form so that SCAMP will fail to recognise it as a case
construction!
Lack of mode analysis also means that SCAMP cannot distinguish a
call of a parameterless procedure. Accordingly, such procedures have to
be monitored by inserting calls within the routine texts themselves and,
for the sake of uniformity, this policy is followed for all procedures.
Unfortunately this implies that externally defined procedures and
library routines cannot be monitored directly. It is, of course,
possible to force some monitoring of such procedures by writing extra
coding to call them indirectly, but implicitly called system routines
e.g. for garbage calculation cannot be monitored. From the foregoing we
note that the counts printed out for procedures are the number of times
the routine was actually executed and not the number of times it was
called directly.
At present the printing of the monitoring information is performed
at the end of the program run by planting a call to an output procedure.
We hope soon to supplant this method by trapping the deletion of the
program at job control level and re-entering it to tidy up and print out
results. This method is already used in DIDYMUS and has the advantage
that all manner of unusual error exits can be trapped.
8.
Discussion of SCAMP
The program had to be re-written slightly to allow the system procedure
RANDOM to be monitored, but nonetheless the broad pattern of run time
activity is in agreement with that shown by DIDYMUS. Note particularly
the large number of calls of the procedure ATOM and consequently of the
procedure RANDOM. It is clear that results of this sort allow one to
study the dynamic use made of language constructs in user programs, and
also to detect logical errors where, perhaps, certain portions of the
program are not executed at all.
9.
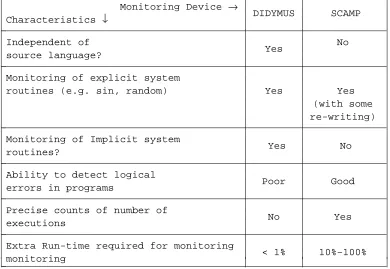
Comparison of SCAMP and DIDYMUS and conclusions therefrom
We have gathered together, in Table 2, the main strengths and
weaknesses of DIDYMUS and SCAMP. It can be seen that DIDYMUS is the
preferred system from the point of view of generality of application and
the fact that system activity can be monitored. However for those who
program exclusively in Algol 68-R the detailed nature of the information
made available by SCAMP may outweigh all other considerations.
Monitoring Device
→
Characteristics
↓
DIDYMUS
SCAMP
Independent of
No
source language?
Yes
Monitoring of explicit system
routines (e.g. sin, random)
Yes
Yes
(with some
re-writing)
Monitoring of Implicit system
routines?
Yes
No
Ability to detect logical
errors in programs
Poor
Good
Precise counts of number of
executions
No
Yes
Extra Run-time required for monitoring
monitoring
< 1%
10%–100%
[image:7.594.94.484.260.529.2]TABLE 2
Comparison of DIDYMUS and SCAMP
There is little doubt that monitoring of the SCAMP variety is best
done by the compiler in the classic Algol W fashion [6]. Not only does
the compiler possess all the
valuable enough to make this the next best approach if the compiler will
not perform the task.
From the point of view of DIDYMUS we feel that its worth has been
proved sufficiently for us to hope that all operating system designers
will in future provide some sort of mechanism whereby this kind of
profiling can be performed.
Acknowledgements
We should like to thank Miss Nora Bulmer-Kirby for providing the
program to be profiled and the SRC for support to KCM and DJM.
References
[1] “PLAN Reference Manual”. ICL Publication No. TP 4322.
[2] “Central Processors”. Chapter 13, ICL publication No. TP 4412.
[3] P.M. Woodward, “Skeleton analyser and reader for Algol 68-R
(SARA)”. RSRE internal publication (1975).
[4] J.M. Foster, “Syntax Improving Device (SID)”, Comp. J.
11, 31 (1968).
[5] P.M. Woodward, “Syntax Directed Processing of Algol Text”
Proceedings of Conference on Applications of Algol
68. (University of East Anglia, 1976) p. 186.
[6] E.H. Satterthwaite, “Debugging Tools for High Level
Languages”, Computer Software–Practice and
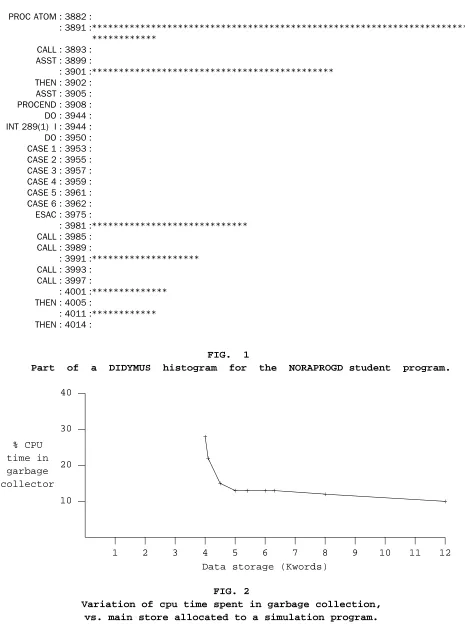
PROC ATOM : 3882 :
: 3891 :**********************************************************************
************ (82)
CALL : 3893 : ASST : 3899 :
: 3901 :********************************************* (45)
THEN : 3902 : ASST : 3905 : PROCEND : 3908 : DO : 3944 : INT 289(1) I : 3944 : DO : 3950 : CASE 1 : 3953 : CASE 2 : 3955 : CASE 3 : 3957 : CASE 4 : 3959 : CASE 5 : 3961 : CASE 6 : 3962 : ESAC : 3975 :
: 3981 :***************************** (29)
CALL : 3985 : CALL : 3989 :
: 3991 :******************** (20)
CALL : 3993 : CALL : 3997 :
: 4001 :************** (14)
THEN : 4005 :
: 4011 :************ (12)
THEN : 4014 :
FIG.
1
Part
of
a
DIDYMUS
histogram
for
the
NORAPROGD student
program.
% CPU
time in
garbage
collector
Data storage (Kwords)
10
20
30
40
1
2
3
4
5
6
7
8
9
10
11
12
+
+
+
+ + + + +
+
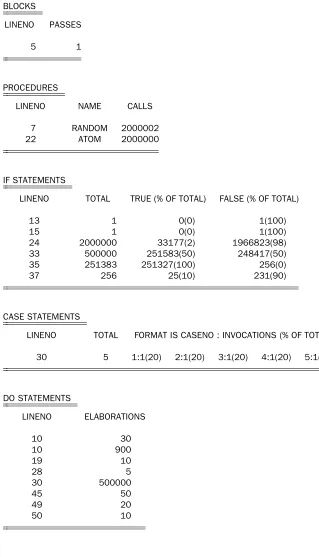
FIG. 2
[image:9.594.66.531.27.656.2]MONITORING INFORMATION FOR TEXT FILE NORAPROGD **********************************************
BLOCKS
LINENO PASSES
5 1
PROCEDURES
LINENO NAME CALLS
7 RANDOM 2000002
22 ATOM 2000000
IF STATEMENTS
LINENO TOTAL TRUE (% OF TOTAL) FALSE (% OF TOTAL)
13 1 0(0) 1(100)
15 1 0(0) 1(100)
24 2000000 33177(2) 1966823(98)
33 500000 251583(50) 248417(50)
35 251383 251327(100) 256(0)
37 256 25(10) 231(90)
CASE STATEMENTS
LINENO TOTAL FORMAT IS CASENO : INVOCATIONS (% OF TOTAL)
30 5 1:1(20) 2:1(20) 3:1(20) 4:1(20) 5:1(20)
DO STATEMENTS
LINENO ELABORATIONS
10 30
10 900
19 10
28 5
30 500000
45 50
49 20
[image:10.594.94.413.65.622.2]50 10