Advanced decision support for complex clinical decisions
Brain Keltch1, Yuan Lin1, Coskun Bayrak2
1Department of Applied Science, University of Arkansas at Little Rock, USA; 2Department of Computer Science, University of Arkansas at Little Rock, USA.
Email: [email protected]; [email protected]; [email protected]
Received 1 March 2010; revised 11 March 2010, accepted 13 March 2010.
ABSTRACT
A Physician’s decision-making skills are directly re-lated to the patient’s positive outcomes. Therefore, a wealth of medical knowledge and clinical experience are key assets for a physician to have. The goal here is to use historical clinical data and relationships processed by Artificial Intelligence (AI) techniques to aid physicians in their decision making process. Pre-senting this information in a Clinical Decision Sup-port System (CDSS) is an effective means to consoli-date decision results. The CDSS provides a large number of medical support functions to help clini-cians make the most reasonable diagnosis and choose the best treatment measures. Initial results have shown great promise in accurately predicting Fibro-sis Stage in Hepatitis patients. Utilizing this tool could mitigate the need for some liver biopsies in the more than 170 million Hepatitis patients worldwide. The prototype is extendable to accommodate additional techniques (for example genetic algorithms and logis-tics regression) and additional medical domain solu-tions (for example HIV/AIDS).
Keywords: Fibrosis; Clinical Decision Support; Decision Tree; Neural Network
1. INTRODUCTION
1.1. CDSS Definition
In hospital information systems (HIS), there are typically two main systems: Hospital Management Information Systems (HMIS) and Clinical Information Systems (CIS) [1]. HMIS support the hospital administration and trans-action processing services while the CIS is used to sup-port the clinical staff activities, to collect and dispose of clinical medical information, and to accumulate rich clinical knowledge. The CIS also provide clinical advice, support clinics, assistant clinical decision-making and to enhance staff efficiency. Clinical decision support sys-tems (CDSS) are part of the CIS. It is an information system which uses expert systems and artificial intelli-gence (AI) technology to support clinical decision. It
makes integrated diagnostic and medical advice bases on the collected patients’ information, providing reference for the clinical medical officers.
1.2. Key Functions
Clinical decision support systems vary greatly in their complexity, function, and application. A Recent study [2] on health care information management four key functions of CDSS were outlined as follows:
1) Administrative: Supporting clinical coding and documentation, authorization of procedures, and re-ferrals.
2) Managing clinical complexity and details: Keep-ing patients on research and chemotherapy protocols; tracking orders, referrals follow-up, and preventive care.
3) Cost control: Monitoring medication orders; avoi- ding duplicate or unnecessary tests.
4) Decision support: Supporting clinical diagnosis and treatment plan processes; and promoting use of best practices, condition-specific guidelines, and popu- lation-based management.
Our project will focus on item four, the decision support function and, in particular, utilization of his-torical laboratory data and outcome data processed through artificial intelligence tools. The combination of historical data and predictive tools provides valu-able information in the hands of physicians as they develop a course of treatment for a patient.
2. BACKGROUND: AI TECHNIQUE IN
CDSS
with tasks like diagnosis [3].
Today the importance of diagnosis as a task requiring computer support in routine clinical situations receives much less emphasis. The strict focus on the medical set-ting has now broadened across the healthcare spectrum, and instead of AI Medical systems, it is more typical to describe them as CDSS [3].
In our project, we evaluated and compared two tech-niques that will be core forecasting tools in a CDSS, which are Data Mining and Neural Networks.
The main purpose of doing data mining and knowledge discovery on the medical database is to predict disease and disease classification. Classification and prediction are two forms of data analysis which can be used to de-scribe the model of the important data type or predict the future trends of the data [5].
Commonly used data mining algorithms are: associa-tion rules, decision trees, rough sets, statistical analysis, neural networks, support vector machines, fuzzy clus-tering, Case-Based Reasoning (CBR), Bayesian fore-casting and visualization technology [6]. The common methods used in auxiliary diagnosis of clinical disease are 1) Bayes discriminate analysis 2) artificial neural network 3) decision tree.
However within the context of the study, the focus will be concentrated on decision tree and neural net-work.
2.1. Decision Tree
The decision tree is a very efficient machine learning classification algorithm. It is the origin in the concept of learning systems CLS, and then progress to ID3 method. In the end, it evolved to c5.0 which can han-dle continuous attributes. Well-known decision tree methods are CART and Assistant [5].
Decision tree learning uses a decision tree as a pre-dictive model which maps observations about an item to conclusions about the item’s target value. In these tree structures, leaves represent classifications and bra- nches represent conjunctions of features that lead to those classifications. One of the biggest advantages of the method is that the learning process does not require the user to understand a lot of background knowledge [6].
Nonetheless, data mining is a complex process to identify the useful information from large data sets. Although it is common to focus on the development, analysis and application of algorithms, the data selec-tion and data pre-processing are the most timecon-suming activity in the entire data mining process, which affects the process and results [6].
2.2. Neural Network
Artificial Neural Networks have been proven to build efficient rule extraction/classification and forecasting
applications. They provide a powerful non-linear ma-chine learning techniques and are able to extract rele-vant features from large data sets. They are able to uti- lize and compare equally quantitative and qualitative data which is common in the clinical environments [7]. Neural Networks can handle redundant features as wei- ghts are learned from the training data.
The primary disadvantage of neural networks is that they will always arrive at a solution for any data set. This means that the quality of the resulting model is highly dependent on the quality and breath of the trai- ning data. It is easy to over-train the model, so that it can only predict the training data set. This can be mi-nimized by assuring that convergence stopping stra- tegies are effective and that the training data set is rep-resentative of the solutions space. Also, the resulting neural network solution is simply a node structure with inter-node weights. This requires validation of the out-put by additional statistical methods (i.e. decision trees) that are more understandable by subject matter experts.
3. AI ASSISTED CLINICAL DECISION
SUPPORT SYSTEM
This study will focus on the demonstration and incorpo-ration of neural network and decision tree techniques into a Clinical Decision Support System. These two AI techniques were selected because of their complemen-tary attributes. Neural networks provide little definition of their predictive result, while decision tree output pro-vides clear connections to historical data. Both methods will provide different information to the physician. Other AI methods should be considered in future work.
The database we plan on using for this study was col-lected at Chiba University hospital in Japan, and is a Practice of Knowledge Discovery in Databases (PKDD) 2005 Discovery Challenge dataset [11]. The data set contains patient data, laboratory data, and liver biopsies data on 771 hepatitis B and C patients. The goal will be to evaluate whether laboratory examinations can be used to estimate the stage of liver fibrosis. If this is possible, physicians may be able to use laboratory examinations as substitutes for biopsies and to aid in the treatment scenario. Liver biopsy is an invasive procedure and en-tails risk to patients. Decision tree and neural network methods based on a historical dataset will aid physicians in the development of treatment plans for Hepatitis pa-tients.
The overall architectural representation of the system is shown in Figure 1.
Raw Laboratory
Data
Patient Demographic
Data
Data Cleansing & Processing
Knowledge Base Inference
Engine
Decision Tree
Neural Network
USER INTERFACE
Patient Data in
Risk, Treatment Suggestions For Patient
Prototype Scope
[image:3.595.56.287.81.166.2]Remark Figure 1. AI assisted clinical decision support system.
of the disease and fibrosis formation which are the key outcome measures. These fibrosis stage results deter-mine the treatment protocol. This study attempts to pre-dict fibrosis stage base on laboratory and patient data. The methodology and approach of processing data, ap-plying AI techniques, and development of the resulting knowledge base can be utilized as a pattern for other medical treatment needs represented in a CDSS.
3.1. Data Processing and Cleaning
The sample hepatitis data set for our study is derived from the ECML/PKDD 2005 Discovery Challenge found at [11]:
The hepatitis dataset contains the results of laboratory examinations taken on the patients of hepatitis B and C, who were admitted to Chiba University Hospital in Ja-pan. Hepatitis A, B and C are virus infections that affect the liver of the patient. Hepatitis B and C chronically inflame the hepatocyte, whereas hepatitis A acutely in-flames it. Hepatitis B and C are especially important because they have a potential risk of developing liver cirrhosis or hepatocarcinoma. An indicator that can be used to know the risk of cirrhosis or hepatocarcinoma is fibrosis of hepatocyte. For instance, liver cirrhosis is characterized as the terminal stage of liver fibrosis.
We utilized three tables for our study, as show in Ta-bles 1-3, below:
The MID field provided a common link between the three tables. Since the question we were addressing is to evaluate whether laboratory examinations can be used to estimate the stage of liver fibrosis our goal was to obtain one table that contained patient information, fibrosis stage and laboratory data. We chose to utilize in-hospital laboratory data, as it was more complete and we felt it would have better controls on quality and consistency.
Because of the large volume of data all files were translated into MS Access tables to process. The follow-ing steps were utilized:
1) Select all records from Table 2 - 649 records. 2) Link to Table 1 based on Patient ID - 649 records. 3) Link to the Laboratory Examination Table 3 based on Patient ID. Select records where laboratory examina-tions were available for at least 90% of our biopsy pa-tients, resulting in 16 examination parameters.
4) Link to and Match appropriate lab examination
[image:3.595.310.538.200.279.2]re-sults (Table 3) with patient information and fibrosis stage information (the combined Tables 1 and 2). Select the laboratory examination that was earlier that the biopsy, but not more than 30 days earlier. This resulted in 425 re-cords with complete data on the 16 laboratory examination results, patient information, and fibrosis stage biopsy re-sults.
Table 1. Basic information of patients: pt_e030704.csv (total 771 records).
Item Meaning
MID Identification of the patient (masked) unsigned integer
PT Sex Sex of the patient M(male) or F (female)
PT BirthDate Birth date of the patient YYYYMMDD
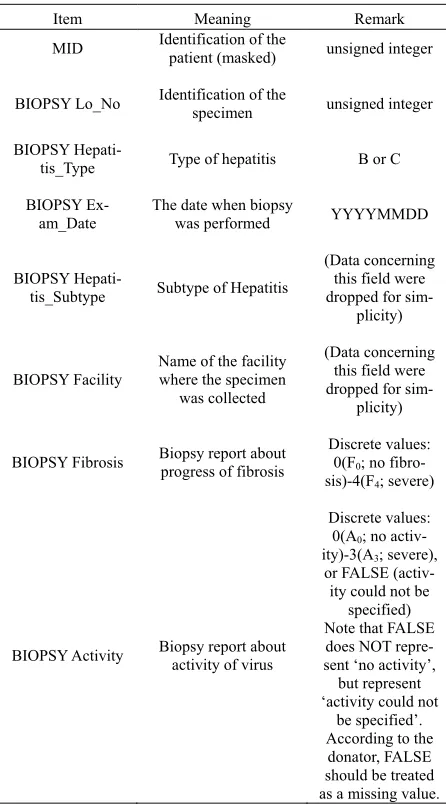
Table 2. Results of biopsy: bio_e030704.csv (total 694 re-cords).
Item Meaning Remark
MID Identification of the patient (masked) unsigned integer
BIOPSY Lo_No Identification of the specimen unsigned integer
BIOPSY
Hepati-tis_Type Type of hepatitis B or C
BIOPSY Ex-am_Date
The date when biopsy
was performed YYYYMMDD
BIOPSY
Hepati-tis_Subtype Subtype of Hepatitis
(Data concerning this field were dropped for
sim-plicity)
BIOPSY Facility
Name of the facility where the specimen
was collected
(Data concerning this field were dropped for
sim-plicity)
BIOPSY Fibrosis Biopsy report about progress of fibrosis Discrete values: 0(F0; no
fibro-sis)-4(F4; severe)
BIOPSY Activity Biopsy report about activity of virus
Discrete values: 0(A0; no
activ-ity)-3(A3; severe),
or FALSE (activ-ity could not be specified) Note that FALSE does NOT repre-sent ‘no activity’,
but represent ‘activity could not
be specified’. According to the
[image:3.595.312.535.317.719.2]Table 3. Results of in-hospital examinations: ilab_e030704.csv.
Item Meaning Remark
MID Identification of the patient (masked)
ILAB Exam_Date Date of the examination YYYYMMDD
ILAB Exam_No
ID for each examination performed repeatedly on the same day (n-th
ex-amination)
ILAB Exam_Name Name/code of the ex-amination
ILAB Ex-am_Result
Result of the examina-tion
3.2. Methods and Analysis
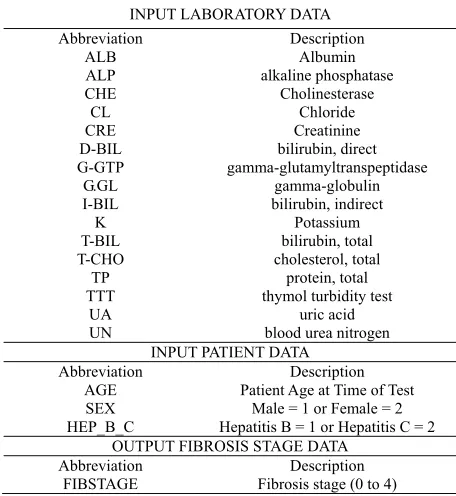
The objective is to use the decision tree and neural net-works to predict fibrosis stage from patient data and la-boratory data. We have a data set (see data preparation) of 424 historical that we will use to train and validate a decision tree model and a neural network model. Table 4 is a map of the data we will be using.
3.2.1. Decision Tree Analysis
[image:4.595.56.284.473.721.2]Data Mining is an analytic process designed to explore data (usually large amounts of data - typically business or market related) in search of consistent patterns and/or systematic relationships between variables, and then to validate the findings by applying the detected patterns to new subsets of data. Decision Tree’s are one methodol-ogy utilized in the data mining set of tools. The ultimate
Table 4. Data utilized for neural network.
INPUT LABORATORY DATA
Abbreviation Description ALB Albumin
ALP alkaline phosphatase
CHE Cholinesterase CL Chloride CRE Creatinine
D-BIL bilirubin, direct
G-GTP gamma-glutamyltranspeptidase G.GL gamma-globulin
I-BIL bilirubin, indirect
K Potassium
T-BIL bilirubin, total
T-CHO cholesterol, total
TP protein, total
TTT thymol turbidity test
UA uric acid
UN blood urea nitrogen
INPUT PATIENT DATA
Abbreviation Description AGE Patient Age at Time of Test
SEX Male = 1 or Female = 2 HEP_B_C Hepatitis B = 1 or Hepatitis C = 2
OUTPUT FIBROSIS STAGE DATA
Abbreviation Description FIBSTAGE Fibrosis stage (0 to 4)
goal of data mining is prediction - and predictive data mining is the most common type of data mining.
For the project, Weka 3.4 [9] which is a collection of machine learning algorithms for data mining tasks is used. The algorithms can either be applied directly to a dataset or called from your own code. Weka contains tools for data pre-processing, classification, regression, clustering, association rules, and visualization. It is also well-suited for developing new machine learning schemes. It also provides Decision Tree capability that we will use in this study.
3.2.1.1. Decision Tree Testing Procedure Step 1: Data preprocessing
The input data file needs to be organized in the form of ARFF in order to be processed in the Weka environ-ment. In the file, all the values for the attributes needed to be filled in. If there is any missing value for an attrib-ute, a “?” is used for substitution.
The Figure 2 shows the attributes and the patient’s information whose Masked ID is 1. In the input file, even the data for the predicted attribute Biopsy Fibrosis needs to be completed for the training data set. For the analysis 392 patients’ information was used to develop the decision tree module and predict the other 32 pa-tients’ fibrosis stage.
The remaining 32 patients’ data was formatted into a test ARFF file. In this file the fibrosis is substituted with a “?”. Figure 3, below shows the patient’s information whose MID is 907.
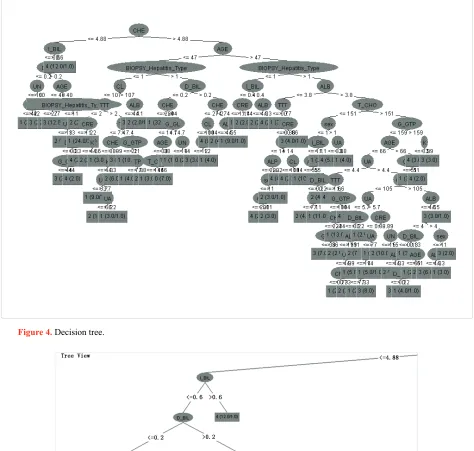
Step 2: Build the Model and get Decision Tree We used the C4.5 algorithm to construct the decision tree. The root node is the Biopsy Fibrosis with five branches which present the 5 levels where the different laboratory values and patient characteristic are assigned one level at a time. Figure 4 shows a graphical presenta-tion of the complete decision tree model of the data set. The Figure 5 shows a graphical presentation of the branch of the decision tree model where CHE <= 4.48.
[image:4.595.309.538.534.690.2]Figure 3. WEKA test data file.
Step 3: Prediction
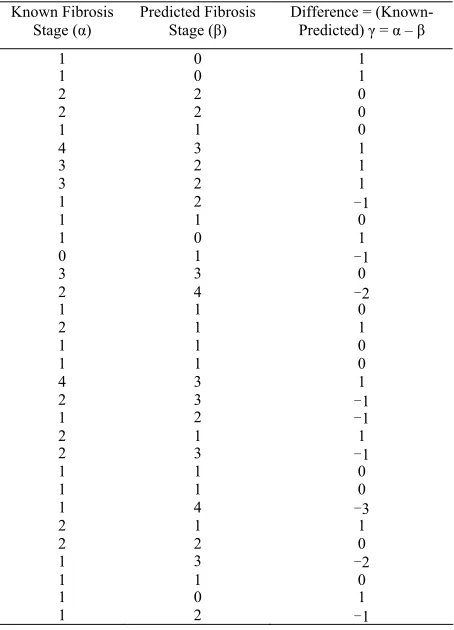
The result of predicting the values with the con-structed decision tree model is shown in Table 5. The table contains 32 patients’ fibrosis stage values; the first column is the actual fibrosis stage, α, from the biopsy; the second is the predict values, β, by the decision tree model; and the third column shows the difference, γ = α – β. The decision tree model results showed an accuracy of 37.5% (12/32) of correct fibroid prediction. Predicting fibrosis values within a range of +or – one of the actual fibroid stage showed an accuracy of 91% (29/32). 3.2.1.2. Suggestions to Improve Decision Tree
Accuracy
1) An increase in the number of training data exam-ples will increase the correctness. Hence we can get a more powerful model, if we have a comprehensive training data set.
2) It is possible that obtaining additional laboratory attributes will increase the correctness. We were able to use only 16 laboratory attributes to predict the result. This was limited by the original data availability. We deleted some laboratory data since the incomplete data may also affect the test result.
3) The parameter setting for the decision tree algo-rithm utilized by Weka software is entered manually. We used the default value for the test because of limited time for the analysis. We may be able to improve results by testing additional parameters.
3.2.2. Neural Network Analysis
[image:5.595.311.538.96.411.2]Artificial neural networks (ANNs) are systems that are constructed to use some organizational principles re-sembling those of the human brain. They are information processing systems that demonstrate the ability to learn, recall, and generalize from training patterns or data. ANNs are good at tasks such as pattern matching and classification, data clustering, and forecasting.
Table 5. Decision tree prediction quality.
Known Fibrosis Stage (α)
Predicted Fibrosis Stage (β)
Difference = (Known- Predicted) γ = α – β
1 0 1
1 0 1
2 2 0
2 2 0
1 1 0
4 3 1
3 2 1
3 2 1
1 2 -1
1 1 0
1 0 1
0 1 -1
3 3 0
2 4 -2
1 1 0
2 1 1
1 1 0
1 1 0
4 3 1
2 3 -1
1 2 -1
2 1 1
2 3 -1
1 1 0
1 1 0
1 4 -3
2 1 1
2 2 0
1 3 -2
1 1 0
1 0 1
1 2 -1
For the experiment we used a freeware tool called Neuro 3 [10] which uses the back propagation neural network (BPN). The term backpropagation refers to the training method by which the weights of the network connection are adjusted. The calculations procedure is feedforward, from input layer through hidden layers to output layer. During training, the calculated outputs are compared with the desired values, and then the errors are backpropagated to correct all weight factors.
All Training factors are defined by the users, including
Number Hidden Layers
The Threshold Value
Transfer functions
Learning Rate
Momentum Coefficient
Maximum Iterations
Convergence Criteria
Network and training parameters are stored in sce-nario files and on projects spreadsheets which may be copied and pasted to other spreadsheet programs.
3.2.2.1. Neural Network Testing Procedures
The process for testing the predictive capabilities of the Neural Network includes the following steps:
Figure 4. Decision tree.
Step 2. Define the Neural Net architecture. The num-ber of input nodes is defined by our 19 input (three tient data parameters and 16 laboratory parameters) pa-rameters. And we have one output node (fibroid stage). The number of nodes in the hidden Layer is shown in the Figure 6.
Step 3. Define the run parameters. For this study we will only adjust the number of iterations that the error will be calculated and the weight adjusted. This error calculation and backpropagation will be executed 10,000 or 30,000 times.
Step 4. Run the neural network model on the training data set. The Neuro 3 tool provides a R-squared value and Sum of Errors for the training data set that provides some indication of the goodness of the model. A exam-ple of the Neuro 3 screen is shown in Figure 7.
Step 5. Utilize the trained neural network in Neuro 3 to predict the fibrosis stage for the prediction data set. Evaluate the goodness of fit by evaluating the percent of predictions that were correct, and that were within plus or minus 1, 2, or 3.
Step 6. Adjust the parameters in Step 1 through Step 5 until the optimal fit is achieved.
Step 7. Utilize the final selected model and train this model with all 424 historical data elements. Identify any deficiencies in the process or items that would be helpful for future work.
3.2.2.2. Testing and Validation Results
[image:7.595.70.272.575.701.2]Eleven neural network models were generated. The best
Figure 6. Architecture of a BPN neural network.
Figure 7. Neuro 3 screen.
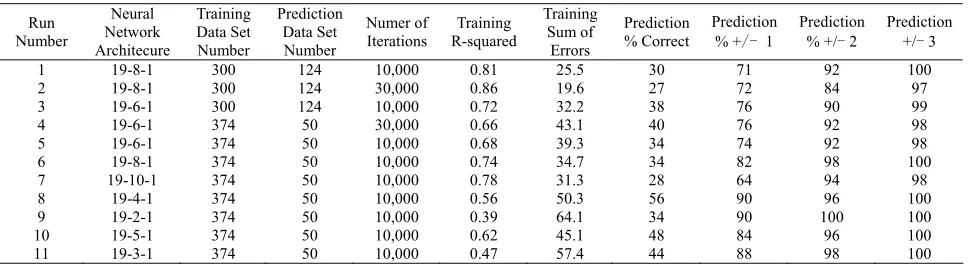
fitting model is Run Number 8, a 19-4-1 architecture trained with 10,000 iterations. This model provides fair-ly good predictive capabilities with 56% of predictions being correct (γ= α – β = 0) and 90% being within +/- one fibroid stage (γ= α – β = ± 1). The run statistics are show below in Table 6.
The process of testing and validation of results re-vealed the following future considerations:
First, the increase in the amount of training data would greatly improve the predictive capability of the tool. This can be observed comparing Run Number 1 to Run Number 6. The application should allow for inclu-sion of additional data.
Second, additional data elements may increase the predictive capabilities of the tool. We only had sufficient data coverage for 16 laboratory data elements. Addi-tional laboratory data elements should be acquired and evaluated utilizing these techniques.
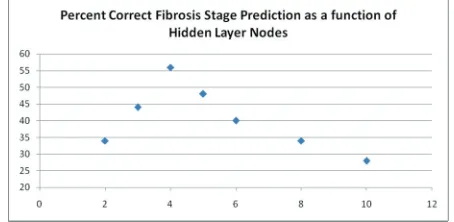
Third, the analysis tools and selection of neural net-work architecture and run parameters was selected ma-nually. This was a limitation of time available for this study. Automated analysis techniques and hybrid tech-niques combining neural network and genetic algorithms should be considered. An illustration of the sensitivity of predictive capabilities to hidden layer nodes shows in the Figure 8 below. The vertical axis shows the percent of patients that the neural network predicted the correct fibrosis stage. The horizontal axis shows the number of hidden nodes specified in the neural network model, indicating that the accuracy of prediction is very sensi-tive to the number of hidden nodes in the model.
4. CONCLUSIONS
We have completed the development of a prototype that utilizes publically available patient data to address a sin-gle clinical decision–the prediction of fibrosis stage shown in Figure 9. The near-term customers for our project prototype are clinicians treating Hepatitis B and C patients.
Currently the key diagnostic tool in assessing the de-gree of liver disease in these patients is a liver biopsy. This procedure is invasive and requires the physician to
[image:7.595.310.537.580.691.2]extract a small amount of the patient’s liver using a fine needle and a suction syringe. While complications rates are low, < 3%, when they do occur they have large im-pacts. Also these procedures are expensive ($ 2,000 - $ 4,000 per test). Within the past several years several non-invasive tests have been developed as alternatives to biopsies. These tests generally require use of ultra sound equipment and/or specialized/proprietary blood test. These include: FibroScan, FIBROSpect II, FibroTest, FibroTest-ActiTest, and HCV-FibroSure. Cost for these test range from $ 400 to $ 700 [8].
[image:8.595.60.283.77.247.2]The advantage of our method is that only standard liver panel blood tests are required to make the predic-tion of liver fibrosis. This provides low cost testing without any additional impact to the patient. Beyond the specific application in our prototype, linking AI tools Figure 9. Prototype web application.
Table 6. Run statistics, run 8 is used for prediction.
Run Number
Neural Network Architecure
Training Data Set Number
Prediction Data Set Number
Numer of Iterations
Training R-squared
Training Sum of
Errors
Prediction % Correct
Prediction % +/- 1
Prediction % +/- 2
Prediction +/- 3
1 19-8-1 300 124 10,000 0.81 25.5 30 71 92 100
2 19-8-1 300 124 30,000 0.86 19.6 27 72 84 97
3 19-6-1 300 124 10,000 0.72 32.2 38 76 90 99
4 19-6-1 374 50 30,000 0.66 43.1 40 76 92 98
5 19-6-1 374 50 10,000 0.68 39.3 34 74 92 98
6 19-8-1 374 50 10,000 0.74 34.7 34 82 98 100
7 19-10-1 374 50 10,000 0.78 31.3 28 64 94 98
8 19-4-1 374 50 10,000 0.56 50.3 56 90 96 100
9 19-2-1 374 50 10,000 0.39 64.1 34 90 100 100
10 19-5-1 374 50 10,000 0.62 45.1 48 84 96 100
11 19-3-1 374 50 10,000 0.47 57.4 44 88 98 100
with clinical decision support systems has wide applica-bility for other medical and healthcare solutions.
[3] Enrico, C. (2003) Guide to health informatics. 2nd Edition, Chapter 19, Artificial Intelligence in Medicine: An In-troduction. Hodder Arnold, Arnold.
We have utilized Visual Studio 2008 for our prototype. With continued modifications beyond the prototype, we will utilize SQL Server 2008. Additionally we are utiliz-ing two open source analytic tools for the AI component of our project. Namely, we are using “Neuro 3” a Visual Basic application for the neural network application and “Weka” for the decision tree portion of our project.
[4] Robert, S.L. and Lee, B.L. (1959) Reasoning foundations of medical diagnosis: Symbolic logic, probability, and value theory aid our understanding of how physicians reason. American Association for the Advancement of
Science, 130(3366), 9-21.
[5] Špečkauskienė, V. and Lukoševičius, A. (2009) Method-ology of adaptation of data mining methods for medical decision support: Case study. Data Mining, 9(2), 228- 235.
REFERENCES
[6] Han, J. and Kamber, M. (2001) Data mining concepts and techniques. 2nd Edition, Academic,Kluwer. [1] Begg, R. (2009) Artificial intelligence techniques in
medicine and health care. Concepts, Methodologies, Tools,
and Applications, Sugumaran, V., Ed., 48(12), 1-99. [7] Taylor, J.G. (1996) Neural networks and their applications. John Wiley and Sons, New York. [2] Perreault, L.E. and Metzger, J.B. (1999) A pragmatic
framework for understanding clinical decision support. In: Middleton, B., Ed., Clinical decision support systems.
Journal of Healthcare Information Management, 13(2),
5-21.
[image:8.595.57.543.290.423.2]