DOI:10.1051/0004-6361/201425433 c
ESO 2015
Astrophysics
&
Li abundances in F stars: planets, rotation, and Galactic
evolution
,
E. Delgado Mena
1,2, S. Bertrán de Lis
3,4, V. Zh. Adibekyan
1,2, S. G. Sousa
1,2, P. Figueira
1,2, A. Mortier
6,
J. I. González Hernández
3,4, M. Tsantaki
1,2,3, G. Israelian
3,4, and N. C. Santos
1,2,51 Centro de Astrofisica, Universidade do Porto, Rua das Estrelas, 4150-762 Porto, Portugal
e-mail:Elisa.Delgado@astro.up.pt
2 Instituto de Astrofísica e Ciências do Espaço, Universidade do Porto, CAUP, Rua das Estrelas, 4150-762 Porto, Portugal
3 Instituto de Astrofísica de Canarias, C/via Lactea, s/n, 38200 La Laguna, Tenerife, Spain
4 Departamento de Astrofísica, Universidad de La Laguna, 38205 La Laguna, Tenerife, Spain
5 Departamento de Física e Astronomía, Faculdade de Ciências, Universidade do Porto, Portugal
6 SUPA, School of Physics and Astronomy, University of St. Andrews, St. Andrews KY16 9SS, UK
Received 28 November 2014/Accepted 14 December 2014
ABSTRACT
Aims.We aim, on the one hand, to study the possible differences of Li abundances between planet hosts and stars without detected
planets at effective temperatures hotter than the Sun, and on the other hand, to explore the Li dip and the evolution of Li at high
metallicities.
Methods.We present lithium abundances for 353 main sequence stars with and without planets in theTeffrange 5900–7200 K. We
observed 265 stars of our sample with HARPS spectrograph during different planets search programs. We observed the remaining
targets with a variety of high-resolution spectrographs. The abundances are derived by a standard local thermodynamic equilibrium analysis using spectral synthesis with the code MOOG and a grid of Kurucz ATLAS9 atmospheres.
Results.We find that hot jupiter host stars within theTeffrange 5900–6300 K show lower Li abundances, by 0.14 dex, than stars
with-out detected planets. This offset has a significance at the level 7σ, pointing to a stronger effect of planet formation on Li abundances
when the planets are more massive and migrate close to the star. However, we also find that the averagevsiniof (a fraction of) stars
with hot jupiters is higher on average than for single stars in the sameTeffregion, suggesting that rotational-induced mixing (and not
the presence of planets) might be the cause for a greater depletion of Li. We confirm that the mass-metallicity dependence of the Li dip
is extended towards [Fe/H]∼0.4 dex (beginning at [Fe/H]∼ −0.4 dex for our stars) and that probably reflects the mass-metallicity
correlation of stars of the sameTeffon the main sequence. We find that for the youngest stars (<1.5 Gyr) around the Li dip, the
deple-tion of Li increases withvsinivalues, as proposed by rotationally-induced depletion models. This suggests that the Li dip consists of
fast rotators at young ages whereas the most Li-depleted old stars show lower rotation rates (probably caused by the spin-down during
their long lifes). We have also explored the Li evolution with [Fe/H] taking advantage of the metal-rich stars included in our sample.
We find that Li abundance reaches its maximum around solar metallicity, but decreases in the most metal-rich stars, as predicted by some models of Li Galactic production.
Key words.stars: abundances – stars: fundamental parameters – stars: rotation – stars: evolution – planets and satellites: formation – planetary systems
1. Introduction
Lithium is one of the most studied chemical elements in the liter-ature. Despite efforts to unveil the mechanisms of production and destruction of this interesting element, there are still some un-solved mysteries. For instance, the disagreement found between
Based on observations collected at the La Silla Observatory, ESO
(Chile), with the HARPS spectrograph at the 3.6 m ESO telescope,
with CORALIE spectrograph at the 1.2 mEulerSwiss telescope and
with the FEROS spectrograph at the 1.52 m ESO telescope; at the Paranal Observatory, ESO (Chile), using the UVES spectrograph at
the VLT/UT2 Kueyen telescope, and with the FIES and SARG
spec-trographs at the 2.5 m NOT and the 3.6 m TNG, respectively, both at La Palma (Canary Islands, Spain).
Tables 3–6 are available in electronic form at
http://www.aanda.org
the abundance of the most metal-poor stars in the Galaxy (the so-called “Spite plateau” withA(Li)1∼2.2, Spite & Spite 1982) and the initial primordial abundance given by the WMAP ob-servations (A(Li)∼2.7, Steigman 2010, Cyburt et al. 2008) is not understood yet. Moreover, the current Galactic Li produc-tion models (e.g.Prantzos 2012) are not able to yield enough Li to explain the meteoritic abundance of 3.31 (Anders & Grevesse 1989) or the maximum Li abundances found in young clusters (e.g.Sestito & Randich 2005). On the other hand, the standard model of Li depletion, which only considers convection (e.g. Deliyannis et al. 1990; Pinsonneault 1997) cannot explain the observed Li abundances in solar-type stars or in mid-F stars that have undergone the Li dip. Furthermore, in previous years a new discussion about the effect of planets on the depletion of Li has
1 A(Li)=log[N(Li)/N(H)]+12.
Table 1.Parameters for each coefficient as resulting from multivariable linear regression analysis in the four tests (PH are planet hosts and CS are the comparison stars).
Sample of planet hosts Number Int. β1 β2 β3 β4 β5 Offset Significance
Jupiter size hosts 87PH & 176CS –64.04 17.81 0.02 –0.18 –0.21 –0.07 6.5σ
Hot jupiter hosts 24PH& 176CS –69.64 19.37 –0.05 –0.24 –0.28 –0.14 7.0σ
Analysis includingvsini
Jupiter size hosts 47PH & 62CS –86.39 23.72 0.06 –0.10 –0.20 –0.12 0.04 2.6σ
Hot jupiter hosts 11PH & 62CS –98.37 27.16 –0.05 –0.29 –0.28 –0.15 0.08 2.1σ
Notes.The offset is only included in the fit for planet hosts since the offset for comparison stars is by definition 0. The last column reflects the
siginificance of the offset found between both samples.
been opened (e.g. Israelian et al. 2009; Ramírez et al. 2012; Gonzalez 2014;Figueira et al. 2014;Delgado Mena et al. 2014, hereafter DM14).
Lithium, as other light elements, can easily be destroyed in stellar interiors by p-αreactions. Although Li depletion oc-curs primarily in the pre-main sequence (PMS), it can also take place in stellar envelopes if there is any extra mixing process. Therefore, Li abundance can provide us important information about the internal structure of stars. In this work we present ho-mogeneous Li abundances for a sample of 353 “hot” stars (early G and F stars) with a wide range of metallicities and ages. We exploit the metal-rich stars in our sample to study the behaviour of the Li dip and the chemical evolution of Li at high metallici-ties. Finally, we also investigate if the presence of planets affect Li abundances for these hotter stars.
Section 2 briefly describes the collected data together with the determination of stellar parameters and abundances of lithium. In Sect. 3 we discuss the results related to different top-ics: the connection of Li abundances with the presence of plan-ets, the behaviour of the Li dip, the chemical evolution of Li at high metallicities, and the Li distribution in the Galactic disks. We summarize in Sect. 4.
2. Observations and analysis
Our baseline sample is 1111 FGK stars observed within the con-text of the HARPS GTO programs. It is a combination of three HARPS subsamples hereafter called HARPS-1 (Mayor et al. 2003), HARPS-2 (Lo Curto et al. 2010), and HARPS-4 (Santos et al. 2011). The individual spectra of each star were reduced using the HARPS pipeline and then combined with IRAF2after correcting for its radial velocity shift. The final spectra have a resolution ofR ∼ 110 000 and high signal-to-noise ratio (55% of the spectra have a S/N higher than 200). The total sample is composed of 135 stars with planets and 976 stars without de-tected planets. For this work, we mainly focus on the hottestTeff (>5900 K) where we have 36 and 229 stars with and without planets, respectively. All the planet hosts and non-hosts stars are listed in Tables3and 4, respectively. To increase the number of stars with planets, we used high-resolution spectra for 88 planet hosts (see Table 5) that come from different observing runs and spectrographs. Table1of DM14 lists those instruments in de-tail. The data reduction was made using the IRAF package or the respective telescopes pipelines. All the images were flat-field corrected, sky substracted, and co-added to obtain 1D spectra. Doppler correction was also done.
2 IRAF is distributed by National Optical Astronomy Observatories,
operated by the Association of Universities for Research in Astronomy, Inc., under contract with the National Science Foundation, USA.
Fig. 1.Lithium abundances vs.Teff for planet host stars (red filled cir-cles) and comparison sample stars (blue open circir-cles) from HARPS to-gether with other planet hosts (green triangles). Down arrows represent
A(Li) upper limits.
The stellar atmospheric parameters were taken fromSousa et al.(2008,2011a,b) for the HARPS samples and fromSantos et al.(2004,2005),Sousa et al. (2006),Mortier et al.(2013), Santos et al.(2013) for the rest of the planet hosts. All the sets of parameters were determined in a homogeneous way. We de-rived lithium abundancesA(Li), stellar masses and ages in the same way as DM14. That work offers further details about the determination of stellar parameters and Li abundances.
The determination of rotational projected velocities (vsini values) was done with a combined Fourier transform and goodness-of-fit methodology using the IACOB program (Simón-Díaz & Herrero 2014). We could only determinevsini for the stars with spectra of S/Ns above∼100.
3. Results and discussion
3.1. General behaviour of Li in F stars
[image:2.595.311.559.221.393.2]Fig. 2.Average ofA(Li), stellar mass, age, and [Fe/H] in sixTeff bins
for all (HARPS+others) the planet host stars (orange filled circles) and
comparison sample stars (blue open circles). The number of stars in each bin is indicated with the respective colour. Only stars with Li de-tections are considered.
and 6200 K, are not so common in studies of clusters or field stars. We would expect these stars to have higher Li abundances unless they are evolved stars from the dip, as suggested byChen et al.(2001). These objects will be further studied in a separate work. Although we do not expect to have evolved stars in our sample we have removed the stars with logg <4.2 since our spectroscopic loggvalues could be overestimated for the hottest stars (Mortier et al. 2014).
3.2. Li and planets
The Li dependence on the presence of planets has been exten-sively discussed in the literature. On the one hand, several in-dependent groups find that planet hosts withTeff close to solar present lower abundances of Li when compared to non-hosts (Israelian et al. 2004, 2009; Takeda & Kawanomoto 2005; Chen & Zhao 2006;Gonzalez 2008,2014;Takeda et al. 2010; Gonzalez et al. 2010; Sousa et al. 2010;Delgado Mena et al. 2014;Figueira et al. 2014). On the other hand, other authors do not find such a dependence (Ryan 2000;Luck & Heiter 2006; Baumann et al. 2010;Ghezzi et al. 2010;Ramírez et al. 2012). Gonzalez(2008) proposed that stars with planets around 6100 K show higher Li abundances than stars without detected planets. After increasing the sample size, however, the same author dis-carded this effect and presented weak evidence that planet hosts atTeff∼6100–6200 K are deficient in Li compared to stars with-out detected planets (Gonzalez 2014,2015). Visually we cannot pinpoint any strong difference in the Li abundance detections be-tween stars with and without planets in Fig.1. However it is very clear that in theTeffrange between 5900 K and 6300 K there are relatively more non-hosts with upper limits in Li abundances. This feature was also pointed out byRamírez et al.(2012).
In Fig.2we compile the average values of Li abundance de-tections and other parameters for stars with and without detected
planets (in bins of 100 K). Since Li abundances depend on sev-eral parameters (e.g.Teff, [Fe/H], age) one should be cautious when comparing stars and construct the least biased possible samples (for a further discussion see DM14). For example, in all these subsamples except the hottest one, planet hosts are younger and also on average more metal rich, as expected (e.g.Santos et al. 2004). Nevertheless, this difference in parameters does not seem to affect the degree of Li depletion too much (see Sect.3.4), except maybe in theTeff range 6300–6400 K where we observe the highest difference in Li. For the rest of the subamples, the av-erage values of stars with and without planets are quite similar and within the errors.
To remove the effect of different stellar parameters when comparing Li abundances, we apply a multivariate regression fit to the planet host sample and the comparison sample as done in Figueira et al.(2014):
log(A(Li)) = int.+β1log (Teff)+β2[Fe/H]+β3logg (1)
+β4log(Age)+M×offset.
In both samples, we assumed the same linear dependence of Li on stellar parameters but allow an offset for the planet host sam-ple, which is,M =0 for the comparison sample andM=1 for the planet host sample. By doing so, we ensure that a possible difference in Li abundance is not due to different stellar parame-ters. For this calculation we consider all our stars with 5900 K< Teff < 6300 K and Li detections (we exclude the upper lim-its), 87 planet hosts (with Jupiter type planets:MP ≥ 0.1 MJ) and 176 comparison stars. We chose to cut atTeff =6300 K to allow for a fair comparison with theGonzalez(2015) sample. Moreover, that is roughly the temperature at which the Li dip begins to develop and it would be difficult to distinguish a pos-sible effect of planets on Li abundances from other depletion mechanisms.
The results are shown in Table 1. As expected, the strongest dependence lies onTeff, while it is very small for the other pa-rameters. We find that the planet host sample shows a deple-tion of 0.07 dex with respect to non-hosts. Although this offset is significant (at 6.5σlevel), its significance is naturally heav-ily dependent on the error bars. If we artificially increase the error bars by a factor of 2 or 3 the significance drops to 3.3σ and 2.2σ, respectively. This offset agrees with the results by Gonzalez(2015) though it is very small and at the level of the uncertainties3. Therefore, it seems that the effect of giant plan-ets observed for solar analogues is not obvious for hotter stars, probably because of their shallower convective envelopes. As explained in DM14, the effect of planets on Li abundances is expected to be higher for more massive planets (stronger effect on rotational history, Bouvier 2008), and for planets that migrate (more violent accretion bursts, Baraffe & Chabrier 2010). Thus, we explore the behaviour of stars hosting hot jupiters since these planets are massive and some theories of planet formation pre-dict a migration close to the star (e.g.Alibert et al. 2005). Then, we repeat our previous calculation, instead using as planet host sample only those stars that host planets withM >0.1MJand P<5 days. In this case we find a higher offset than before,−0.14 dex, with a significance level of 7σ. As before, we increase the error bars by a factor of 2 and 3, which drops the significance to 3.6σand 2.4σ, respectively. We note that our sample of hot jupiter hosts is small (24 stars with 5900 K<Teff<6300 K), but this is an interesting result that deserves to be explored further in the future.
Fig. 3.Lithium abundances vs. stellar mass in 12 metallicity bins for all our stars with logg >4.2. Downward triangles represent A(Li) upper limits. The ages are depicted by a colour scale.
Finally, we investigate the possible effect of rotation on Li abundances for our sample of planet hosts. The models of rotationally-induced mixing predict that during the main se-quence (MS), stars with higher rotation rates are expected to de-plete more Li than slower rotators. We find that the averagevsini for hot jupiter hosts in thisTeffrange is larger, 5 km s−1(derived only for 11 stars) than for the comparison stars, 3.1 km s−1 (derived for 62 stars), hence this could explain the offset pre-viously found for stars with hot jupiters. In order to test this ef-fect, we repeat the same analysis as before except we include the vsiniin the equation and force a same dependence on it both for the planet host sample and in the comparison stars sample log(A(Li)) = int.+β1log (Teff)+β2[Fe/H]+β3logg (2)
+β4log(Age)+β5vsini+M×offset.
The results are shown in the second part of Table 1. As expected from the models of rotationally-induced mixing, Li abundances show a negative dependence onvsini. The offsets are now posi-tive (i.e. higher Li abundances for planet hosts) but they are also much less significant than before (2.6σand 2.1σ, for the jupiter size planets and the hot jupiters, respectively). This result points to an effect of rotation on Li abundances though we have to be cautious since our sample of measuredvsinivalues is very small and potentially biased (we could only measurevsiniin 42% of our stars with Li detections in thisTeff range).
3.3. The Li dip: dependence on metallicity, age and v sin i
The Li dip was first discovered in the Hyades by Boesgaard & Tripicco (1986). For clusters younger than the Pleaides (∼200 Myr) this feature is not observed and stars more massive than a solar mass show a constant maximum value ofA(Li)= 3–3.2 dex (Lambert & Reddy 2004). Therefore, the Li dip has to be formed during the MS. Indeed, the maximum Li abundance is similar for the youngest clusters as for the slightly older clusters (300 Myr–2 Gyr), hence, F stars in the MS experience very little depletion up to ages of 1 Gyr. For older clusters there are hints of the presence of the dip though there is not always a significant number of stars at those temperatures. The Li dip is not well de-fined in Fig.1because in our sample there are stars of different ages and metallicities. To appreciate a clearly shaped Li dip one should divide the stars by ranges with similar [Fe/H] and age, as happens in open clusters.
main sequence (ZAMS)Teff does not. Later studies on clusters (e.g.Cummings et al. 2012;François et al. 2013) or field stars (e.g.Lambert & Reddy 2004) have confirmed this feature. For example in the [Fe/H] range [–0.6,–0.5], we have a unique star at the Li dip with a mass of 1.02M. This agrees with the Li dip centre of 1.06Mfound by (François et al. 2013) in a similar metallicity cluster, NGC 2243 with [Fe/H]=−0.54 dex. By con-trast, at higher metallicities we find two stars with 1.3 and 1.4M
in the Li dip, which compares well with the mass of the cool side of Li dip in NGC 6253 (1.34M, [Fe/H]=0.43 dex, Cummings et al. 2012). In that work they also compare their results with the Hyades, which has a Li dip mass of 1.27M. In our field stars of similar metallicity (0.1–0.2 dex), the Li dip seems to be at∼1.3M. From Fig.3 we can see that the increase of mass with metallicity not only happens for the Li dip stars but for all the objects within each metallicity bin, therefore this is just a reflection of the mass-metallicity correlation for stars with simi-larTeff in the MS and confirms the suggestion byBalachandran (1995).
In Fig.3we also show the ages of the stars by a colour scale. For the more metal-poor bins we cannot observe the Li dip be-cause our MS stars are too old and thus too cool to be suscep-tible to that process. For instance, for older clusters like M67 the Li dip is formed by subgiants. We have cleaned our sample of possible evolved stars so the hotter stars that usually form the Li dip have to be young enough and not evolved yet. In fact, if we observe the Li dip at different metallicities it is always formed by stars younger than∼4 Gyr, with the age slightly decreasing as the metallicity increases.
Several mechanisms have been proposed to explain the for-mation of the Li dip, such as mass loss (Schramm et al. 1990), diffusion, and radiative acceleration (Richer & Michaud 1993), or rotationally induced mixing (Zahn 1992;Pinsonneault et al. 1990). Under the assumption of this last mechanism, stars that rotate faster in the MS will experience more rapid mixing (thus, more Li depletion) than slow rotators at the same mass (Pinsonneault 1997). In principle, this seems to be at odds with the work by Bouvier (2008), where the slow rotators on the ZAMS suffer a stronger depletion of Li than fast rotators, and with the higher Li abundances found in rapidly rotating stars as compared with slow rotators of the same mass in the Pleiades (Soderblom et al. 1993;Garcia Lopez et al. 1994) or IC 2602 (Randich et al. 1997). However, at this point one has to be careful distinguishing between the depletion mechanisms acting during the MS and the PMS (e.g.Somers & Pinsonneault 2014) and be-tween the current rotation rates and those in the ZAMS, though a priori one could expect that a star with a current high veloc-ity was also a fast rotator in the past. Nevertheless, it is difficult to estimate the initial rotation velocity since stars usually spin down when arriving at the MS. Therefore we have to extract in-formation from the current surface rotation rates. Moreover, for most of the stars, we do not know their inclination so we can only measure the projected rotational velocity,vsini, given that we have a good quality spectrum.
[image:5.595.310.554.73.418.2]To check for the possible impact of rotation, we compare the vsinivalues of the stars that typically form the Li gap (which we define in the range 6280 K <Teff <6550 K, see Fig.4). We note that in this plot the number of stars is lower since we were able to determinevsinifor only 20 out of 50 stars in this Teff range. To increase the statistics we included 12 fast rotators within the same Teff range analysed in Tsantaki et al. (2014), (see Table2). For those stars the stellar parameters are derived using the spectral synthesis technique for FGK stars and are in agreement with the results of the EW method. In addition,
Fig. 4.Lithium abundances vs.vsiniaround the Li dip for all our stars (filled circles and triangles). Open circles and triangles (upper limits)
represent the fast rotators fromTsantaki et al.(2014). In each panel a
colour scale shows the ages, metallicities, and masses of the stars.
the comparison ofvsini from the spectral synthesis technique mentioned above and our method shows a good agreement. The Li abundances for those 12 objects were derived in the same way as in this work. Therefore, the addition of the extra stars in Fig.4 guarantees a uniform comparison.
Table 2.Li abundances for the fast rotators of Sect. 3.3.
Star Teff logg [Fe/H] Age Mass vsini A(Li)
(K) (cm s−2) (Gyr) (M
) (km s−1)
HD 142860 6361 4.07 –0.09 2.89 1.21 10.65 2.32
HD 89569 6469 4.08 0.09 2.14 1.41 11.33 <1.90
HD 86264 6300 4.06 0.25 2.19 1.39 12.55 1.50
HD 210302 6405 4.24 0.10 1.50 1.29 13.68 2.42
WASP-3 6423 4.42 0.04 0.93 1.27 15.21 2.60
HD 30652 6494 4.29 0.04 0.84 1.29 17.01 2.25
30AriB 6284 4.35 0.12 2.55 1.32 42.61 2.72
HAT-P-41 6479 4.39 0.13 1.05 1.35 20.11 <1.70
HAT-P-2 6414 4.18 0.04 1.91 1.30 20.50 <1.00
HAT-P-34 6509 4.24 0.08 1.17 1.35 24.08 <1.50
HD 8673 6472 4.27 0.14 0.55 1.24 26.91 1.50
CoRoT-11 6343 4.27 0.04 1.58 1.28 36.72 2.10
Notes.Stellar parameters fromTsantaki et al.(2014).
We checked whether the lack of stars withvsini determina-tion and Li upper limits could be biasing this effect. We could not determinevsinivalues for nine stars (with Li upper limit), but only one out of those is young (WASP-32, 0.7 Gyr) and seems to be a slow rotator when we observe its spectrum. Thus, this is the only young star in our sample belonging to the dip with a low rotation rate. In any case, the small number of stars in this subsample suggests this result should be viewed with caution. Moreover, the rotational models predict a correlation between the rotation history of the star and Li depletion, rather than a correlation between the current rotation and the Li abundance (Pinsonneault 1997). There is another group of five fast rotators within the samevsinirange (10–30 km s−1), forming a lower en-velope for Li abundances, probably related to their greater ages. We note that these are the only stars with logg <4.2 in Fig.4 and we cannot rule out the possibility that they are subgiants. Curiously, for the two objects with the highestvsini the trend changes, showing a higher Li abundance despite being older. We should consider this rise in Li abundance with caution since the determination of parameters becomes more difficult for the fastest rotators and the errors are three times larger than for the non-rotating counterparts.
3.4. Li evolution: dependence on [Fe/H] and age
To extract information about the evolution of Li through the life of the galaxy, it is very common to evaluate its behaviour with the metallicity. The well-known “Spite plateau” shows how the abundances of Li are nearly constant at [Fe/H]<∼ −1 dex while they increase as [Fe/H] increases. However, the available studies of clusters and field stars do not include very metal-rich stars with the exception of the recently analyzed cluster NGC 6253 (Cummings et al. 2012) with [Fe/H]=0.43 dex. We note that a lower metallicity ([Fe/H]=0.23 dex) has been obtained for this cluster by other authors (Montalto et al. 2012). Our sample of metal-rich planet hosts represents a good opportunity to check how the Li abundances behave at [Fe/H]>0.2 dex.
In Fig.5we show the mean values of Li, stellar mass,Teff, and age for the six stars with the highest Li abundance in each bin of metallicity. We chose this number of stars per bin to com-pare our results with the values obtained byLambert & Reddy (2004) with a similar approach, who reported a good agree-ment with the maximum values found in open clusters of sim-ilar metallicity. We should consider the most metal-poor bins ([Fe/H]<−0.7 dex) with caution since we only have one or two
Fig. 5.Upper panel: maximum and mean values of Li in different licity bins for the six stars with the highest Li abundance in each
metal-licity bin (with logg >4.2). The circles are the values from this work
and the triangles denote the values fromLambert & Reddy (2004).
Remaining panels: mean values of mass,Teff, and age for those six stars in each metallicity bin.
stars per bin and their temperatures fall out of the main trend. We compared our parameters with those derived byCasagrande et al.(2011) for these metal-poor stars and they agree well except for the most metal-poor star (HD 31128) for whichCasagrande et al.(2011) gives a higher age, 8.26 Gyr.
[image:6.595.309.558.274.594.2]metallicity? First, we can expect the more metallic stars to re-tain more of their initial Li because their masses are increasing (and thus the convective envelopes become shallower). Second, metal-rich stars are younger so they have less time to deplete their Li as observed in younger clusters (e.g.Sestito & Randich 2005). Finally, the models of Li production point to an increase of Li with time in the interstellar medium (e.g.Fields & Olive 1999;Prantzos 2012).
By contrast, for metallicities higher than solar, Li abun-dances seem to flatten and even decrease for the most metal-rich stars. As expected, the age decreases as [Fe/H] increases to reach a plateau for the most Li rich stars, where the age is be-tween 1–2 Gyr. The maximum Li abundance,A(Li)=3.39, is found at solar metallicity, which coincides with the minimum in age. We note here that this value corresponds to WASP-66, a very young and hot star (Teff =7051 K) compared with the averageTeff in our sample, hence the rise in averageTeff shown in the third panel of Fig.5. That value also matches the maxi-mum Li abundances found in young clusters such as NGC 2264 (Sestito & Randich 2005) and is very similar to the meteoritic abundance. Therefore it is possible that this represents the initial maximum Li abundance and those stars have not experienced any astration.
The standard model predicts that Li depletion is faster for more metallic stars since they have deeper convective zones. This is in contrast with the higher Li abundances found for the metal-rich stars. However, the models of Galactic Li produc-tion predict that initial Li abundance in a star becomes higher as the Galaxy evolves, i.e. as [Fe/H] increases. Indeed, the high Li abundances found in meteorites or in young clusters require Galactic production to increase the primordial Li abundance (either∼2.2, from “Spite plateau” or∼2.7 from WMAP observa-tions). The flattening observed at high [Fe/H] is possibly a bal-ance between the higher initial Li in those stars (due to a larger content of Li in the interstellar medium), and a stronger destruc-tion of Li due to the deepening of stellar convective zones. This possibility is suggested by the models ofFields & Olive(1999) who show that at super-solar metallicities the stellar Li depletion begins to affect the Li abundance in the inter-stellar medium, and thus flattening the correlation of initial Li and Fe. Therefore, in this scenario, we may think that the stars around solar metallicity represent the maximum Li in the Galaxy, which is similar to the initial value (and to the meteoritic value) since they are young and have not depleted it yet. As you move to super-solar metal-licities the effect reverses and the high [Fe/H] begins to produce Li depletion. However, we should also note, as shown in Fig.5, that theTeffis also decreasing as [Fe/H] increases, therefore the convective envelope is getting deeper4and probably affecting the depletion of Li.
The question remains how we can distinguish between a lower abundance of Li due to a lower initial abundance ([Fe/H] effect on Galactic production) or due to internal destruction dur-ing the MS (Teffeffect). In an attempt to disentangle both effects, we constructed samples of stars with different mass ranges but with 6000 K <Teff <6200 K, as shown in Fig. 6. We chose thisTeff range because it is well populated with stars of diff er-ent masses and metallicities. As expected, we cannot observe the stars with the highest Li abundance since we are not using the hottest stars. By restricting the sample, now the averageTeff, mass, and age of the stars are very similar in all the bins at 4 Pinsonneault et al.(2001) show thatT
eff is the main parameter
de-termining the mass of convective envelopes with a very small effect of
[image:7.595.310.558.75.384.2]metallicity.
Fig. 6.Upper panel: maximum and mean values of Li in different metal-licity bins for the six stars (when available) with the highest Li
abun-dance in each metallicity bin (with 6000 K < Teff < 6200 K and
logg >4.2).Remaining panels: mean values of mass,Teff, and age for those six stars in each metallicity bin.
super-solar metallicities, thus the observed variation of Li abun-dances should be triggered basically by the metallicity variation. We still observe the increase of Li with [Fe/H], with a maximum at [Fe/H]= 0.15 dex and a clear decrease for the subsamples between 1Mand 1.3M(the most populated subsamples, des-ignated by purple and blue symbols in Fig.6). We evaluated the possible effect of planets on Li evolution, since as suggested be-fore, planet hosts seem to have depleted more Li and our most metal-rich bins contain many of them. Thus, we reconstructed the samples between 1 M and 1.3 M with only comparison stars and we found that the behaviour is similar, i.e. Li decreases for the most metal-rich stars from [Fe/H]∼0.15 dex. Therefore, the lowest Li abundances found in the most metal-rich stars seem to be caused by a lower initial Li as predicted by some models of Galactic production (Fields & Olive 1999).
Fig. 7.Li abundances a function of age in severalTeffregions. The metallicity values are shown with a colour scale.
upper limits). For stars of solar metallicity (green points) the dispersion reaches 0.4 dex for stars of similar age. We find a similar spread in otherTeff and [Fe/H] regions and the disper-sion can reach values of 2 dex if we consider the upper limits. This fact reveals that an extra parameter is governing Li deple-tion. We may note here that when dealing with MS stars, the age determination is probably very uncertain (e.g.Jørgensen & Lindegren 2005), at least significantly more uncertain than other stellar parameters determination. Therefore, it might be possible that these stars of apparently same age could have quite different ages and that could be the reason of the spread in abundances. For instance, in clusters like the Hyades or NGC 6243 the spread around 6000 K is quite small (Cummings et al. 2012). In con-trast, M67 or Praesepe show a huge dispersion in Li abundances (Sestito & Randich 2005).
3.5. Li in the Galactic disks
The recent work byRamírez et al.(2012) presented a first at-tempt to compare Li abundances in the two Galactic disks. They found that the Li abundances for the thin disk stars (using a kinematical separation criteria) increase with metallicity, while for the thick disk stars the abundances have a nearly con-stant maximum value ofA(Li)∼2.1 dex, similar to the “Spite plateau”. However, once they cleaned their thin disk sample of the youngest and more massive stars, to allow for a less biased comparison with the older and cooler thick disk, they found a smoother transition from the thick to the thin disk.
In Fig.8we present a plot, similar to Fig. 5. inRamírez et al. (2012), using only the stars of the HARPS samples analyzed in Adibekyan et al.(2012). We note that we have removed planet hosts for this section since they only represent∼10% of the to-tal sample and their abundances might be affected by the pres-ence of planets (at least in the solarTeffregion). To improve the comparison we added a set of cool stars (Teff<5600 K) belong-ing to the HARPS samples (see Table 6). We used both kine-matic5 and chemical criteria to separate the stellar populations
5 The kinematic separation was done using the prescription ofBensby
et al.(2003) as presented inAdibekyan et al.(2012).
Fig. 8.Li abundances as a function of metallicity for the HARPS non-host stars. Thin disk stars are depicted with blue symbols while thick disk stars are denoted with red symbols. Downward triangles are upper limits on Li. The separation of the Galactic populations are based on
the abundances (top) and kinematics (bottom). The constraint on age is
only applied for the thin disk stars, as inRamírez et al.(2012).
(seeAdibekyan et al. 2011,2012, for details). We note that stars with [Fe/H]>−0.2 dex and showing enhancement inα-element abundances were classified as members of a high-αmetal-rich population inAdibekyan et al. (2011,2013). Here we use the same symbol as for the thick disk stars to compare with the re-sults ofRamírez et al.(2012) more easily.
[image:8.595.316.552.337.601.2]mentioned work and reflecting the evolution of Li at high metal-licities discussed in the previous section. However, our thick disk stars also show a decrease of Li with metallicity from [Fe/H]>−0.5 dex, whereas inRamírez et al.(2012) the thick disk stars present a constant value close to the “Spite plateau” up to [Fe/H]∼ −0.1 dex. Furthermore, this decrease seems steeper for the thick disk stars than for the thin disk stars. The lack of Li-rich metal-rich thick disk stars in our sample when compared to that observed inRamírez et al.(2012) can probably be ex-plained by the different criteria used to separate the stellar pop-ulations. However, both our kinematic and chemical separation shows the same picture. We should note that our kinematic cri-teria suggest very few thick disk stars with [Fe/H]>−0.3 dex, while in the sample ofRamírez et al.(2012) this metallicity re-gion is quite abundant of thick disk stars. A more detailed anal-ysis of their metal-rich Li-rich thick disk stars is needed to un-derstand the nature of these stars and the reason for the observed discrepancy.
4. Summary
We present new Li abundances for a total sample of 36 planet hosts and 229 stars without detected giant planets in the HARPS GTO samples, together with 88 additional extrasolar planet hosts from other sources. All these stars span over an effective tem-perature range 5900 K < Teff < 7200 K. First, we find that planet hosts show an extra depletion of 0.07 dex in the Teff range 5900–6300 K as previously claimed byGonzalez(2015). This offset is statistically significant but close to the average un-certainties of Li abundances. However, this offset seems to be stronger for stars hosting hot jupiters (0.14 dex), something that could be explained by some models where the effect of planets on Li depletion is related with their mass and migration. This issue should be explored in the future with a larger sample of hot jupiters than the current sample of 24 stars analyzed here. In contrast, if we include the Li dependence on vsini in our multivariate regression fit, the offset in Li abundance between the planet hosts and the comparison stars becomes positive but also decreases and becomes insignificant. This suggests that the difference in vsinibetween both samples was causing the dif-ference in Li abundances. Nevertheless, the number of stars for which we can derivevsiniis still too low to enable us to reach a conclusion regarding the effect of rotation on Li abundances for our sample of planet hosts.
We study the position of stellar mass of the Li dip at several metallicity bins. We confirm that the mass of the Li dip increases with the metallicity and extend this relation up to [Fe/H] = 0.4 dex. However, the mass of all the stars in our sample in-creases with metallicity, thus reflecting the mass-metallicity re-lation for dwarfs of the same temperature and supporting the idea of a constantTefffor the Li dip. We also evaluate the behaviour of Li abundances withvsinifor the stars that surround the dip. We find that for the younger objects (<∼1.5 Gyr), a strong deple-tion of Li only happens for fast rotators (>∼10 km s−1), suggesting that the Li dip is formed due to rotationally induced mixing at early stages of the MS. However, for the older objects the Li dip is formed by slower rotators, making it impossible to diff eren-tiate between the previously mentioned mechanism (we do not know if those stars were fast rotators at younger ages) or other depletion processes taking place during the MS.
Finally we analyze the Li evolution with the metallicity (i.e. the age of the Galaxy) since our metal-rich sample represents a good opportunity to check the behaviour of Li at super-solar
metallicities, which is not well studied in the literature. As ex-pected from models of Galactic production of Li, we observe an increase of Li abundances as the Galaxy evolves, i.e. as the metallicity increases. We find the maximum abundance around [Fe/H]∼0.1 dex, with A(Li) =3.39 dex, which is similar to the meteoritic value and the maximum Li abundances found in young clusters such as NGC 2264 (Sestito & Randich 2005). That said, Li abundances flatten and even decrease for the most metal-rich stars. This is in agreement with the models ofFields & Olive(1999) which suggest that the initial Li abundance of the most metal-rich stars is lower because the interstellar Li abun-dances have decreased due to the impact of stellar depletion dur-ing the evolution of the Galaxy. We also study the behaviour of Li in the context of thin and thick disks. We find a clear decrease of Li abundances at super-solar metallicities for the thin disk and a steeper decrease for thick disk stars that starts at [Fe/H]>−0.5 dex.
Acknowledgements. E.D.M., S.G.S. and V.Zh.A. acknowledge support
from the Fundação para a Ciência e Tecnologia, FCT (Portugal) in the form of grants SFRH/BPD/76606/2011, SFRH/BPD/47611/2008, and SFRH/BPD/70574/2010, respectively. P.F. acknowledges support by Fundação para a Ciência e a Tecnologia (Portugal) through Investigador FCT contracts of reference IF/01037/2013 and POPH/FSE (EC) by FEDER funding through the program “Programa Operacional de Factores de Competitividade – COMPETE”. J.I.G.H. acknowledges support from the Spanish Ministry of Economy and Competitiveness (MINECO) under the 2011 Severo Ochoa Program MINECO SEV-2011-0187. N.C.S., A.M., and M.T. acknowledge support from the European Research Council/European Community under the FP7 through Starting Grant agreement number 239953, as well as support through programme Ciência 2007 funded by FCT/MCTES (Portugal) and POPH/FSE (EC), and in the form of grant PTDC/CTE-AST/098528/2008. A.M. is supported by the European Union Seventh Framework Programme (FP7/2007-2013) through grant agreement number 313014 (ETAEARTH). This research made use of the SIMBAD database operated at CDS, Strasbourg (France) and the Encyclopaedia of Extrasolar Planets. This work also made use of the IRAF facility.
References
Adibekyan, V. Z., Santos, N. C., Sousa, S. G., & Israelian, G. 2011,A&A, 535, L11
Adibekyan, V. Z., Sousa, S. G., Santos, N. C., et al. 2012,A&A, 545, A32 Adibekyan, V. Z., Figueira, P., Santos, N. C., et al. 2013,A&A, 554, A44 Alibert, Y., Mordasini, C., Benz, W., & Winisdoerffer, C. 2005,A&A, 434, 343 Ammler-von Eiff, M., Santos, N. C., Sousa, S. G., et al. 2009,A&A, 507, 523 Anders, E., & Grevesse, N. 1989,Geochim. Cosmochim. Acta, 53, 197 Balachandran, S. 1995,ApJ, 446, 203
Baumann, P., Ramírez, I., Meléndez, J., Asplund, M., & Lind, K. 2010,A&A, 519, A87
Bensby, T., Feltzing, S., & Lundström, I. 2003,A&A, 410, 527 Boesgaard, A. M., & Tripicco, M. J. 1986,ApJ, 302, L49
Bonomo, A. S., Hébrard, G., Santerne, A., et al. 2012,A&A, 538, A96 Bouvier, J. 2008,A&A, 489, L53
Casagrande, L., Schönrich, R., Asplund, M., et al. 2011,A&A, 530, A138 Charbonnel, C., & Talon, S. 2005,Science, 309, 2189
Chen, Y. Q., & Zhao, G. 2006,AJ, 131, 1816
Chen, Y. Q., Nissen, P. E., Benoni, T., & Zhao, G. 2001,A&A, 371, 943 Cummings, J. D., Deliyannis, C. P., Anthony-Twarog, B., Twarog, B., &
Maderak, R. M. 2012,AJ, 144, 137
da Silva, R., Udry, S., Bouchy, F., et al. 2007,A&A, 473, 323
Delgado Mena, E., Israelian, G., González Hernández, J. I., et al. 2014,A&A, 562, A92
Deliyannis, C. P., Demarque, P., & Kawaler, S. D. 1990,ApJS, 73, 21 Fields, B. D., & Olive, K. A. 1999,ApJ, 516, 797
Figueira, P., Faria, J. P., Delgado-Mena, E., et al. 2014,A&A, 570, A21 François, P., Pasquini, L., Biazzo, K., Bonifacio, P., & Palsa, R. 2013,A&A, 552,
A136
Garcia Lopez, R. J., Rebolo, R., & Martin, E. L. 1994,A&A, 282, 518 Ghezzi, L., Cunha, K., Smith, V. V., & de la Reza, R. 2010,ApJ, 724, 154 Gonzalez, G. 2008,MNRAS, 386, 928
Gonzalez, G. 2015,MNRAS, 446, 1020
Gonzalez, G., Carlson, M. K., & Tobin, R. W. 2010,MNRAS, 403, 1368 Israelian, G., Santos, N. C., Mayor, M., & Rebolo, R. 2004,A&A, 414, 601 Israelian, G., Delgado Mena, E., Santos, N. C., et al. 2009,Nature, 462, 189 Jørgensen, B. R., & Lindegren, L. 2005,A&A, 436, 127
Lambert, D. L., & Reddy, B. E. 2004,MNRAS, 349, 757 Lo Curto, G., Mayor, M., Benz, W., et al. 2010,A&A, 512, A48 Luck, R. E., & Heiter, U. 2006,AJ, 131, 3069
Mayor, M., Pepe, F., Queloz, D., et al. 2003,The Messenger, 114, 20
Molenda- ˙Zakowicz, J., Sousa, S. G., Frasca, A., et al. 2013,MNRAS, 434, 1422 Montalto, M., Santos, N. C., Villanova, S., et al. 2012,MNRAS, 423, 3039 Mortier, A., Santos, N. C., Sousa, S. G., et al. 2013,A&A, 558, A106 Mortier, A., Sousa, S. G., Adibekyan, V. Z., Brandão, I. M., & Santos, N. C.
2014,A&A, 572, A95
Moutou, C., Loeillet, B., Bouchy, F., et al. 2006,A&A, 458, 327 Pinsonneault, M. 1997,ARA&A, 35, 557
Pinsonneault, M. H., Kawaler, S. D., & Demarque, P. 1990,ApJS, 74, 501 Pinsonneault, M. H., DePoy, D. L., & Coffee, M. 2001,ApJ, 556, L59 Pont, F., Tamuz, O., Udalski, A., et al. 2008,A&A, 487, 749 Prantzos, N. 2012,A&A, 542, A67
Ramírez, I., Fish, J. R., Lambert, D. L., & Allende Prieto, C. 2012,ApJ, 756, 46 Randich, S., Aharpour, N., Pallavicini, R., Prosser, C. F., & Stauffer, J. R. 1997,
A&A, 323, 86
Richer, J., & Michaud, G. 1993,ApJ, 416, 312
Ryan, S. G. 2000,MNRAS, 316, L35
Santos, N. C., Israelian, G., & Mayor, M. 2004,A&A, 415, 1153 Santos, N. C., Israelian, G., Mayor, M., et al. 2005,A&A, 437, 1127 Santos, N. C., Ecuvillon, A., Israelian, G., et al. 2006,A&A, 458, 997 Santos, N. C., Mayor, M., Bonfils, X., et al. 2011,A&A, 526, A112 Santos, N. C., Sousa, S. G., Mortier, A., et al. 2013,A&A, 556, A150 Schramm, D. N., Steigman, G., & Dearborn, D. S. P. 1990,ApJ, 359, L55 Sestito, P., & Randich, S. 2005,A&A, 442, 615
Simón-Díaz, S., & Herrero, A. 2014,A&A, 562, A135
Soderblom, D. R., Jones, B. F., Balachandran, S., et al. 1993,AJ, 106, 1059 Somers, G., & Pinsonneault, M. H. 2014 [arXiv:1410.4238]
Sousa, S. G., Santos, N. C., Israelian, G., Mayor, M., & Monteiro, M. J. P. F. G. 2006,A&A, 458, 873
Sousa, S. G., Santos, N. C., Mayor, M., et al. 2008,A&A, 487, 373
Sousa, S. G., Fernandes, J., Israelian, G., & Santos, N. C. 2010,A&A, 512, L5 Sousa, S. G., Santos, N. C., Israelian, G., et al. 2011a,A&A, 526, A99 Sousa, S. G., Santos, N. C., Israelian, G., Mayor, M., & Udry, S. 2011b,A&A,
533, A141
Takeda, Y., & Kawanomoto, S. 2005,PASJ, 57, 45
Takeda, Y., Honda, S., Kawanomoto, S., Ando, H., & Sakurai, T. 2010,A&A, 515, A93
Tsantaki, M., Sousa, S. G., Santos, N. C., et al. 2014,A&A, 570, A80 Udalski, A., Pont, F., Naef, D., et al. 2008,A&A, 482, 299
Zahn, J.-P. 1992,A&A, 265, 115
Table 3.Li abundances for stars with planets from HARPS GTO samples.
Star Teff logg ξt [Fe/H] Age Mass A(Li) Error vsini Hot jupiter
(K) (cm s−2) (km s−1) (Gyr) (M
) (km s−1)
HD 142 6403 4.62 1.74 0.09 1.08 1.27 2.92 0.04 9.34 no
HD 10647 6218 4.62 1.22 0.00 0.26 1.16 2.80 0.03 5.30 no
HD 17051 6227 4.53 1.29 0.19 0.17 1.21 2.57 0.05 5.56 no
HD 19994 6289 4.48 1.72 0.24 2.14 1.34 2.04 0.07 8.15 no
HD 23079 5980 4.48 1.12 –0.12 6.12 1.00 2.16 0.04 2.96 no
HD 39091 6003 4.42 1.12 0.09 2.07 1.11 2.34 0.04 2.96 no
HD 52265 6136 4.36 1.32 0.21 1.04 1.20 2.83 0.05 – no
HD 75289 6161 4.37 1.29 0.30 0.68 1.21 2.83 0.04 4.30 no
HD 82943 5989 4.43 1.10 0.26 0.90 1.15 2.46 0.04 2.75 no
HD 108147 6260 4.47 1.30 0.18 0.37 1.23 2.32 0.03 5.85 no
HD 117618 5990 4.41 1.13 0.03 4.00 1.08 2.24 0.03 3.67 no
HD 121504 6022 4.49 1.12 0.14 1.30 1.14 2.56 0.03 3.61 no
HD 169830 6361 4.21 1.56 0.18 2.04 1.39 <1.10 – 3.49 no
HD 179949 6287 4.54 1.36 0.21 0.24 1.24 2.54 0.04 6.84 yes
HD 196050 5917 4.32 1.21 0.23 3.91 1.12 2.16 0.03 3.34 no
HD 208487 6146 4.48 1.24 0.08 0.82 1.17 2.70 0.04 4.01 no
HD 209458 6118 4.50 1.21 0.03 1.19 1.13 2.73 0.05 – yes
HD 212301 6271 4.55 1.29 0.18 0.35 1.24 2.76 0.04 5.76 yes
HD 213240 5982 4.27 1.25 0.14 4.01 1.19 2.49 0.05 3.50 no
HD 216435 6008 4.20 1.34 0.24 3.41 1.28 2.67 0.04 5.13 no
HD 221287 6374 4.62 1.29 0.04 0.33 1.22 2.97 0.04 4.77 no
HD 7449 6024 4.51 1.11 –0.11 1.77 1.06 2.52 0.03 3.51 no
HD 10180 5911 4.39 1.11 0.08 4.55 1.06 1.82 0.03 2.80 no
HD 93385 5977 4.42 1.14 0.02 3.56 1.07 2.20 0.03 2.99 no
HD 134060 5966 4.43 1.10 0.14 1.75 1.12 2.06 0.04 3.21 no
HARPS-4
HD 190984 6007 4.02 1.58 –0.49 4.60 1.16 <0.50 – 3.23 no
HARPS-2
HD 125612 5913 4.43 1.02 0.24 1.39 1.10 2.50 0.05 – no
HD 145377 6054 4.53 1.11 0.12 1.25 1.12 2.33 0.04 3.76 no
HD 148156 6251 4.51 1.36 0.25 0.60 1.21 2.93 0.02 5.41 no
HD 153950 6074 4.39 1.23 –0.01 4.34 1.12 2.58 0.04 3.41 no
HD 156411 5910 3.99 1.31 –0.11 4.21 1.25 <0.30 – 3.34 no
HD 217786 5966 4.35 1.12 –0.14 7.65 1.02 2.16 0.07 – no
HD 25171 6160 4.43 1.22 –0.11 4.13 1.09 2.55 0.06 – no
HD 72659 5926 4.24 1.13 –0.02 6.29 1.06 2.25 0.07 – no
HD 8535 6158 4.42 1.25 0.04 1.76 1.15 2.65 0.03 3.07 no
HD 9578 6055 4.52 1.07 0.11 1.30 1.12 2.74 0.04 2.36 no
Notes.Parameters fromSousa et al.(2008,2011a,b).
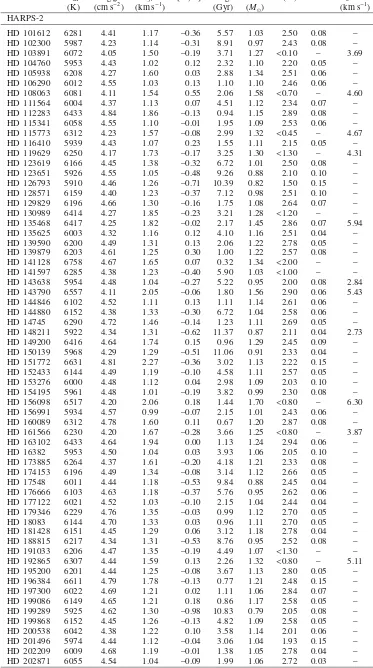
Table 4.Li abundances for stars without detected planets from HARPS GTO samples.
Star Teff logg ξt [Fe/H] Age Mass A(Li) Error vsini
(K) (cm s−2) (km s−1) (Gyr) (M
) (km s−1)
HD 361 5913 4.60 1.00 –0.12 1.33 1.03 2.30 0.05 2.96
HD 1388 5954 4.41 1.13 –0.01 4.00 1.04 2.15 0.03 3.18
HD 1581 5977 4.51 1.12 –0.18 5.86 0.99 2.32 0.02 3.03
HD 3823 6022 4.31 1.39 –0.28 8.80 0.99 2.44 0.03 3.00
HD 6735 6082 4.49 1.15 –0.06 1.92 1.09 2.64 0.04 3.71
HD 7134 5940 4.41 1.17 –0.29 9.82 0.92 2.02 0.05 2.71
HD 9782 6023 4.42 1.09 0.09 1.33 1.12 2.44 0.03 3.06
HD 11226 6098 4.35 1.28 0.04 3.79 1.14 2.52 0.03 3.03
HD 23456 6178 4.56 1.38 –0.32 6.67 0.99 2.62 0.04 3.20
HD 31822 6042 4.57 1.15 –0.19 1.07 1.04 2.56 0.04 3.77
HD 36108 5916 4.33 1.21 –0.21 9.84 0.97 2.01 0.05 2.95
HD 36379 6030 4.30 1.29 –0.17 6.76 1.07 2.44 0.04 2.98
HD 38382 6082 4.45 1.18 0.03 1.34 1.12 2.66 0.05 3.29
HD 38973 6016 4.42 1.14 0.05 2.56 1.10 2.32 0.04 3.29
HD 44120 6052 4.25 1.31 0.12 3.47 1.23 2.56 0.04 3.39
HD 44447 5999 4.37 1.26 –0.22 8.10 1.00 2.24 0.04 2.84
[image:11.595.113.486.565.754.2]Table 4.continued.
Star Teff logg ξt [Fe/H] Age Mass A(Li) Error vsini
(K) (cm s−2) (km s−1) (Gyr) (M
) (km s−1)
HD 55693 5914 4.43 1.07 0.29 2.57 1.11 <1.50 – 3.38
HD 65907A 5945 4.52 1.05 –0.31 9.77 0.91 <0.15 – 2.93
HD 68978A 5965 4.48 1.09 0.04 1.14 1.09 2.32 0.04 3.04
HD 69655 5961 4.44 1.15 –0.18 7.64 0.97 2.20 0.03 2.71
HD 70889 6051 4.49 1.13 0.11 0.37 1.14 2.62 0.03 3.45
HD 71479 6026 4.42 1.19 0.24 2.49 1.16 2.47 0.03 2.98
HD 73121 6091 4.30 1.34 0.09 3.44 1.22 <1.48 – 3.49
HD 73524 6017 4.43 1.14 0.16 0.79 1.15 2.53 0.03 3.15
HD 83529 5902 4.35 1.11 –0.22 10.05 0.94 1.99 0.04 2.47
HD 88742 5981 4.52 1.07 –0.02 0.72 1.09 2.28 0.03 2.45
HD 95456 6276 4.35 1.40 0.16 2.08 1.27 2.65 0.02 3.28
HD 105837 5907 4.54 1.14 –0.51 11.32 0.84 2.13 0.04 2.92
HD 119638 6069 4.42 1.22 –0.15 4.94 1.03 2.50 0.04 2.72
HD 122862 5982 4.23 1.29 –0.12 7.43 1.06 2.47 0.03 2.71
HD 125881 6036 4.49 1.10 0.06 0.82 1.12 2.55 0.03 2.94
HD 144585 5914 4.35 1.15 0.33 4.31 1.14 1.68 0.05 2.87
HD 145666 5958 4.53 1.04 –0.04 1.16 1.07 2.40 0.03 2.75
HD 157338 6027 4.44 1.17 –0.08 4.52 1.04 2.34 0.03 2.83
HD 162396 6090 4.27 1.43 –0.35 7.68 1.01 2.50 0.03 2.84
HD 168871 5983 4.42 1.17 –0.09 6.56 1.03 2.21 0.03 3.14
HD 171990 6045 4.14 1.40 0.06 3.47 1.29 2.77 0.02 3.06
HD 180409 6013 4.52 1.16 –0.17 2.04 1.03 2.36 0.05 3.43
HD 193193 5979 4.40 1.15 –0.05 6.07 1.06 2.08 0.03 3.19
HD 196800 6010 4.37 1.17 0.19 2.95 1.15 2.35 0.05 3.54
HD 199190 5926 4.26 1.14 0.15 4.73 1.12 2.19 0.03 2.69
HD 199960 5973 4.39 1.13 0.28 3.31 1.14 2.45 0.04 3.30
HD 204385 6033 4.44 1.15 0.07 3.31 1.11 2.41 0.04 3.63
HD 207129 5937 4.49 1.06 0.00 1.42 1.07 2.32 0.03 2.71
HD 220367 6128 4.37 1.34 –0.21 6.15 1.08 <1.00 – 3.48
HD 221356 6112 4.53 1.12 –0.20 3.63 1.04 2.61 0.03 3.69
HARPS-4
HD 25704 5942 4.52 1.37 –0.83 10.98 0.81 2.06 0.05 3.12
HD 31128 6096 4.90 3.02 –1.39 6.17 0.77 2.37 0.08 –
HD 38510 5914 4.32 1.30 –0.81 11.43 0.86 2.10 0.07 –
HD 59984 5962 4.18 1.45 –0.69 10.42 0.89 2.45 0.03 2.67
HD 61902 6209 4.38 1.58 –0.62 9.04 0.93 2.48 0.05 4.26
HD 68284 5933 4.08 1.40 –0.50 8.00 1.01 2.52 0.04 3.37
HD 88474 6122 3.91 1.91 –0.48 3.60 1.23 3.11 0.05 –
HD 90422 6085 4.14 1.67 –0.62 7.86 0.99 1.79 0.10 3.86
HD 94444 5998 4.34 1.29 –0.62 10.85 0.87 2.31 0.07 –
HD 95860 6054 4.48 1.25 –0.31 – – 2.25 0.07 –
HD 102200 6185 4.59 1.52 –1.10 10.04 0.81 2.46 0.05 –
HD 109310 5922 4.55 1.15 –0.51 8.33 0.87 2.12 0.05 2.95
HD 109684 5992 4.38 1.22 –0.34 8.94 0.93 2.24 0.10 3.04
HD 119949 6359 4.47 1.65 –0.41 5.05 1.07 2.57 0.08 –
HD 123517 6082 4.08 1.53 0.09 – – 1.94 0.10 5.81
HD 128340 6259 4.64 1.42 –0.55 6.24 0.95 2.62 0.07 –
HD 144589 6372 4.28 1.72 –0.05 – – 1.82 0.10 –
HD 145344 6143 4.39 1.48 –0.68 9.66 0.90 2.45 0.06 –
HD 148816 5908 4.39 1.36 –0.71 11.47 0.86 1.98 0.07 2.70
HD 150177 6216 4.18 1.76 –0.58 7.29 1.02 2.49 0.02 3.84
HD 195633 6154 4.25 1.47 –0.51 8.52 0.98 2.47 0.06 3.95
HD 196892 6072 4.50 1.21 –0.89 10.83 0.83 <0.50 – 2.23
HD 197536 6105 4.39 1.34 –0.41 8.28 0.96 2.42 0.04 –
HD 210752 5951 4.53 1.20 –0.58 9.77 0.86 2.27 0.03 –
HD 215257 6052 4.46 1.40 –0.63 10.75 0.87 2.40 0.04 2.80
HD 218504 5962 4.34 1.21 –0.55 11.18 0.90 2.16 0.03 3.00
HD 223854 6080 4.08 1.60 –0.54 8.43 0.99 2.48 0.05 –
HD 224347 6092 4.27 1.31 –0.42 8.68 0.95 2.43 0.05 –
BD –084501 6216 4.81 2.36 –1.38 – – 2.54 0.15 –
CD –231087 6788 4.67 1.82 –0.24 – – <1.00 – 5.37
CD –436810 6011 4.41 1.09 –0.44 5.12 0.91 <0.80 – 3.85
CD –451246 5960 4.42 0.75 –0.86 – – 2.17 0.10 –
Table 4.continued.
Star Teff logg ξt [Fe/H] Age Mass A(Li) Error vsini
(K) (cm s−2) (km s−1) (Gyr) (M
) (km s−1)
HARPS-2
HD 101612 6281 4.41 1.17 –0.36 5.57 1.03 2.50 0.08 –
HD 102300 5987 4.23 1.14 –0.31 8.91 0.97 2.43 0.08 –
HD 103891 6072 4.05 1.50 –0.19 3.71 1.27 <0.10 – 3.69
HD 104760 5953 4.43 1.02 0.12 2.32 1.10 2.20 0.05 –
HD 105938 6208 4.27 1.60 0.03 2.88 1.34 2.51 0.06 –
HD 106290 6012 4.55 1.03 0.13 1.10 1.10 2.46 0.06 –
HD 108063 6081 4.11 1.54 0.55 2.06 1.58 <0.70 – 4.60
HD 111564 6004 4.37 1.13 0.07 4.51 1.12 2.34 0.07 –
HD 112283 6433 4.84 1.86 –0.13 0.94 1.15 2.89 0.08 –
HD 115341 6058 4.55 1.10 –0.01 1.95 1.09 2.53 0.06 –
HD 115773 6312 4.23 1.57 –0.08 2.99 1.32 <0.45 – 4.67
HD 116410 5939 4.43 1.07 0.23 1.55 1.11 2.15 0.05 –
HD 119629 6250 4.17 1.73 –0.17 3.25 1.30 <1.30 – 4.31
HD 123619 6166 4.45 1.38 –0.32 6.72 1.01 2.50 0.08 –
HD 123651 5926 4.55 1.05 –0.48 9.26 0.88 2.10 0.10 –
HD 126793 5910 4.46 1.26 –0.71 10.39 0.82 1.50 0.15 –
HD 128571 6159 4.40 1.23 –0.37 7.12 0.98 2.51 0.10 –
HD 129829 6196 4.66 1.30 –0.16 1.75 1.08 2.64 0.07 –
HD 130989 6414 4.27 1.85 –0.23 3.21 1.28 <1.20 – –
HD 135468 6417 4.25 1.82 –0.02 2.17 1.45 2.86 0.07 5.94
HD 135625 6003 4.32 1.16 0.12 4.10 1.16 2.51 0.04 –
HD 139590 6200 4.49 1.31 0.13 2.06 1.22 2.78 0.05 –
HD 139879 6203 4.61 1.25 0.30 1.00 1.22 2.57 0.08 –
HD 141128 6758 4.67 1.65 0.07 0.32 1.34 <2.00 – –
HD 141597 6285 4.38 1.23 –0.40 5.90 1.03 <1.00 – –
HD 143638 5954 4.48 1.04 –0.27 5.22 0.95 2.00 0.08 2.84
HD 143790 6557 4.11 2.05 –0.06 1.80 1.56 2.90 0.06 5.43
HD 144846 6102 4.52 1.11 0.13 1.11 1.14 2.61 0.06 –
HD 144880 6152 4.38 1.33 –0.30 6.72 1.04 2.58 0.06 –
HD 14745 6290 4.72 1.46 –0.14 1.23 1.11 2.69 0.05 –
HD 148211 5922 4.34 1.31 –0.62 11.37 0.87 2.11 0.04 2.73
HD 149200 6416 4.64 1.74 0.15 0.96 1.29 2.45 0.09 –
HD 150139 5968 4.29 1.29 –0.51 11.06 0.91 2.33 0.04 –
HD 151772 6631 4.81 2.27 –0.36 3.02 1.13 2.22 0.15 –
HD 152433 6144 4.49 1.19 –0.10 4.58 1.11 2.57 0.05 –
HD 153276 6000 4.48 1.12 0.04 2.98 1.09 2.03 0.10 –
HD 154195 5961 4.48 1.01 –0.19 3.82 0.99 2.30 0.08 –
HD 156098 6517 4.20 2.06 0.18 1.44 1.70 <0.80 – 6.30
HD 156991 5934 4.57 0.99 –0.07 2.15 1.01 2.43 0.06 –
HD 160089 6312 4.78 1.60 0.11 0.67 1.20 2.87 0.08 –
HD 161566 6230 4.20 1.67 –0.28 3.66 1.25 <0.80 – 3.87
HD 163102 6433 4.64 1.94 0.00 1.13 1.24 2.94 0.06 –
HD 16382 5953 4.50 1.04 0.03 3.93 1.06 2.05 0.10 –
HD 173885 6264 4.37 1.61 –0.20 4.18 1.21 2.33 0.08 –
HD 174153 6196 4.49 1.34 –0.08 3.14 1.12 2.66 0.05 –
HD 17548 6011 4.44 1.18 –0.53 9.84 0.88 2.45 0.04 –
HD 176666 6103 4.63 1.18 –0.37 5.76 0.95 2.62 0.06 –
HD 177122 6021 4.52 1.03 –0.10 2.15 1.04 2.44 0.04 –
HD 179346 6229 4.76 1.35 –0.03 0.99 1.12 2.70 0.05 –
HD 18083 6144 4.70 1.33 0.03 0.96 1.11 2.70 0.05 –
HD 181428 6151 4.45 1.29 0.06 3.12 1.18 2.78 0.04 –
HD 188815 6217 4.34 1.31 –0.53 8.76 0.95 2.52 0.08 –
HD 191033 6206 4.47 1.35 –0.19 4.49 1.07 <1.30 – –
HD 192865 6307 4.44 1.59 0.13 2.26 1.32 <0.80 – 5.11
HD 195200 6201 4.44 1.25 –0.08 3.67 1.13 2.80 0.05 –
HD 196384 6611 4.79 1.78 –0.13 0.77 1.21 2.48 0.15 –
HD 197300 6022 4.69 1.21 0.02 1.11 1.06 2.84 0.07 –
HD 199086 6149 4.65 1.21 0.18 0.86 1.17 2.58 0.05 –
HD 199289 5925 4.62 1.30 –0.98 10.83 0.79 2.05 0.08 –
HD 199868 6152 4.45 1.26 –0.13 4.82 1.09 2.58 0.05 –
HD 200538 6042 4.38 1.22 0.10 3.58 1.14 2.01 0.06 –
HD 201496 5974 4.44 1.12 –0.04 3.06 1.04 1.93 0.15 –
HD 202209 6009 4.68 1.19 –0.01 1.38 1.05 2.78 0.04 –
Table 4.continued.
Star Teff logg ξt [Fe/H] Age Mass A(Li) Error vsini
(K) (cm s−2) (km s−1) (Gyr) (M
) (km s−1)
HD 203335 6306 4.56 1.44 –0.04 2.42 1.19 2.66 0.05 –
HD 205294 6370 4.30 1.71 –0.25 4.01 1.20 2.31 0.05 4.82
HD 205591 6575 4.75 1.85 –0.08 1.38 1.25 2.75 0.06 7.68
HD 206116 6231 4.57 1.36 0.24 1.08 1.24 2.69 0.06 –
HD 207190 6182 4.33 1.51 –0.42 7.35 0.99 2.64 0.04 –
HD 208 5914 4.47 1.05 –0.31 9.07 0.91 2.04 0.04 2.59
HD 208068 6007 4.64 1.17 –0.38 3.18 0.93 <0.90 – 5.02
HD 20852 6813 4.76 2.34 –0.35 2.39 1.20 <1.00 – 6.08
HD 208672 5986 4.61 1.07 0.13 1.30 1.10 2.62 0.10 –
HD 211317 5965 4.30 1.21 0.27 3.87 1.19 2.62 0.05 –
HD 21132 6243 4.60 1.44 –0.37 5.47 0.99 2.63 0.03 3.11
HD 21161 5923 4.24 1.14 0.09 5.28 1.09 2.12 0.08 –
HD 214094 6288 4.28 1.46 –0.01 2.77 1.33 <0.30 – 4.69
HD 215625 6282 4.58 1.35 0.10 0.71 1.19 2.82 0.05 –
HD 215906 6259 4.56 1.55 –0.28 5.23 1.05 2.55 0.08 –
HD 217395 5916 4.52 0.95 –0.13 2.86 1.00 2.21 0.05 –
HD 217958 5970 4.45 1.29 0.28 1.93 1.13 2.30 0.15 –
HD 218379 5938 4.11 1.24 0.15 3.72 1.27 2.46 0.04 –
HD 21977 5930 4.45 1.03 0.10 2.37 1.08 <1.87 0.10 –
HD 220894 6282 4.60 1.35 0.02 1.00 1.18 2.34 0.05 –
HD 221638 6360 4.53 1.43 –0.21 2.23 1.10 2.58 0.08 –
HD 224578 6158 4.67 1.13 –0.01 1.14 1.11 2.83 0.07 –
HD 225297 6181 4.55 1.24 –0.09 2.46 1.11 2.65 0.05 –
HD 23030 5951 4.37 1.22 0.20 3.98 1.16 2.58 0.08 –
HD 24062 6107 4.62 1.34 0.28 2.63 1.23 2.85 0.05 –
HD 24085 6065 4.47 1.22 0.17 2.59 1.17 2.68 0.08 –
HD 24112 6175 4.35 1.26 0.16 2.60 1.26 2.58 0.05 3.10
HD 25587 6258 4.61 1.78 –0.12 4.02 1.18 2.23 0.15 –
HD 2567 6038 4.44 1.19 0.22 2.36 1.17 2.52 0.05 –
HD 25912 5900 4.52 0.99 0.12 1.37 1.06 2.15 0.06 –
HD 26887 6016 4.46 1.00 –0.35 4.05 0.94 2.30 0.07 –
HD 28969 6255 4.68 1.47 –0.01 1.07 1.15 2.84 0.06 –
HD 29980 6019 4.71 1.57 0.12 1.78 1.12 2.71 0.08 –
HD 30053 6139 4.51 1.20 –0.22 3.34 1.03 2.52 0.05 –
HD 31103 6078 4.49 1.08 0.09 1.09 1.12 <0.80 – 3.18
HD 3229 6583 4.14 1.80 –0.09 1.80 1.56 <2.00 – –
HD 32804 5910 4.53 1.08 0.06 1.71 1.05 2.72 0.03 –
HD 33081 6399 4.56 2.47 –0.16 3.38 1.19 <1.50 – –
HD 36051 6118 4.63 1.21 –0.08 1.26 1.07 2.77 0.05 –
HD 37226 6178 4.16 1.61 –0.12 2.77 1.39 <0.70 – 4.47
HD 37548 5950 4.26 1.19 –0.04 6.10 1.09 2.20 0.06 –
HD 37990 6215 4.56 1.15 0.00 1.08 1.14 2.83 0.05 –
HD 38385 7212 4.61 2.87 0.09 0.61 1.56 2.40 0.15 –
HD 38772 6106 4.37 1.16 –0.23 6.72 1.03 2.55 0.07 –
HD 40483 6371 4.39 1.80 –0.06 2.68 1.34 <1.30 – –
HD 457 6089 4.43 1.17 0.34 2.45 1.21 2.59 0.04 –
HD 4597 6025 4.43 1.11 –0.39 8.38 0.92 2.31 0.08 –
HD 52449 6362 4.55 1.29 0.12 0.49 1.21 2.90 0.08 –
HD 5388 6311 4.24 1.65 –0.28 3.90 1.22 1.46 0.10 4.66
HD 54521 5973 4.54 1.02 –0.01 2.01 1.05 2.30 0.10 –
HD 564 5902 4.53 0.95 –0.20 5.21 0.96 2.30 0.04 2.44
HD 62364 6255 4.47 1.42 –0.11 3.99 1.16 2.61 0.06 –
HD 63754 6200 4.21 1.57 0.21 2.36 1.41 2.30 0.05 –
HD 65982 5947 4.42 1.08 –0.10 4.91 1.01 2.15 0.05 –
HD 66039 6149 4.52 1.14 0.17 0.92 1.18 2.85 0.04 –
HD 66168 6198 4.69 1.18 –0.03 1.03 1.11 2.70 0.06 –
HD 66740 6666 4.49 1.70 0.04 0.87 1.35 <1.40 – –
HD 67200 6105 4.44 1.19 0.32 1.43 1.19 2.69 0.07 –
HD 68287 6318 4.63 1.45 0.06 0.95 1.21 2.91 0.05 –
HD 71685 6038 4.58 1.09 –0.37 5.21 0.93 2.48 0.05 –
HD 74957 5915 4.54 0.95 –0.18 6.54 0.97 1.93 0.08 3.07
HD 75328 6003 4.46 1.05 –0.23 6.38 0.98 2.31 0.08 –
HD 75881 6239 4.44 1.63 0.07 2.69 1.33 2.73 0.07 –
HD 76188 5989 4.08 1.25 –0.44 7.64 1.01 2.53 0.07 –
Table 4.continued.
Star Teff logg ξt [Fe/H] Age Mass A(Li) Error vsini
(K) (cm s−2) (km s−1) (Gyr) (M
) (km s−1)
HD 84305 5963 4.51 0.95 –0.23 5.39 0.97 2.31 0.07 –
HD 84627 6113 4.50 1.10 –0.28 1.71 1.00 2.54 0.06 –
HD 85725 5986 3.95 1.54 0.15 2.42 1.50 <0.56 – 5.85
HD 86652 5934 4.47 1.01 0.13 1.62 1.09 2.00 0.10 –
HD 87838 6118 4.47 1.33 –0.40 6.72 0.94 2.49 0.05 –
HD 8985 6473 4.96 2.15 –0.01 0.52 1.20 2.97 0.08 –
HD 90081 5912 4.34 1.08 –0.20 8.12 0.95 2.01 0.10 –
HD 90936 5928 4.48 1.04 0.03 2.08 1.05 2.16 0.08 –
HD 91379 6164 4.41 0.98 –0.29 2.46 1.01 2.60 0.10 –
HD 92547 6020 4.45 1.14 –0.37 8.41 0.92 2.24 0.08 –
HD 93745 6065 4.34 1.33 0.12 3.57 1.22 2.40 0.08 –
HD 93932 5950 4.30 1.16 0.05 5.46 1.09 2.17 0.07 –
HD 94964 6139 4.55 1.26 –0.07 2.32 1.10 2.71 0.05 –
HD 95542 5984 4.52 1.01 –0.04 1.75 1.04 2.59 0.03 –
HD 95922 6293 4.63 1.23 –0.06 2.08 1.16 2.92 0.05 –
HD 9608 5954 4.43 0.98 –0.26 8.87 0.95 2.19 0.05 –
HD 96276 6080 4.49 1.12 –0.02 2.37 1.09 2.50 0.05 –
HD 96290 6219 4.56 1.21 0.03 1.01 1.15 2.71 0.06 –
HD 97320 6162 4.57 1.50 –1.05 10.46 0.81 2.52 0.05 –
HD 98284 5913 4.52 1.18 –0.84 9.48 0.81 2.12 0.08 –
HD 131664 5901 4.50 1.04 0.31 2.32 1.10 2.10 0.04 3.01
Table 5.Li abundances for planet hosts not belonging to the HARPS-GTO sample.
Star Teff logg ξt [Fe/H] Age Mass A(Li) Error vsini Hot jupiter Flag Ref.
(K) (cm s−2) (km s−1) (Gyr) (M
) (km s−1)
HD 2039 5976 4.45 1.26 0.32 2.03 1.14 2.38 0.06 3.46 no [1] [c]
HD 8574 6151 4.51 1.45 0.06 2.75 1.17 2.65 0.10 – no [4] [c]
HD 9826 6212 4.26 1.69 0.13 2.65 1.28 2.87 0.08 – yes [4] [c]
HD 11506 6204 4.44 1.32 0.36 0.83 1.23 2.96 0.04 5.01 no [1] [b]
HD 13931 5940 4.42 1.19 0.08 3.15 1.08 1.84 0.15 – no [7] [b]
HD 16175 6030 4.23 1.39 0.32 3.22 1.29 2.78 0.07 4.58 no [9] [b]
HD 17156 6084 4.33 1.47 0.23 2.77 1.21 2.84 0.05 – no [7] [e]
HD 20367 6138 4.53 1.22 0.17 1.18 1.15 3.00 0.10 – no [10] [c]
HD 23596 6108 4.25 1.30 0.31 2.77 1.24 2.83 0.05 – no [11] [c]
HD 30562 5970 4.20 1.20 0.32 3.73 1.22 2.78 0.05 – no [3] [d]
HD 31253 6147 4.27 1.47 0.17 2.77 1.25 1.75 0.07 3.25 no [3] [b]
HD 33283 6058 4.16 1.41 0.34 2.92 1.34 2.51 0.05 4.08 no [1] [b]
HD 34445 5915 4.30 1.11 0.24 4.36 1.14 1.80 0.08 – no [5] [d]
HD 38283 5980 4.27 1.28 –0.14 7.43 1.06 2.43 0.05 3.80 no [3] [b]
HD 40979 6145 4.31 1.29 0.21 0.79 1.19 2.96 0.07 – no [4] [c]
HD 43691 6200 4.28 1.49 0.28 2.28 1.28 <2.21 – – no [7] [i]
HD 50499 6056 4.29 1.23 0.39 2.93 1.20 2.70 0.07 – no [5] [d]
HD 50554 6026 4.41 1.11 0.01 1.96 1.09 2.52 0.05 3.93 no [11] [c]
HD 60532 6273 4.02 1.88 –0.09 2.24 1.50 1.90 0.08 5.83 no [2] [b]
HD 68988 5988 4.45 1.25 0.36 1.38 1.14 2.25 0.10 – no [4] [c]
HD 74156 6112 4.34 1.38 0.16 2.96 1.25 2.68 0.04 4.31 no [3] [c]
HD 75898 6137 4.31 1.36 0.30 2.54 1.25 2.85 0.06 4.32 no [1] [b]
HD 86081 6036 4.21 1.34 0.22 2.68 1.19 2.00 0.08 4.82 yes [1] [b]
HD 86226 5947 4.54 1.12 0.02 1.05 1.08 2.17 0.06 – no [3] [b]
HD 86264 6596 4.47 1.90 0.37 0.81 1.40 <1.15 – – no [3] [b]
HD 89307 5967 4.51 1.33 –0.13 3.54 1.02 2.31 0.08 – no [4] [d]
HD 95128 5954 4.44 1.30 0.06 4.44 1.07 1.85 0.15 – no [4] [c]
HD 103774 6732 4.81 2.03 0.29 0.26 1.40 <1.30 – 7.95 no [2] [b]
HD 118203 5910 4.18 1.34 0.25 3.61 1.29 2.70 0.05 – no [4] [b]
HD 120136 6339 4.19 1.70 0.23 1.49 1.30 <1.40 – 14.20 no [1] [c]
HD 142415 6045 4.53 1.12 0.21 0.51 1.12 2.10 0.10 – no [3] [c]
Notes.The instrument used and the reference for the stellar parameters are shown in the last two columns. Flag: [1] UVES; [2] HARPS; [3] FEROS; [4] SARG; [5] CORALIE; [6] NOT; [7] SOPHIE; [8] HIRES; [9] FIES; [10] ELODIE; [11] UES.
[image:15.595.56.542.371.707.2]Table 5.continued.
Star Teff logg ξt [Fe/H] Age Mass A(Li) Error vsini Hot jupiter Flag Ref.
(K) (cm s−2) (km s−1) (Gyr) (M
) (km s−1)
HD 149026 6162 4.37 1.41 0.36 2.34 1.25 2.44 0.10 – yes [4] [e]
HD 149143 6018 4.31 1.12 0.45 2.92 1.17 1.95 0.10 – yes [5] [d]
HD 150706 5961 4.50 1.11 –0.01 0.56 1.05 2.63 0.04 – no [11] [c]
HD 155358 5908 4.26 1.29 –0.62 11.74 0.88 2.14 0.10 3.12 no [1] [b]
HD 164509 5957 4.43 1.09 0.24 0.93 1.13 2.30 0.06 3.60 no [2] [b]
HD 176051 6030 4.68 1.28 –0.04 3.39 1.07 2.54 0.06 – no [7] [b]
HD 183263 5991 4.38 1.23 0.34 1.66 1.14 2.36 0.05 – no [3] [f]
HD 185269 5983 4.05 1.49 0.10 3.75 1.27 2.49 0.05 – no [10] [h]
HD 187085 6146 4.36 1.31 0.13 1.76 1.18 2.66 0.06 3.74 no [1] [b]
HD 196067 5999 4.13 1.30 0.23 3.39 1.23 2.40 0.06 – no [3] [b]
HD 196885A 6340 4.46 1.51 0.29 0.52 1.27 2.74 0.05 – no [4] [d]
HD 205739 6301 4.40 1.42 0.21 1.74 1.31 2.71 0.04 4.06 no [1] [b]
HD 220689 5904 4.38 1.13 –0.01 4.28 1.03 1.92 0.06 – no [3] [b]
HD 220773 5995 4.26 1.33 0.11 4.15 1.21 2.48 0.05 – no [3] [b]
HD 224693 6053 4.18 1.40 0.28 3.00 1.32 2.09 0.08 4.20 no [1] [b]
HD 231701 6224 4.37 1.35 0.04 1.35 1.18 2.77 0.04 4.26 no [1] [b]
CoRoT-1 6397 4.66 1.68 0.03 0.95 1.39 2.77 0.06 4.74 no [2] [a]
CoRoT-4 6344 4.82 1.74 0.15 1.20 1.28 <2.43 – 6.40 no [2] [a]
CoRoT-5 6240 4.46 1.28 0.04 1.83 1.22 2.88 0.07 3.82 yes [2] [a]
HAT-P-1 6076 4.47 1.17 0.21 1.28 1.18 1.77 0.10 – yes [4] [e]
HAT-P-4 6054 4.17 1.59 0.35 2.12 1.21 2.90 0.10 – yes [7] [e]
HAT-P-6 6855 4.69 2.85 –0.08 0.73 1.24 <1.90 – – no [7] [e]
HAT-P-7 6525 4.09 1.78 0.31 1.05 1.42 3.29 0.10 – no [7] [e]
HAT-P-8 6550 4.80 1.93 0.07 0.53 1.23 3.02 0.10 10.94 no [9] [a]
HAT-P-30 6338 4.52 1.40 0.12 0.85 1.25 3.10 0.06 – no [3] [a]
HAT-P-35 6178 4.40 1.34 0.12 1.61 1.21 2.67 0.05 – yes [3] [a]
Kepler-21 6409 4.43 1.86 –0.03 2.42 1.36 <1.20 – – no [7] [j]
Kepler-43 6041 4.26 1.85 0.33 2.34 1.19 2.20 0.15 – yes [7] [k]
OGLE-TR-10 6075 4.54 1.45 0.28 2.02 1.22 2.28 0.10 6.43 yes [1] [g]
OGLE-TR-182 5924 4.47 0.91 0.37 2.78 1.16 <1.89 – 4.53 no [1] [l]
OGLE-TR-211 6325 4.22 1.63 0.11 – – <1.50 – 7.10 no [1] [m]
OGLE-TR-56 6119 4.21 1.48 0.25 1.80 1.25 2.63 0.10 5.25 yes [1] [g]
TrES-4 6293 4.20 2.01 0.34 1.36 1.31 <1.50 – – no [7] [e]
WASP-1 6252 4.32 1.42 0.23 1.17 1.29 3.29 0.08 3.66 yes [1] [a]
WASP-7 6621 4.62 3.00 0.12 0.71 1.22 <1.70 – 17.48 no [1] [a]
WASP-12 6313 4.37 1.65 0.21 1.18 1.30 2.65 0.08 – no [3] [a]
WASP-13 6025 4.19 1.28 0.11 2.93 1.16 2.17 0.08 4.35 yes [8] [a]
WASP-15 6573 4.79 1.72 0.09 0.52 1.30 <2.00 – 4.77 no [2] [a]
WASP-17 6794 4.83 2.57 –0.12 0.74 1.27 <1.30 – 8.87 no [2] [a]
WASP-18 6526 4.73 1.83 0.19 0.33 1.28 2.81 0.10 – no [3] [a]
WASP-21 5924 4.39 1.06 –0.22 5.29 0.96 2.28 0.10 – yes [3] [a]
WASP-22 6153 4.57 1.36 0.26 1.31 1.22 2.49 0.10 4.29 yes [2] [a]
WASP-24 6297 4.76 1.41 0.09 0.84 1.21 2.52 0.08 5.55 yes [2] [a]
WASP-26 6034 4.44 1.28 0.16 1.85 1.16 2.09 0.10 – yes [3] [a]
WASP-28 6134 4.55 1.17 –0.12 2.68 1.09 2.51 0.10 4.39 yes [2] [a]
WASP-31 6443 4.76 1.62 –0.08 1.16 1.18 2.97 0.08 6.97 no [2] [a]
WASP-32 6427 4.93 1.20 0.28 0.73 1.20 <1.80 – – no [3] [a]
WASP-35 6072 4.69 1.26 –0.05 1.82 1.07 2.38 0.08 – yes [3] [a]
WASP-36 5928 4.51 0.89 –0.01 3.56 1.05 <1.94 – 4.01 no [2] [a]
WASP-38 6436 4.80 1.75 0.06 0.35 1.21 <2.20 – 7.43 no [2] [a]
WASP-54 6296 4.37 1.45 0.00 1.51 1.20 <1.30 – – no [3] [a]
WASP-55 6070 4.55 1.10 0.09 1.90 1.14 2.51 0.08 – yes [3] [a]
WASP-62 6391 4.73 1.50 0.24 0.50 1.26 2.63 0.06 – no [3] [a]
WASP-66 7051 5.00 3.07 0.05 0.38 1.45 3.39 0.06 – no [3] [a]
WASP-71 6180 4.15 1.69 0.37 1.68 1.27 2.33 0.10 – yes [3] [a]
WASP-78 6291 4.19 1.63 –0.07 2.21 1.19 <1.50 – – no [3] [a]