ESSAYS ON ISLAMIC EQUITY INVESTING
Hampus Adamsson
A Thesis Submitted for the Degree of PhD at the
University of St Andrews
2015
Full metadata for this item is available in Research@StAndrews:FullText
at:
http://research-repository.st-andrews.ac.uk/
Please use this identifier to cite or link to this item: http://hdl.handle.net/10023/7800
Essays on Islamic Equity Investing
Hampus Adamsson
This thesis is submitted in partial fulfilment for the degree of PhD
at the
University of St Andrews
ii
1. Candidate’s declarations:
I, Hampus Adamsson, hereby certify that this thesis, which is approximately 57000 words in length, has been written by me, and that it is the record of work carried out by me, or principally by myself in collaboration with others as acknowledged, and that it has not been submitted in any previous application for a higher degree.
I was admitted as a research student in September 2010 and as a candidate for the degree of PhD in May 2011; the higher study for which this is a record was carried out in the University of St Andrews between 2010 and 2015.
Date …… signature of candidate ………
2. Supervisor’s declaration:
I hereby certify that the candidate has fulfilled the conditions of the Resolution and
Regulations appropriate for the degree of PhD in the University of St Andrews and that the candidate is qualified to submit this thesis in application for that degree.
Date …… signature of supervisor ………
3. Permission for publication:
In submitting this thesis to the University of St Andrews I understand that I am giving permission for it to be made available for use in accordance with the regulations of the University Library for the time being in force, subject to any copyright vested in the work not being affected thereby. I also understand that the title and the abstract will be published, and that a copy of the work may be made and supplied to any bona fide library or research worker, that my thesis will be electronically accessible for personal or research use unless exempt by award of an embargo as requested below, and that the library has the right to migrate my thesis into new electronic forms as required to ensure continued access to the thesis. I have obtained any third-party copyright permissions that may be required in order to allow such access and migration, or have requested the appropriate embargo below.
The following is an agreed request by candidate and supervisor regarding the publication of this thesis:
PRINTED COPY
a) No embargo on print copy
ELECTRONIC COPY
a) No embargo on electronic copy
Date …… signature of candidate …… signature of supervisor ………
iii
ACKNOWLEDGMENTS
First of all, I would like to express my sincere gratitude to my supervisors, Dr Andreas Hoepner and Dr Kais Bouslah. They have provided me with invaluable support throughout my Ph.D. project. I am also grateful to my previous supervisor, Professor John Wilson, and other staff and Ph.D. colleagues at the Centre for Responsible Banking and Finance, University of St Andrews.
The research presented in this thesis has also benefited substantially from comments and suggestions made by conference participants at Dundee University, University of Durham, the ICMA Centre at Henley Business School, and the School of Management, University of St Andrews.
Furthermore, I would like to express my gratitude to those foundations that have given me financial support throughout my academic career, most notably The Dr. Tech. Marcus Wallenbergs Foundation.
iv
TABLE OF CONTENTS
1 INTRODUCTION ... 2
1.1 Research background ... 3
1.2 Summary of contributions and main findings ... 7
1.2.1 Essay I: An Islamic Equity Performance Puzzle ... 7
1.2.2 Essay II: Determinants of Islamic Index Performance ... 8
1.2.3 Essay III: TheFinancial Impact of Shari’ah-based Accounting Screens ... 9
1.3 Implications of research findings for different agents ... 10
1.4 Thesis structure ... 12
2 BACKGROUND ... 13
2.1 Introduction ... 14
2.2 Part I: Institutional background ... 15
2.2.1 Emergence of modern Islamic finance ... 15
2.2.2 Foundations of Islamic Jurisprudence ... 16
2.2.3 The main prohibitions in Islamic finance ... 17
2.2.4 Fundamentals of Islamic equity investing ... 19
2.2.5 The function of Shari’ah Advisory Boards ... 21
2.2.6 Current state of the Islamic equity market ... 22
2.3 Part II: A critical examination of Shari’ah-based stock screening ... 26
2.3.1 Collection of screening data ... 27
2.3.2 Business activity screening ... 30
2.3.3 Accounting based screening ... 31
2.3.4 Stringency of Shari’ah screens ... 32
2.4 Chapter summary ... 43
3 THEORETICAL BACKGROUND ... 44
3.1 Introduction ... 45
3.2 The Capital Asset Pricing Model ... 47
3.2.1 Theoretical foundation ... 47
v
3.3 The emergence of multifactor models ... 52
3.4 Performance measurements ... 56
3.4.1 The Sharpe ratio ... 56
3.4.2 The Treynor ratio ... 57
3.4.3 The Jensen’s alpha measure ... 58
3.4.4 The Fama & French (1993) three factor model ... 59
3.4.5 The Carhart (1997) four factor model ... 60
3.5 Concluding remarks ... 61
4 AN ISLAMIC EQUITY INDEX PERFORMANCE PUZZLE ... 64
4.1 Introduction ... 65
4.2 Background ... 68
4.2.1 Islamic equity investing fundamentals ... 68
4.2.2 Empirical evidence on Islamic index performance ... 73
4.3 Hypotheses ... 76
4.4 Data ... 77
4.4.1 Islamic index data ... 77
4.4.2 Benchmark data ... 79
4.4.3 Islamic index descriptive statistics ... 81
4.5 Main analysis ... 84
4.5.1 Jensen’s Alpha ... 84
4.5.2 Carhart four-factor model ... 86
4.5.3 Tracking error ... 91
4.5.4 Is there a back-testing bias? ... 92
4.6 Potential explanation of the results ... 95
4.6.1 Is there a risk management effect? ... 95
4.6.2 How do Islamic indices perform during financial crises? ... 100
4.6.3 Ramadan effect ... 104
4.6.4 Full data history vs. common sample period ... 108
4.6.5 Conventional benchmarks vs. ex-financial benchmarks ... 112
4.7 Conclusion ... 117
vi
5.1 Introduction ... 121
5.2 Research questions ... 124
5.2.1 The interest rate environment ... 124
5.2.2 The level of money supply ... 126
5.2.3 Impact of overall stock market behaviour ... 126
5.2.4 The level of Muslim population ... 127
5.3 Data ... 128
5.3.1 Data sources ... 128
5.3.2 Dependent variable: risk-adjusted performance (Jensen’s alpha) ... 129
5.3.3 Key independent variables ... 137
5.3.4 Additional control variables ... 138
5.3.5 Descriptive statistics ... 145
5.4 Research design ... 149
5.5 Results ... 150
5.5.1 Bivariate regression results ... 150
5.5.2 Multivariate regression results ... 153
5.6 Concluding remarks ... 159
6 THE FINANCIAL IMPACT OF SHARI’AH-BASED ACCOUNTING SCREENS ... 162
6.1 Introduction ... 163
6.2 Capital structure theory ... 166
6.3 Data ... 169
6.3.1 Asset universe, financial returns and accounting data ... 169
6.4 Analysis & Results ... 172
6.4.1 Descriptive statistics ... 172
6.5 Regression analysis ... 175
6.5.1 Time-varying impact of screens ... 179
6.5.2 What is the performance in different sectors? ... 182
vii
7 CONCLUSIONS ... 189
7.1 Summary of thesis ... 190
7.2 Discussion ... 193
viii
LIST OF TABLES
Table 2.1 Morphological box of the Shari’ah-based stock screening process ... 29
Table 2.2 Stringency of business activity screening ... 35
Table 2.3 Stringency of accounting based screens ... 39
Table 2.4 Stringency of accounting based screens across sectors ... 42
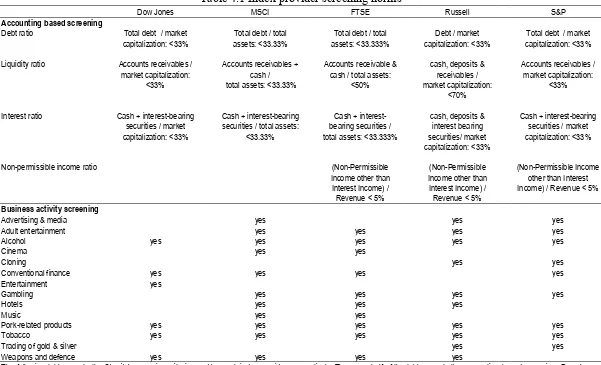
Table 4.1 Index provider screening norms ... 72
Table 4.2 Descriptive statistics of Islamic and benchmark indices ... 83
Table 4.3 Islamic index CAPM and Carhart regression results ... 89
Table 4.4 Results of Carhart (1997) estimations after controlling for back-testing bias ... 94
Table 4.5 Results of Carhart (1997) estimations after controlling for back-testing bias and downside risk ... 98
Table 4.6 Results of Carhart (1997) estimations after controlling for back-testing bias and financial crises ... 102
Table 4.7 Results of Carhart (1997) regressions after controlling for back-testing bias and Ramadan effect ... 106
Table 4.8 Results of Carhart (1997) estimations for the common sample period ... 110
Table 4.9 Results of Carhart (1997) estimations with standard and ex-financials benchmarks ... 115
Table 5.1 Dependent variable summary statistics ... 135
Table 5.2 Overview of variables, definitions and data sources ... 144
Table 5.3 Summary statistics of explanatory variables ... 146
ix
Table 5.5 Bivariate regression results ... 152
Table 5.6 Multivariate regression results ... 157
Table 6.1 Portfolio definition ... 171
Table 6.2 Descriptive statistics ... 174
Table 6.3 Main regression results ... 178
Table 6.4 Sub-sample analysis ... 181
x
LIST OF FIGURES
Figure 2.1 Elements covered in the chapter ... 15
Figure 2.2 Overview of the Islamic screening process ... 21
Figure 2.3. AUM of global Shari’ah-compliant funds ... 24
Figure 2.4 Domicile of Shari’ah-compliant funds ... 24
Figure 2.5 Time-varying difference in stringency between MC-based and TA-based screens at 33% threshold level ... 37
1 ABSTRACT
Islamic finance is rapidly gaining momentum around the world. Interpretations of
Shari’ah, or Islamic law, state that investments must be free from elements of riba
(interest), gharar (uncertainty), maysir (speculation) and haram (unethical) business activities. Islamic equity investing, therefore, utilizes a set of business activity screens and accounting-based screens to exclude firms considered non-permissible under
Shari’ah. Despite increased academic interest, there is still much uncertainty
2 Chapter 1
3 1.1 Research background
Although historically centred in the Middle East, Islamic finance is currently gaining momentum globally. Motivated by the strong liquidity within the sector, Western economies have started to make significant efforts to accommodate the need for financial products and services that adhere to Islamic principles. For instance, during the 2013 World Economic Islamic Finance Forum, the UK Prime Minster David Cameron expressed his ambition for “London to stand alongside Dubai and Kuala Lumpur as one of the great capitals of Islamic finance anywhere in the world” (Hutton, 2013).1 One can currently witness similar trends in other important market
contexts, such as Australia, Canada, France and the United States. Islamic financial institutions are currently present in over 70 countries (Warde, 2010) and the industry is estimated to be worth over $1.8 trillion (EY, 2013). With an annual growth rate of more than 10% (Maslakovic, 2013) Islamic finance is widely considered one of the fastest growing sectors of the financial industry.
Islamic finance is about financial activities that are performed in accordance with
Shari’ah or Islamic law. Interpretations of Shari’ah state that economic and
commercial transactions must be free from elements of riba (interest), gharar
(uncertainty) and maysir (speculation). Conventional financial instruments, such as fixed-income bonds, derivatives and futures, are therefore considered non-permissible from an Islamic perspective (Ayub, 2009; El-Gamal, 2006; Iqbal & Mirakhor, 2011).
4
In the light of these constraints, equity has emerged as a particularly important asset class for investors seeking Shari’ah-compliant returns (Khatkhatay & Nisar, 2007). Consequently, there are now thousands of Islamic mutual funds and equity indices available to investors around the world. These investment vehicles undertake so-called
Shari’ah-based stock screening to rule out firms that do not comply with Islamic principles. This process comprises both business activity screening and accounting
based screening.2 The business activity screening aims to exclude firms that generate
income from activities considered unethical, such as alcohol, conventional financial services, pork production and tobacco. The accounting-based screening, on the other hand, is concerned with firms’ financial structure, which discourages excessive use of leverage and interest-bearing income (Derigs & Marzban, 2008; El-Gamal, 2006).
Academic interest in the performance attributes of Islamic equity investing has, not surprisingly, gradually increased in line with the industry. The central empirical question in this body of literature relates to the financial impact of employing
Shari’ah-based stock screening. In addressing this issue, previous studies have
examined the performance of Islamic equity indices relative to unconstrained market benchmarks. However, the empirical evidence in this literature stream is mixed.3
Arguably, the uncertainty surrounding the performance of these indices is likely to harm investor confidence, hence threatening the future growth of the industry. One of
2 In the literature these screens are also referred to as sector/qualitative screening and financial/quantitative screening.
5
the major challenges faced by Islamic finance researchers, at least historically, has been the limited availability of comprehensive data. In fact, equity investing was not approved by Islamic authorities until the 1990s (Naughton & Naughton, 2000) and the first major index tracking the performance of Shari’ah-compliant firms was launched as late as 1999.4 Hence, long-horizon studies have not been feasible until recently.
Another limitation in this literature stream is the common use of rather simplistic performance measures, such as ratio analysis and single index asset pricing models (Albaity & Ahmad, 2008; Habib & Islam, 2014; Ho, Rahman, Yusuf, & Zamzamin, 2014; Hussein, 2004; Jouaber-Snoussi, 2012). The first essay of this thesis, entitled An
Islamic Equity Performance Puzzle, aims to address these gaps in an attempt to deepen
the understanding of Islamic index return and risk characteristics.
Shari’ah-compliant assets have not only grown immensely in size, but also in
geographical distribution. By the end of 2012, it has been estimated that approximately 60% of the total asset base were distributed outside the Middle East (EY, 2013). Behind this trend lies an increased openness among Western governments to facilitate Islamic banking and finance, together with Muslim investors seeking to diversify their oil wealth (Mansoor & Ishaq, 2008). It could be argued that, with these assets becoming increasingly integrated into the global economy, it is critical to understand whether country-level characteristics impact the performance of Islamic equity portfolios. While previous studies have been interested in measuring
6
the performance of Islamic indices relative market benchmarks, almost no attention has been given to the role of the country environment. The second essay of this thesis, entitled Determinants of Islamic Index Performance, aims to consider this issue.
One important limitation of analysing Islamic mutual funds and indices is that the financial impact of the Shari’ah screening can only be measured collectively. That is, the performance of these investment vehicles is essentially the collective outcome of a large number of business activity screens and accounting screens. Hence, it is highly improbable to separate, for instance, the merits of the different accounting screens that are used to define the asset universe. The importance of this issue is strengthening by the fact that Shari’ah screening norms adopted by financial institutions are not universal (Derigs & Marzban, 2008). For instance, while some institutions use accounting ratios based on market capitalization to define firm value, other use total assets. Similarly, there are disparities concerning the classification of unethical industries. Effectively, these inconsistencies result in Shari’ah-compliant asset universes that are likely to differ in terms of sector allocation, size and firm-level characteristics. Consequently, this raises the question whether individual Shari’ah
7
1.2 Summary of contributions and main findings
1.2.1 Essay I: An Islamic Equity Performance Puzzle
This essay makes several contributions to the literature. First, it studies the return and risk characteristics of a comprehensive dataset of 32 global and regional Shari’ah -compliant indices from five major index providers (i.e., Dow Jones, FTSE, MSCI, Russell, S&P) over the period 1996 to 2012. The large number of indices (relative previous studies) is advantageous, as it increases the robustness of the results and permits performance comparison across geographical markets. Furthermore, using data from different index providers allows to study the potential financial impact of the unique Shari’ah screening criteria adopted by each provider, respectively. Second, the analysis addresses a number of methodologies shortcomings typically present in the literature. The performance evaluation is carried out in both a single and a multifactor regression setting, and is robust to matched index pairs (Kreander, Gray, Power, & Sinclair, 2005) and tailored investment style risk factors. The matched pair approach means that each Islamic index is benchmarked against its unconstrained index counterpart. Any difference in performance can hence be directly traced to the impact of the Shari’ah screening, avoiding potential biases such as differences in asset universe and index construction methodology.
8
explaining this performance puzzle, a number of potential behavioural, fundamental and research design related explanations are investigated. When the effect of the financial services sector is eliminated from the conventional benchmarks, the recorded outperformance is heavily reduced or disappears entirely. Hence, the study concludes that the relatively good performance of Islamic indices in recent years has been due to their low exposure to financial stocks.
1.2.2 Essay II: Determinants of Islamic Index Performance
Moving beyond traditional measures of relative performance, the second essay contributes to the literature by investigating potential determinants of Islamic index risk-adjusted returns. This area has not previously been explored in the literature. Based on a large sample of Islamic indices across 46 developed and emerging market countries, it is examined whether their risk-adjusted returns can be explained by country-level factors, such as cultural, economic, governance and religious variables. Furthermore, it is also examined whether variables related to the screening intensity of Islamic indices are significant determinants of performance.
9
based on market capitalization. However, the cultural and governance environment appears to be irrelevant in explaining the performance.
This essay is subject to a number of limitations. First, the analysis is limited to the period 2008 to 2012. This is because historical return data for country level Islamic indices is barely available prior to 2008 and it is not until recently that relevant macroeconomic data has become available for 2013. Second, the analysis includes an estimated dependent variable (i.e., alpha coefficient) which introduces some statistical uncertainty. Two alternative variables are considered to minimize this uncertainty. Finally, some relevant country factors have not been considered due to limited data coverage across the countries included in the sample.
10
Analysing the time-varying difference, however, revealed that this outperformance is not persistent over time but stems entirely from the period covering the global financial crisis. Furthermore, the liquidity screens using a market capitalization based rulebook also contribute positively to performance, although significantly less than the debt screens. In contrast, interest screens appear to have little or no impact on financial performance. Taken together, the findings presented in this chapter suggest that the accounting based screening process does not harm investors’ financial performance. Rather, it appears to serve as a risk management function in periods of market turmoil, excluding firms subject to risky characteristics. This appears to be true, however, only when market capitalization is used as a divisor.
1.3 Implications of research findings for different agents
11
conventional investor, on the other hand, could incorporate Islamic investment principles to (possibly) achieve better than benchmark returns. The second group of agents likely to benefit from the findings is fund managers, both Islamic and conventional. Islamic fund managers could benefit particularly from the findings in Chapter 6, which reveal that certain screening methodologies are more efficient than others in terms of return and risk. Following the logic in the previous paragraph, this presents an opportunity similar to the conventional investor. That is, to incorporate certain screens to achieve better than (Islamic) benchmark returns. As for conventional fund managers, the results of all empirical chapters suggest that incorporating Islamic investment principles into investment decision making could improve their risk management, particularity in periods of financial turmoil.
12
conducting research on Islamic investments. It has been illustrated that carefully acknowledging the nature of the Islamic screening process, such as the impact of individual screens, could be beneficial when examining performance related aspects.
1.4 Thesis structure
This Ph.D. thesis proceeds as follows. Chapter 2 provides a background to Islamic equity investing and a critical examination of the Shari’ah screening process. Chapter 3 covers the theoretical background underpinning this thesis, starting with a review on the literature on expected return models followed by a discussion of performance measures. Chapter 4 presents the first empirical essay, entitled An Islamic Equity Index Performance Puzzle. Chapter 5 presents the second empirical essay, entitled
13 Chapter 2
14 2.1 Introduction
This chapter comprises two parts. Part one, entitled Institutional background, introduces the fundamental principles of Islamic finance. The purpose here is not to provide a comprehensive discussion about Islamic Finance, but rather to contextualize aspects relevant for the research that is to be carried out in this thesis. The discussion departs from the historical development, followed by the sources of Islamic jurisprudence and the main prohibitions which make up the foundations of the Islamic finance model. This section also introduces the basic principles Islamic equity investing followed by an overview of the Islamic finance market and its main investment vehicles.
15
Figure 2.1 Elements covered in the chapter
The following figure provides an overview of the chapter. Part one covers the institutional background, including the emerging of the industry, an overview of the Islamic equity market and its investment vehicles. Part one also provides a by brief introduction to Islamic jurisprudence and how it shapes the practise of Islamic equity investing. Part two providers a critical examination of the Shari’ah-based screening process, including both conceptual differences and the stringency (i.e., impact) of the different screens.
2.2 Part I: Institutional background
2.2.1 Emergence of modern Islamic finance
The economic principles embedded in Islamic values have been practised for many centuries. During the early medieval period, riba-free transactions were common between European and Arab traders along the silk road (Abdul-Rahman, 2009). Modern roots of Islamic finance can be traced back to the mid-1960s. The
Conceptual differences Conceptual differences
Screening stringency Screening stringency Part I:
Institutional background
Islamic jurisprudence: Quran, Sunnah, Hadith
Prohibitions: Riba, Gharar Maysir, Haram products/services
Shari'ah screening: Business activity, Accounting-based
Business activity screening Accounting-based screening Emergence of modern
Islamic finance
Shari'ah advisory boards Islamic equity market:
Mutual funds, Equity indices
Chapter 2
Part II: Examination of Shari'ah
16
establishment of the Egypt bank Mit Ghamr in 1963 is widely considered to mark the birth of modern Islamic finance (Iqbal & Mirakhor, 2011; Venardos, 2011). The bank offered interest-free loans to promote the productivity of rural farmers. Other important establishments in this early era of the Islamic finance industry include the
Pilgrim’s Management and Fund Board (Malaysia) in 1969, The Nasir Social Bank
(Egypt) in 1971 and the Dubai Islamic Bank (United Arab Emirates) in 1975 (Iqbal & Mirakhor, 2011). The great success that then followed was largely due to booming oil prices starting in 1973. This resulted in a large inflow of so-called petrodollars from oil-producing Gulf countries into interest-free banking systems, which resulted in “[a]rmies of commercial bankers and investment bankers landed in these oil-producing countries to expand the existing small riba-based banking operations and to link them efficiently with the international banking system” (Abdul-Rahman, 2009, p. 62). With the rapid increase in demand for Shari’ah-based financial products and services came a need to formalize Shari’ah principles within the context of banking and finance. It was during this period that many of todays’ Islamic investment practises were developed by Shari’ah scholars (Abdul-Rahman, 2009).
2.2.2 Foundations of Islamic Jurisprudence
17
2009). The Hadith (tradition) are written work parts of the Sunnah. Naturally, the Holy Quran and the Sunnah cannot provide guidelines for all situations and aspects of life. In such situations, Islamic jurisprudence relies on a set of secondary sources. These include Qiyas; a form analogy in which the Hadith and the Quran are put in relation to each other, Ijma; a form agreement or consensus among Islamic scholars, and Ijtihad; a form of independent reasoning of how to interpret the Holy Quran. Furthermore, an important element of Islamic finance is Fiqh, which can be described as the science of understanding these sources (El-Gamal, 2006; Iqbal & Mirakhor, 2011; Warde, 2010).
2.2.3 The main prohibitions in Islamic finance
To ensure compliance with the principles and objectives of Shari’ah, Islamic finance rests on a number of prohibitions. Together these prohibitions shape the structure and asset allocation of Islamic investment vehicles (Iqbal & Mirakhor, 2011). The
prohibition of riba (often translated to usury or interest) states that any form of gain
18
an Islamic perspective, the prohibition of riba also serves an important role in enhancing the justice between partners in business transactions. For instance, Zaher and Kabir Hassan (2001, p. 157) point out that “the removal of riba results in the sharing of the risk of a project between the borrower and the lender”. Further, Ayub (2009, p. 44) notes that “there is no difference of opinion among Muslims about the prohibition of riba and all Muslim sects consider indulgence in riba-based transactions a severe sin”. Advocates of Islamic finance principles stresses that the ban of riba has positive economic implications, such as returns dependent on productivity (Zaher & Kabir Hassan, 2001).
The prohibition of gharar (uncertainty) stipulates that transactions subject to
19
uncertainty. Finally, the prohibition of haram products and services states that investors should not invest in products that do not comply with Shari’ah.
2.2.4 Fundamentals of Islamic equity investing
From an Islamic perspective, equities are a suitable asset class to invest in since
musharakah, a form of partnership structure deeply rooted in Islamic finance, suggests
that potential profits or losses should be shared among all parties involved in a given investment (Iqbal & Mirakhor, 2011; Jaffer, 2004). Nevertheless, the prohibitions discussed in Section 2.2.3 (i.e., riba, gharar, maysir, non-permissible income) imply that many stocks available to the public do not qualify as Shari’ah-compliant. The exclusion of such firms is a critical element for Islamic fund managers and index providers when constructing Shari’ah-compliant asset universes, whereby they engage with so-called Shari’ah screening. In its essence, this screening process can be described as a two-level analysis concerned with (i) the degree of involvement in unethical business activities and (ii) level of engagement in non-permissible financial activities.
20
Beyond considering the ethical dimension of firms’ business activities, Shari’ah stock screening also considers the financial structure of firms. The accounting ratios used in this part of the screening process address issues related financial leverage, liquidity and interest income, all of which are associated with riba. Since almost all publicly traded firms are exposed to riba simply by being part of the interest-based global economy, these accounting ratios include so-called threshold levels. Figure 2.2 Overview of the Islamic screening process illustrates a generalized version of the
21
Figure 2.2 Overview of the Islamic screening process
The following figure illustrates the process of constructing a Shari’ah-compliant asset universe. Stocks that are rejected in the business activity screening are not considered in the accounting based screening process. Stocks constituting the Shari’ah-compliant asset universe have passed all screening levels.
2.2.5 The function of Shari’ah Advisory Boards
Shari’ah Advisory Boards form a key function in all Islamic finance institutions. Comprised of Shari’ah scholars, their principal role is to ensure that all activities are performed in line with Islamic principles. This includes overseeing financial activities and issuing fatwas (i.e., religious rulings) regarding the Shari’ah-compliance of products or services offered by the institution. One such example would be defining the screening methodology of Islamic funds and indices (further discussed in Section 2.3).
Shariah-compliant asset universe Accounting ratio: (non-permissble income)
Rejected
Rejected
Rejected
Rejected Unconstrained asset universe
Business activity screening Rejected
Accounting ratio: (debt)
Accounting ratio: (liquidity)
22
2.2.6 Current state of the Islamic equity market
The first major milestone of Islamic equity investing took place in 1992 when the Council of the Islamic Fiqh Academia (CIFA)5 issued a fatwa (a form of legal
opinion) and hence approved equity investing as an investment mode compliant with Islamic principles (Naughton & Naughton, 2000). Theoretically, the Islamic equity market is represented by all public stocks that are permissible with Shari’ah
(Shanmugam & Zahari, 2009). However, most Islamic investors gain access the equity market by investing in mutual funds offering Shari’ah-compliant investment strategies. These funds originate from the concept of musharakah, which is a form of partnership structure common in Islamic finance that emphasizes the sharing of profits and losses between all parties (Khatkhatay & Nisar, 2007). In this context, investors in the fund are the partners and where the fund managers act as investment agents on behalf of the investors. Apart from ensuring compliance with Shari’ah, Islamic mutual funds have the same investment goals as conventional funds in the context of maximizing risk-adjusted returns.
Islamic mutual funds have for long been the fastest growing segment of the Islamic finance industry (Elfakhani, Hassan, & Sidani, 2005). As displayed in Figure 2.3, between 2007 and 2013 the total asset under management (AUM) of Shari’ah -compliant funds doubled from US$28 billion to US$56 billion. During the same period, the number of Shari’ah-compliant funds has increased from 576 to 1065. Despite a temporary decline in number of funds, the total AUM increased steadily in
23
24
Figure 2.3. AUM of global Shari’ah-compliant funds
The following figure reports the number of Islamic mutual funds and their assets under management (AUM) in US$ billions between from the end of 2007 to the end of 2013. During this period that the AUM has doubled in value from US$ billion 28 in 2007 to US$ billions in 2013. During the same period, the number of funds has increased by 85% from 576 in 2007 to 1065 in 2013. Source: Thomson Reuters
Figure 2.4 Domicile of Shari’ah-compliant funds
The following figure reports the number of Islamic mutual funds per country and their assets under management (AUM) in US$ Millions as of 2013. The data illustrates that Malaysia and Saudi Arabia are the biggest hubs of Islamic mutual funds, with approximately 30% (Malaysia) and 18% (Saudi Arabia) of the funds/AUM. With 91 funds but only US$ Millions 248 AUM, the average fund in the rest of the world is significantly relative the countries presented in the figure. Source: Thomson Reuters
0 200 400 600 800 1000 1200 0 10 20 30 40 50 60
2007 2008 2009 2010 2011 2012 2013
Nu m be r o f f un ds AU M U S$ B ill io ns
AUM (US$ billion) Shariah-compliant funds
0 50 100 150 200 250 300 0 2,000 4,000 6,000 8,000 10,000 12,000 Nu m be r o f f un ds AU M U S$ M ill io ns
[image:35.612.142.493.398.618.2]25
Stock market indices make up several important functions in capital markets around the world. First, by comparing the performance of portfolios relative stock market indices, investors can obtain important information regarding the return and characteristics of their investment strategies. Second, stock market indices also signal that its universe is accessible to institutional and international investors. It is common practise among institutional investors to invest only in stocks that are listed on stock market indices. Third, indices also serve as the underlying factor for many investment instruments, such as index funds and exchange-traded funds.
A major concern when Islamic mutual funds started to appear was the lack of proper market benchmark. Initially, the investment community often relied on conventional market benchmarks which were not ideal. As a response to this, in 1999 Dow Jones launched the first index which explicitly tracked the performance of Shari’ah -compliant stocks. This marked an important step in the development of the industry as there now was a reliable market benchmark. The launch by Dow Jones was followed by FTSE in 2000, S&P in 2006, MSCI in 2007 and Russell-Jadwa in 2009. Today, these providers offer hundreds of indices which track tens of thousands of Shari’ah -compliant stocks all over the world.
26
contrast to many Islamic mutual fund managers, however, Islamic index providers are fully transparent concerning their screening methodology and Shari’ah board members. Islamic indices are becoming increasingly important given recent trends of passive index-based products.
2.3 Part II: A critical examination of Shari’ah-based stock screening
Section 2.2.4 introduced the rationale for the Shari’ah-based stock screening, the process which forms the very basis of Islamic equity investing.6 However, screening
firms for Shari’ah-compliance has proven to be a controversial issue in the industry. For instance, comparing the screening norms of nine Islamic index providers and mutual fund managers, Derigs and Marzban (2008) found disparities concerning both the business activity screening and the accounting based screening. Ultimately, this led them to conclude that “different guidelines generally results in different companies into halal [allowed] and haram [forbidden]” (p. 299). Hence, the purpose of this part of Chapter 2 is to critically examine the conceptual and empirical implications of employing different Shari’ah screening methodologies.
There are several potential factors driving inconsistencies in Shari’ah screening practises among Islamic financial institutions. Parallel to the growth of Islamic finance
27
there has been an increased presence of regulatory organizations7 with the objective to
“prepare and promulgate […] governance standards based on the Shari’a[h] precepts for Islamic financial institutions” (Karim, 2001, p. 173). However, these organizations rarely offer homogenous interpretations of Islamic sources, which has resulted in “various approaches taken by supervisory authorities to regulate Islamic banking” (Karim, 2001, p. 182). Consequently, how Islamic financial institutions choose to define their screening methodologies largely depend on which guidelines they adhere to. Furthermore, with limited enforcement power, it is likely that these regulatory standards serve more as guidelines rather than rules to follow, while the ultimate responsibility lies in the hands of the Shari’ah board of each institution, respectively.
The remaining sections proceed as follows. Section 2.3.1 discusses the collection of
Shari’ah screening data. Section 2.3.2 and 2.3.3 discusses conceptual differences between different business activity screens and financial screens currently used in the industry. Finally, Section 2.3.4 examines the stringency of the screens.
2.3.1 Collection of screening data
Classification theory stresses the importance of complete information when structuring and analysing information within a given problem complex (Bailey, 1994; Doty & Glick, 1994). When collecting screening data currently used in the industry, we therefore carefully review all potential sources of screening information. First, we review all screens covered in the existing literature, using a range of keywords related
28
to Shari’ah screening. Second, we scan through fact sheets, methodologies and
websites of all known (i.e., several hundreds) index providers and mutual fund managers offering Shari’ah-compliant investment products. Third, we review the official guidelines set by Islamic finance regulatory bodies around world.
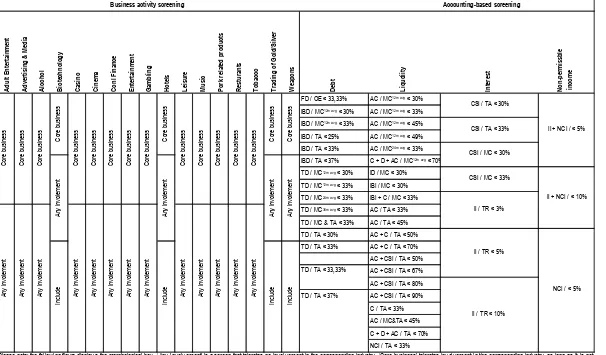
Inspired by the idea of morphological thinking, “a method for identifying and investigating the total set of possible relationships or “configurations” contained in a given problem complex” (Ritchey, 1998, p. 3), all unique screens are listed following the structure of a ‘morphological box’ (Table 2.1).8 That is, each screening type (e.g.,
debt ratio, liquidity ratio) is treated as a unique dimension within the morphological box, and each dimension is assigned so-called parameters, represented by the total number of variation of that screen. Structuring the screening data in this way comes with two advantages. First, it provides a clear overview of all screens currently used in the industry, and all dimensions and parameters can easily be conceptually compared to each other. Second, reading the table from left to right, it represents a detailed overview of each step of the screening process and the different dimensions it contains.
29
Table 2.1 Morphological box of the Shari’ah-based stock screening process
A du lt En ter tai nme nt A dver tisi ng & M ed ia A lco ho l B io tec hn ol og y C asi no C in em a C on l F in an ce En ter tai nme nt Ga mb lin g H otel s Lei su re M usi c Po rk rel ate d pr od ucts R est ur an ts To bacc o Tr ad in g of Go ld /Si lver W eap on s D eb t Li qu di ity In ter est N on -p er mi ssb le in co me
FD / OE < 33,33% AC / MC12m avg < 30%
IBD / MC12m avg < 30% AC / MC12m avg < 33%
IBD / MC12m avg < 33% AC / MC12m avg < 45%
IBD / TA < 25% AC / MC12m avg < 49%
IBD / TA < 33% AC / MC24m avg < 33%
IBD / TA < 37% C + D + AC / MC12m avg < 70%
TD / MC12m avg < 30% ID / MC < 30%
TD / MC12m avg < 33% IBI / MC < 30%
TD / MC24m avg < 33% IBI + C / MC < 33%
TD / MC36m avg < 33% AC / TA < 33%
TD / MC & TA < 33% AC / TA < 45% TD / TA < 30% AC + C / TA < 50% TD / TA < 33% AC + C / TA < 70% AC + CSI / TA < 50% TD / TA < 33,33% AC + CSI / TA < 67% AC + CSI / TA < 80% TD / TA < 37% AC + CSI / TA < 90%
C / TA < 33% AC / MC&TA < 45% C + D + AC / TA < 70% NCI / TA < 33%
Accounting-based screening
Please note: the follow ing figure display s the morphological box . ‘Any inv olv ement’ is a screen that tolerates no inv olv ement in the corresponding industry . ‘Core business’ tolerates inv olv ement in the corresponding industry as long as it is not the core business. ‘Include’ includes the corresponding industry . AC= Account receiv ables, C= Cash, CSI= Cash plus short-term inv estments, D= Deposits, FD= Financial debt, IBD= Interest bearing debt, IBI= Interest bearing inv estments, ID= Interest bearing deposits, II= Interest income, MC= Market capitalization, NCI= Non-compliant inv estments, OE= Ow ners Equity , TA= Total assets, TD= Total debt.12m avg= 12 months av erage,24m avg= 24 months av erage,36m avg= 36 months
av erage.
Business activity screening
C ore bus ine ss C ore bus ine ss C ore bus ine ss C ore bus ine ss C ore bus ine ss C ore bus ine ss C ore bus ine ss C ore bus ine ss C ore bus ine
ss CSI / TA < 30%
II + NCI / < 5% CSI / TA < 33%
CSI / MC < 30% CSI / MC < 33%
II + NCI / < 10% II / TR < 3%
An y inv ole m ent An y inv ole m ent C ore bus ine ss C ore bus ine ss C ore bus ine ss C ore bus ine ss C ore bus ine ss C ore bus ine ss C ore bus ine ss C ore bus ine ss An y inv ole m ent
NCI / < 5%
Inc lud e Inc lud e Inc lud e Inc lud e
II / TR < 10%
An y inv ole m ent An y inv ole m ent An y inv ole m ent An y inv ole m ent An y inv ole m ent
II / TR < 5%
30
2.3.2 Business activity screening
Table 2.1 shows that a total of 18 sectors is considered non-permissible with Shari’ah by various institutions in the industry. For clarification, it should be noted that some institutions are more detailed in their disclosure than others. For instance, Dow Jones states that their Islamic indices exclude the entertainment sector while MSCI list gambling, music, hotels, cinema and adult entertainment as prohibited sectors.9 It can be observed that the business activity screening used in Islamic equity investing in many ways reflect the one of socially responsible investing. Both branches exclude sectors such as adult entertainment, alcohol, gambling, tobacco and weapons.
Some sectors excluded by Islamic investors do not seem unethical at a first sight, such as advertising & media, cinema and music. The rationale for excluding such firms is that they are subject to forbidden content. There are some inconsistencies concerning the tolerance level of the business activity screening. Specifically, one approach is to exclude firms that have any involvement prohibited activities while a less stringent approach allows such activities as long as it is not the core business activity. One example of the latter would be an airline company which core business is transportation while profit also is generated from alcohol sales. Finally, Table 2.1 shows that there is a disagreement whether biotechnology, hotels, trading of gold & silver and weapons should be considered Shari’ah-compliant,
31
2.3.3 Accounting based screening
2.3.3.1 Debt screens
There are several approaches to screen firms for financial leverage. First, debt is being defined as either interest-bearing debt or total debt. The former appear somewhat more precise from a Shari’ah perspective, as it accounts only for debt associated with interest payments. In contrast, institutions using total debt assumes that all debt comes with the payment of interest. Second, in determining the value of a company, institutions employ either market capitalization or total assets. While market capitalization suggests that the market best determines the value, proponents of using total assets would argue that it is “a trusted accounting perspective and each measurement is independent from any external market influences or speculations” (Derigs & Marzban, 2008, p. 291). In what appears to be an attempt to smooth out possibly volatile outcomes of using market capitalization, some institutions use the 24 or 36 months trailing moving average, respectively. Third, there is a clear disagreement concerning the acceptance level of debt, with threshold levels varying from 25% to 37%. According to Table 2.1, the abovementioned differences result in 15 approaches to screening for debt currently used in the industry.
2.3.3.2 Liquidity screens
32
non-compliant investments.10 Clearly, there is a lack of consensus concerning which items that should be regarded as liquid assets. For instance, while some institutions use account receivables, others use account receivables plus cash and short-term investments. This lack of consensus is also reflected in the threshold levels, ranging from 30% to 90%. However, it appears that ratios that include more liquid assets have less stringent threshold levels. According to Table 2.1 there are currently 21 liquidity ratios used in the industry.
2.3.3.3 Interest and non-compliant income screens
There are fewer variations among industry participants concerning screening for interest and non-compliant income. The main difference concerns the use of either cash & short-term investments (in relation to market capitalization or total assets) or interest income (in relation to total revenue). The rationale for measuring the amount of cash & short-term investments is the assumption that firms holding such assets is likely to enjoy interest income (Derigs & Marzban, 2008).
2.3.4 Stringency of Shari’ah screens
To further increase the understanding of the impact of different screens, this part of the analysis will examine what impact business activity and accounting ratios have on a given asset universe. The analysis is based on firms included in FTSE All-World Index between January 2002 and December 2013. As noted in Section 2.3.3, many of
10 Typically, index providers and fund managers do not provide detailed information of what the
33
the financial ratios currently used in the industry are based on market capitalization. Theoretically, this implies that the stringency of these screens should vary depending on the overall market environment. Here, the length of the sample period allows us to examine the stringency of screens in periods of both bull markets (post dot.com bubble) and bear markets (subprime crisis).
34
35
Table 2.2 Stringency of business activity screening
Sector Stringency
Adult Entertainment 1.5%
Alcohol 0.9%
Biotech 0.4%
Defence 0.4%
Financials 21.8%
Gambling 0.7%
Hotels 0.6%
Media Agencies 0.4%
Pork 0.2%
Publishing 1.3%
Restaurants & Bars 0.7%
Tobacco 0.5%
Total reduction 29.4%
The following table reports the stringency of each business activity screen respectively. Collectively, these screens reduce almost 30% of the universe although the majority (21.8%) is due to the exclusion of financial stocks.
36
market capitalization. Third, for the total assets based ratios, the threshold level appear to be an important determinant of the screening stringency. The difference between the 30% and 37% threshold level varies between 9.9% (2011) and 16% (2002). Finally, the most stringent ratio is the one where both market capitalization and total assets are used a divisor. This indicates that the two types of divisor exclude different types of stocks.
37
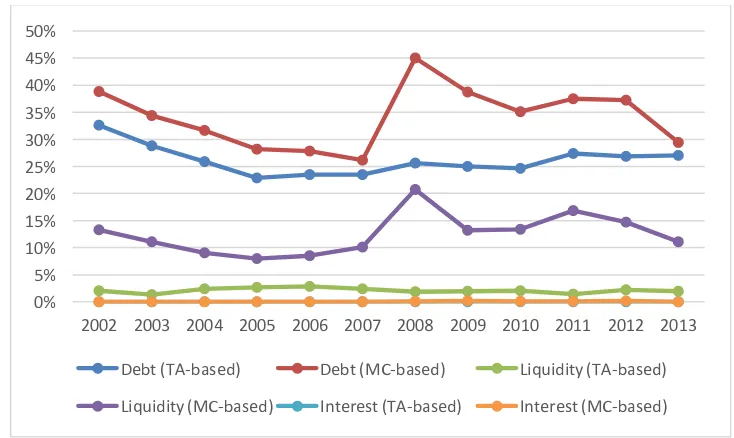
Figure 2.5 Time-varying difference in stringency between MC-based and TA-based screens at 33% threshold level
The following figure illustrates the difference in screening impact between financial ratios based on market capitalization (MC) and total assets (TA) at a 33% threshold level. Three interesting observations can be made from this figure. First, the sharp increase of the MC-based screens in 2008-2009 clearly illustrates how their stringency correlates with the valuation of the stock market. Second, with a stringency between 8% and 20%, the MC-based liquidity is significantly more stringent than its TA-based counterpart. Finally, it can be observed that neither of the interest screens has any impact at all on the asset universe.
Figure 2.5 illustrates how the impact of debt, interest and liquidity screens based on market capitalization and total assets, respectively, can fluctuate over time. Several interesting observations emerge from this figure. First, despite a fixed threshold level (i.e., 33%) there is a significant gap in stringency between market capitalization and total assets. For debt and liquidity, a market capitalization based screening rulebook result in a smaller universe throughout the entire sample period. Second, while the stringency of the total assets based screens remain relatively constant throughout the sample period, the market capitalization based screens are much more volatile. The
0% 5% 10% 15% 20% 25% 30% 35% 40% 45% 50%
2002 2003 2004 2005 2006 2007 2008 2009 2010 2011 2012 2013
Debt (TA-based) Debt (MC-based) Liquidity (TA-based)
38
sharp increase in 2008 suggest that the stringency of market capitalization based screens is largely determined by the overall market environment, where a lower valuation result in more stringent screening. At the two spikes in the global stock market valuation during that sample period cover in Figure 2.5, that is, in 2007 just before the financial crisis breakout and the end of the recovery period in 2013, the stringency of the two types of debt screens is almost identical. Although the sample period is too short to draw any definite conclusions, this observation suggests that the stringency between market capitalization and and total assets based debt screens is very similar when the valuation of the market is high. Finally, it is evident from Figure 2.5 that the interest based screening, independent from using market capitalization or total assets, has next to no impact during the duration of the sample period.
39
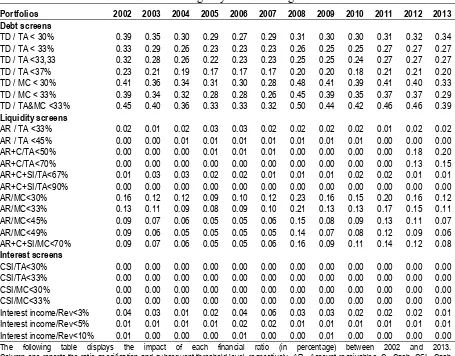
Table 2.3 Stringency of accounting based screens
Portfolios 2002 2003 2004 2005 2006 2007 2008 2009 2010 2011 2012 2013
Debt screens
TD / TA < 30% 0.39 0.35 0.30 0.29 0.27 0.29 0.31 0.30 0.30 0.31 0.32 0.34
TD / TA < 33% 0.33 0.29 0.26 0.23 0.23 0.23 0.26 0.25 0.25 0.27 0.27 0.27
TD / TA <33,33 0.32 0.28 0.26 0.22 0.23 0.23 0.25 0.25 0.24 0.27 0.27 0.27
TD / TA <37% 0.23 0.21 0.19 0.17 0.17 0.17 0.20 0.20 0.18 0.21 0.21 0.20
TD / MC < 30% 0.41 0.36 0.34 0.31 0.30 0.28 0.48 0.41 0.39 0.41 0.40 0.33
TD / MC < 33% 0.39 0.34 0.32 0.28 0.28 0.26 0.45 0.39 0.35 0.37 0.37 0.29
TD / TA&MC <33% 0.45 0.40 0.36 0.33 0.33 0.32 0.50 0.44 0.42 0.46 0.46 0.39
Liquidity screens
AR / TA <33% 0.02 0.01 0.02 0.03 0.03 0.02 0.02 0.02 0.02 0.01 0.02 0.02
AR / TA <45% 0.00 0.00 0.01 0.01 0.01 0.01 0.01 0.01 0.01 0.00 0.00 0.00
AR+C/TA<50% 0.00 0.00 0.00 0.01 0.01 0.01 0.00 0.00 0.00 0.00 0.18 0.20
AR+C/TA<70% 0.00 0.00 0.00 0.00 0.00 0.00 0.00 0.00 0.00 0.00 0.13 0.15
AR+C+SI/TA<67% 0.01 0.03 0.03 0.02 0.02 0.01 0.01 0.01 0.02 0.02 0.01 0.01
AR+C+SI/TA<90% 0.00 0.00 0.00 0.00 0.00 0.00 0.00 0.00 0.00 0.00 0.00 0.00
AR/MC<30% 0.16 0.12 0.12 0.09 0.10 0.12 0.23 0.16 0.15 0.20 0.16 0.12
AR/MC<33% 0.13 0.11 0.09 0.08 0.09 0.10 0.21 0.13 0.13 0.17 0.15 0.11
AR/MC<45% 0.09 0.07 0.06 0.05 0.05 0.06 0.15 0.08 0.09 0.13 0.11 0.07
AR/MC<49% 0.09 0.06 0.05 0.05 0.05 0.05 0.14 0.07 0.08 0.12 0.09 0.06
AR+C+SI/MC<70% 0.09 0.07 0.06 0.05 0.05 0.06 0.16 0.09 0.11 0.14 0.12 0.08
Interest screens
CSI/TA<30% 0.00 0.00 0.00 0.00 0.00 0.00 0.00 0.00 0.00 0.00 0.00 0.00
CSI/TA<33% 0.00 0.00 0.00 0.00 0.00 0.00 0.00 0.00 0.00 0.00 0.00 0.00
CSI/MC<30% 0.00 0.00 0.00 0.00 0.00 0.00 0.00 0.00 0.00 0.00 0.00 0.00
CSI/MC<33% 0.00 0.00 0.00 0.00 0.00 0.00 0.00 0.00 0.00 0.00 0.00 0.00
Interest income/Rev<3% 0.04 0.03 0.01 0.02 0.04 0.06 0.03 0.03 0.02 0.02 0.02 0.01
Interest income/Rev<5% 0.01 0.01 0.01 0.01 0.02 0.02 0.01 0.01 0.01 0.01 0.01 0.01
Interest income/Rev<10% 0.01 0.00 0.00 0.00 0.01 0.00 0.00 0.01 0.00 0.00 0.00 0.00
The following table displays the impact of each financial ratio (in percentage) between 2002 and 2013. Column one reports the ratio specification and subsequent threshold level, respectively. AR= Account receivables, C= Cash, CSI= Cash plus short-term investments, D= Deposits, FD= Financial debt, IBD= Interest bearing debt, IBI= Interest bearing investments, ID= Interest bearing deposits, II= Interest income, MC= Market capitalization, NCI= Non-compliant investments, OE= Owners Equity, TA= Total assets, TD= Total debt.
2.3.4.1 Screening impact in different sectors
40
sectors: Oil & Gas, Basic Materials, Industrials, Consumer Goods, Health Care, Consumer Services, Telecommunications, Utilities and Technology.
The results, displayed in Table 2.4, provides a number of interesting observations. First, the stringency of most financial ratios appear to be sector sensitive. For instance, at a 30% threshold level, the debt screen based on total assets excludes 19% of the technology universe and 69% of the utilities universe (i.e., a 50% difference in screening impact), and using market capitalization as divisor results in a 65% difference between healthcare (20%) and utilities (85%). Second, the results suggest that the threshold level for a given ratio is a significant determinant of stringency. For example, for the utilities sector there is a 21% difference in impact between the 30% and 37% threshold level of the total asset based debt screen. Third, in some sectors total asset based debt ratios appear to be more stringent than market capitalization based screening, such as the health care sector.
41
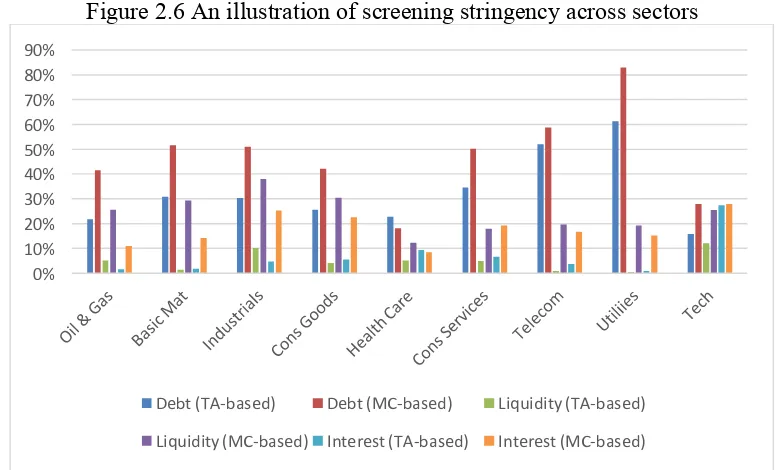
[image:52.612.128.517.222.457.2]comparison it is evident that the screening stringency is determined largely by the characteristics of a given industry. For instance, while the debt screen based on market capitalization exclude less than 20% of healthcare companies, more than 80% of firms of the firms in the utilities sector would fail to pass this screen.
Figure 2.6 An illustration of screening stringency across sectors
The following figure illustrates the mean difference in screening impact between financial ratios based on market capitalization (MC) and total assets (TA) at a 33% threshold level across different sectors. For many screens, the difference in stringency across sectors is significant. For instance, the MC-based debt screen excludes 83% of the utilities sector, but only 18% of the health care sector. Furthermore, it can be observed that the difference in stringency between the screens is significant in sectors such as utilities and telecom while being much more even in technology and healthcare sector
.
0% 10% 20% 30% 40% 50% 60% 70% 80% 90%
Debt (TA-based) Debt (MC-based) Liquidity (TA-based)
42
Table 2.4 Stringency of accounting based screens across sectors
Sectors
Oil &
Ga s Ba si c M at er ia ls In du str ia ls Co ns um er G oo ds He al th Ca re Co ns um er S er vi ce s Te le co m m un ic at io ns Ut ilit ie s Te ch no lo gy
Debt TD / TA < 30% 0.27 0.38 0.37 0.32 0.29 0.41 0.59 0.69 0.19 TD / TA < 33% 0.22 0.31 0.30 0.26 0.23 0.34 0.52 0.61 0.16 TD / TA <33,33 0.21 0.30 0.30 0.25 0.22 0.34 0.51 0.60 0.15 TD / TA <37% 0.17 0.23 0.22 0.19 0.17 0.28 0.43 0.48 0.12 TD / MC < 30% 0.45 0.55 0.54 0.45 0.20 0.52 0.63 0.85 0.30 TD / MC < 33% 0.41 0.52 0.51 0.42 0.18 0.50 0.59 0.83 0.28 TD / TA&MC <33% 0.44 0.54 0.54 0.47 0.28 0.54 0.66 0.85 0.30
Liquidity AC / TA <33% 0.05 0.01 0.10 0.04 0.05 0.05 0.01 0.01 0.12 AC / TA <45% 0.02 0.00 0.02 0.00 0.03 0.02 0.00 0.00 0.04 AC+C/TA<50% 0.06 0.02 0.05 0.04 0.06 0.04 0.04 0.03 0.10 AC+C/TA<70% 0.04 0.02 0.02 0.02 0.02 0.02 0.04 0.03 0.04 AC+C+SI/TA<67% 0.00 0.00 0.02 0.01 0.03 0.02 0.00 0.00 0.09 AC+C+SI/TA<90% 0.00 0.00 0.00 0.00 0.00 0.00 0.00 0.00 0.00 AC/MC<30% 0.28 0.33 0.41 0.34 0.13 0.20 0.21 0.22 0.28 AC/MC<33% 0.26 0.29 0.38 0.31 0.12 0.18 0.20 0.19 0.25 AC/MC<45% 0.18 0.20 0.29 0.20 0.09 0.11 0.14 0.13 0.18 AC/MC<49% 0.17 0.17 0.27 0.18 0.08 0.09 0.12 0.12 0.17 AC+C+SI/MC<70% 0.17 0.19 0.32 0.25 0.09 0.15 0.18 0.17 0.24
43
2.4 Chapter summary
Part one of this chapter was concerned with the institutional background of Islamic finance. Economic activities based on Islamic values have been performed for several centuries, although the modern form of Islamic finance started to develop as late as four decades ago. Based on the principles of Shari’ah, Islamic finance prohibits involvement in interest, speculation, uncertainty and unethical business activities. Islamic equity investing started to grow significantly after its official approval in 1992, and is now a multi-billion dollar industry with thousands of funds and indices available all over the world.
44
Chapter 3
45
3.1 Introduction
With its roots in the mean-variance efficiency paradigm of Markowitz (1952) modern asset pricing theory is concerned with describing the relationship between returns and risk of financial assets in market equilibrium. From both a chronological and fundamental perspective, it makes sense to start any such discussion with the Capital Asset Pricing Model (CAPM) developed by Sharpe (1964), Lintner (1965) and Mossin (1966). Ever since its inception, the CAPM has had a tremendous influence on how academic researchers and industry participants understand financial markets. Not only has been argued that the model “[…] marks the birth of asset pricing theory” (Fama & French 2004, p. 25) but it is also one of the most frequently used models to measure financial performance and estimating cost of capital (Bodie, Kane and Marcus, 2005). The CAPM specifics an algebraic relationship between the expected return and risk of assets in market equilibrium. Specifically, it postulates that the risk of an asset is defined by the extent to which it co-varies with the overall market. If investors are risk averse, as implied by the mean-variance efficiency logic, then investors would require higher returns for taking on risk.
46
largely come to disprove CAPMs predictions. For instance, early work such as Friend & Blume (1970) and Black, Johnson and Scholes (1972) presented empirical evidence that the slope of the security market line is flatter than predicted by the model. That is, less (more) risky assets earn higher (lower) returns than what is predicted by the model. More recent work such as Basu (1977), Banz (1981) and Jageedesh & Titman (1993) reveal the existence of market anomalies, which in the world of the CAPM should not exist. The overreaching conclusion drawn from this body of literature is that beta, the systematic risk factor within the CAPM framework, fails to explain all variations in the cross-section of asset returns. This insight led to the emergence of models that incorporate additional factors in an attempt to add explanatory power to cross-sectional differences in asset returns.
47
3.2 The Capital Asset Pricing Model
3.2.1 Theoretical foundation
The theoretical foundation of the CAPM departs from the mean-variance efficiency model introduced by Markowitz (1952) and the so-called separation theorem proposed by Tobin (1958). Markowitz’s model, which is concerned with portfolio selection under uncertainty, spans over a single period horizon where investors form a portfolio in the beginning of the period (t-1) which delivers a randomly distributed return at the end of the period (t). In this context, the model states that under the assumption that investors are risk averse, the only parameters that are ought to be of interest are the expected mean and variance (risk) of asset returns. This implies that investors choose portfolios that maximize the expected return for a given level of risk, and minimize risk for a given level of expected return (i.e., portfolios that is mean-variance efficient). Incorporating the notion of risk-free lending and borrowing risk- into the mean-variance framework, Tobin (1958) showed that there is in-fact a single efficient portfolio, the market portfolio, and that investors adjust their risk by different weights in risky and risk-free assets.
48
of Tobin’s separation theorem, investors are believed to have access to unlimited borrowing and lending at the risk-free rate (Fama & French, 2004). Third, financial markets are believed to lack imperfections, meaning that elements such as transaction costs and taxes are not present and finally, these markets are subject to perfect competition, meaning that no single investors can influence stock prices. Based on these assumptions, the CAPM specifics the following prediction regarding the expected return of risky assets:
E R# = R%+ β#(E R) − R%) (3.1)
where E R# denotes the expected return of asset i, R% is the risk free rate and R) is the return of the market portfolio m. β# represents the systematic risk and is defined as
the covariance of the return of asset i to the return of market portfolio m divided by variance the of the market portfolio m. Hence, β# is a measure of the extent to which
asset i tend to co-vary with the market portfolio. One of the key implications of this specification is that investors will be rewarded only by taking on higher systematic risk, while idiosyncratic (unsystematic) risk, as proven by the mean-variance model, can be eliminated through portfolio diversification.
3.2.2 CAPM critique and empirical validation
49
this literature stream is largely an outlet of the specific predictions made regarding the relationship between expected return and risk. Specifically, the model predicts that (i) asset returns and their respective market betas is positively and linearly related, (ii) cross-sectional differences in excess returns can be explained only by proportional differences in asset betas and (iii) the market premium (i.e., market return minus the risk-free rate) is positive, implying that its expected market return should be greater than assets uncorrelated with the market.