http://www.scirp.org/journal/as ISSN Online: 2156-8561 ISSN Print: 2156-8553
DOI: 10.4236/as.2018.91004 Jan. 17, 2018 37 Agricultural Sciences
How does the Behaviour of Dairy Cows
during Recording Affect an Image
Processing Based Calculation of the
Udder Depth?
Jennifer Salau
1, Jan Henning Haas
2, Wolfgang Junge
1, Georg Thaller
11Institute of Animal Breeding and Husbandry, Kiel University, Kiel, Germany
2Inflammation at Interfaces’ Cluster Office, Kiel University, Kiel, Germany
Abstract
Precision Livestock Farming studies are based on data that was measured from animals via technical devices. In the means of automation, it is usually not accounted for the animals’ reaction towards the devices or individual an-imal behaviour during the gathering of sensor data. In this study, 14 Hols-tein-Friesian cows were recorded with a 2D video camera while walking through a scanning passage comprising six Microsoft Kinect 3D cameras. Elementary behavioural traits like how long the cows avoided the passage, the time they needed to walk through or the number of times they stopped walk-ing were assessed from the video footage and analysed with respect to the tar-get variable “udder depth” that was calculated from the recorded 3D data us-ing an automated procedure. Ten repeated passages were recorded of each cow. During the repetitions, the cows adjusted individually (p < 0.001) to the recording situations. The averaged total time to complete a passage (p = 0.05) and the averaged number of stops (p = 0.07) depended on the lactation num-bers of the cows. The measurement precision of target variable “udder depth” was affected by the time the cows avoided the recording (p = 0.06) and by the time it took them to walk through the scanning passage (p = 0.03). Effects of animal behaviour during the collection of sensor data can alter the results and should, thus, be considered in the development of sensor based devices.
Keywords
Dairy Cow, Sensor Data, Image Processing, Animal Temperament, Measurement Precision
How to cite this paper: Salau, J., Haas, J.H., Junge, W. and Thaller, G. (2018) How does the Behaviour of Dairy Cows during Recording Affect an Image Processing Based Calculation of the Udder Depth? Agricul-tural Sciences, 9, 37-52.
https://doi.org/10.4236/as.2018.91004
Received: November 30, 2017 Accepted: January 14, 2018 Published: January 17, 2018
Copyright © 2018 by authors and Scientific Research Publishing Inc. This work is licensed under the Creative Commons Attribution International License (CC BY 4.0).
DOI: 10.4236/as.2018.91004 38 Agricultural Sciences
1. Introduction
As the world population is growing rapidly, Precision Livestock Farming ad-dresses the task of providing a sustainable food production [1]. The objective of Precision Livestock Farming is to automatically inform farmers on the current health [2] or welfare status [3] of their animals and to help them make decisions based on analysed sensor data. Many developments have been presented in mul-tidisciplinary studies using various cameras [4] [5], microphones [6], accelero-meters [7] [8], and different other kinds of sensors. Unfortunately, most projects were never successfully implemented in the field. On the one hand, all develop-ments need to be accepted and handled by the farmers [9]. Even if farmers are motivated to enhance their performance, they often lack time or experience to change operating procedures [10]. On the other hand, many projects do not reach the state of full development. Problems that arise are for example imprac-tically high computational costs of a working solution or too much unexplained variance in the results as well as between animal variations in the measurement precision with regard to the target variable. The present study investigates the possible influence of animal behaviour during the collection of sensor data on the target variable.
DOI: 10.4236/as.2018.91004 39 Agricultural Sciences times the cows stopped walking during recording are used. It is investigated how the cows adjust to being recorded with the cow scanner without any conspecifics present. Furthermore, the target variable “udder depth” calculated from the re-cordings is analysed with respect to an effect of the behaviour of the recorded cow.
2. Material and Methods
2.1. Recording Unit
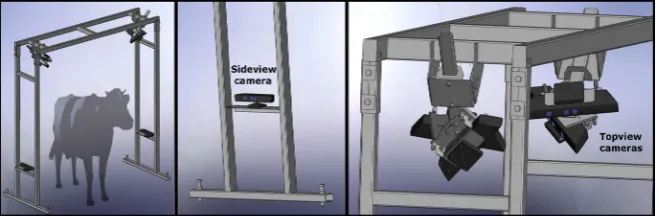
As recording unit (Figure 1) a framework with 2.08 m passage height and 2.05 m passage width was equipped with six Microsoft Kinect v1 cameras. On both sides single Kinect cameras were located in 0.6 m height to deliver a close up of udder, rump, and legs (sideview cameras). Additionally, paired Kinect cameras were positioned in the upper corners of the framework (topview cameras). As they are mounted with an angle of 56˚ between their fronts, one camera of each pair saw the approaching cow and the other camera recorded the cow after it has passed the center of the framework. A more detailed description of the recording unit can be found in [17].
Recording Chamber
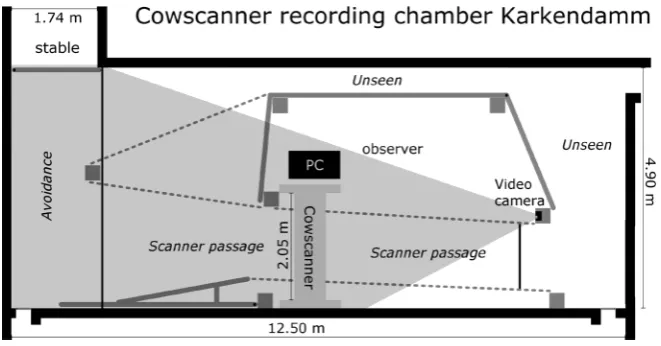
On the research farm Karkendamm of Kiel University, a separate room (12.5 m ×4.9 m) with a direct entrance to the cow’s stable was designed as a recording chamber. The cow scanner was installed along the side of the room and a firm round path was constructed to guide the cows through the cow scanner without being led by halter (Figure 2). An additional video camera (Creative Live! Cam Chat HD, 720pUSB Webcam, run by Central 3 Lite software) was installed on one end of the passage through the scanner and gathered video footage of the scene during recording took place. From this footage parameters regarding the behaviour of the cows during recording (behavioural traits) were assessed (sec-tion 2.2.3) by visual inspec(sec-tion. The round path was divided into the areas
Scanner passage, Avoidance, and Unseen. Scanner passage was the area in which the cow was in the field of view of at least one of the Kinect cameras. Avoidance
[image:3.595.209.539.566.674.2]was the area the cows stepped in when entering the recording chamber. Both
DOI: 10.4236/as.2018.91004 40 Agricultural Sciences
Figure 2. Schematic representation of the installation of the recording unit. The cows could access the recording chamber directly from the stable. Spring gates (dashed grey lines) and pipes (solid grey lines) formed a round path that guided them through the framework. Imaginary lines (thin black lines) partition the round path in the areas Avoidance, Scanning passage, and Unseen. A video camera was mounted at the right end of Scanning passage. The surveilled area is covered in grey.
areas Avoidance and Scanner passage were in the field of view of the video cam-era. Unseen was the area in which the cows were not recorded by the video camera.
2.2. Data Collection
2.2.1. Recorded Cows
In total 18 Holstein-Frisian cows were recorded once a month between Novem-ber 2015 and May 2016. The cows were led into the recording chamNovem-ber and walked through the scanner counter clockwise. The same handling person was present for every recording and only motivating the cow to move again, once it stopped walking. One cow was excluded from analysis, because it was randomly chosen as source for the udder model that was needed for the model based 3D object recognition [19]. Due to loss of video footage no behavioural traits were available for another three cows. The remaining 14 cows completed 9 to 11 cycles (10.1 ±0.5) through the scanner. Cows were in their first to fifth lactation (2.6 ±1.3) and between 144 cm and 149 cm in height (146.6 ±1.9 cm). The milk yields during morning milking on the day of recording ranged from 13.5 kg to 32.7 kg (23.6 ±6.9 kg). The body mass of the cows after morning milking on the day of recording varied between 540 kg and 831 kg (659.1 ±72.1 kg).
2.2.2. Calculating “Udder Depth”
algo-DOI: 10.4236/as.2018.91004 41 Agricultural Sciences rithm for “udder depth” determination can be found in [19]. Cow wise means UD in “udder depth” were calculated from all suitable images.
2.2.3. Behavioural Traits
The video recordings were analysed by visual inspection to determine parame-ters regarding the behaviour the cows showed during recording with the cow scanner. The cycle wise gathered parameters (avoidance, runtime, totaltime, stops) are listed below:
Parameters regarding the behaviour observed during a cycle C
• avoidance(C): The time in seconds the cow spend in the area Avoidance
during cycle C, i.e. the time the cow avoided to approach the cow scanner.
• runtime(C): The time in seconds the cow spend in the area Scanner passage
during cycle C, i.e. the time the cow needed to pass the scanner.
• totaltime(C): The sum consisting of avoidance(C), runtime(C) and the time the cow spend in the area Unseen, i.e. the time it took the cow to complete cycle C.
• stops(C): The number of times the cow stopped within the Scanner passage
during cycle C.
avoidance(C) started as soon as the front end of the cow appeared in the field of view of the video camera and ended when the cow stepped into Scanner pas-sage with the front legs. runtime(C) ended when the rear end of the cow disap-peared from Scanner passage. To receive animal wise behavioural traits, the cycle wise gathered parameters were for each animal (cow) averaged over all cycles the respective cow had performed (ncow). Definitions can be found in Eq-uations (1)-(4):
Avoid_time (cow) := * cow
( )
cow 1
1 n C
C
n
∑
= avoidance (1)Run_time (cow) := * cow
( )
cow 1
1 n C
C
n
∑
= runtime (2)Total_time (cow) := * cow
( )
cow 1
1n
∑
nC= totaltime C (3)No_stops (cow) := cow
( )
cow 1
1 n C
C
n
∑
= stops (4)2.3. Statistical Analysis
All statistical calculations were conducted using [20].
2.3.1. Statistical Analysis of Cycle Wise Values
DOI: 10.4236/as.2018.91004 42 Agricultural Sciences conditional probability (p-value), that the data under analysis is consistent with the null hypothesis. Small p-values suggest that the null hypothesis can be re-jected. Effect sizes 2
P
ω (partial ω2; [21]) were calculated where the p-value did not exceed 0.07. As the effect size η2 is prone to overestimating the proportion of explained variance, ω2 was proposed by [22] which is determined by using un-biased estimators of the variance components associated with the sources of var-iation in the design. However, comparability across analyses is limited with ω2, because the total variance of the analysis—used as denominator in the computa-tion of ω2—changes with the design of the study. As a solution to the compara-bility problem 2
P
ω was recommended. With regard to the within-subject design of the analyses the formula,
2 P
ω = dffactor∗(MSfactor−MSerror)/SSfactor+ (N −dffactor) ∗MSerror (5) was used [23], where dffactor, MSfactor, and SSfactor denote the degrees of freedom, the mean squares, and the sum of squares due to the corresponding factor. MS er-ror and SSerror denote mean squares and sum of squares of the error, and N de-notes the total number of observations.
2.3.2. Statistical Analysis of Cycle Wise Values
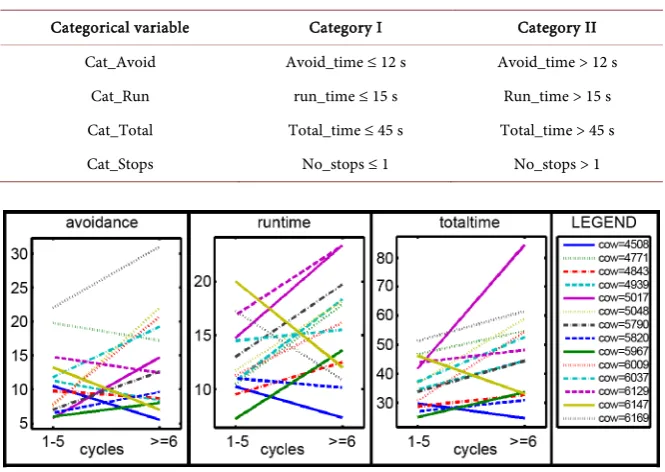
Data set. The data set held cow wise means in “udder depth” (UD). As a para-meter for the measurement precision, the standard error (SEUD) was merged as well as the percentage of images used for the calculation of UD regarding the to-tal number of images available for the respective cow (compUD, min (compUD) = 0.62, max (compUD) = 1, mean (compUD) = 0.89 ± 0.09). The lactation number (LacNo) of the cows, the sacrum heights (ST), the body mass (mass) after morning milking on the day of recording, and the milk yield (milk KG) during morning milking on the day of recording were also included. The cow wise be-havioural traits Avoid_time, Run_time, Total_time, and No_stops were merged to the data set. Additionally, each behavioural trait was transformed into a two-class categorical variable. The class distinction is presented in Table 1. The categorical variables were named Cat_Avoid, Cat_Run, Cat_Total, and Cat_Stops and were included in the data set.
DOI: 10.4236/as.2018.91004 43 Agricultural Sciences (AIC), Bayesian Information Criterion (BIC), adjusted coefficient of determina-tion (adjR2), the statistic (Fstat) of the F-test that checks if at least one coefficient is nonzero as well as the corresponding p-value (pFstat), and root mean squared error (RMSE). Furthermore, for UD and SEUD least square means (lsmeans) with respect to the factors LacNo and Run_time, respectively, LacNo and Avoid_time were computed. The covariates mass, milkKG, and ST were included for UD. For SEUD the categorical variable Cat_Run and compUD were included as cova-riates. 3D barplots were generated to illustrate the dependencies from the fac-tors.
3. Results
[image:7.595.207.540.440.676.2]Interaction between the factors “cow” and “cycle” for avoidance, runtime, and totaltime are presented in Figure 3. Qualitative and quantitative interactions were present for all three parameters. For six cows (5017, 5048, 5790, 5967, 6009, 6037) higher values in all three parameters were observed in “cycles ≥ 6” com-pared to “cycles 1 - 5”. Another group of six cows (4771, 4843, 4939, 5820, 6129, 6169) show increases from “cycles ≥6” to “cycles 1 - 5” in two of the parameters but a decrease in the third. For only two cows (4508, 6147) the values in all three parameters were decreasing. No parallel lines were found. The descriptive statis-tics as well as the results of the analyses of variance concerning the cycle wise parameters avoidance, runtime, totaltime, and stops can be found in Table 2.
Table 1. The behavioural traits Avoid_time, Run_time, Total_time, and No_stops were split into two categories each, defining the categorical variables Cat_Avoid, Cat_Run, Cat_Total, and Cat_Stops.
Categorical variable Category I Category II
Cat_Avoid Avoid_time ≤ 12 s Avoid_time > 12 s
Cat_Run run_time ≤ 15 s Run_time > 15 s
Cat_Total Total_time ≤ 45 s Total_time > 45 s
Cat_Stops No_stops ≤ 1 No_stops > 1
DOI: 10.4236/as.2018.91004 44 Agricultural Sciences
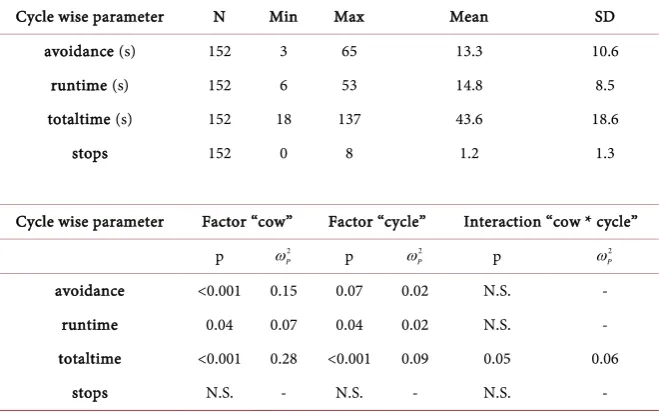
Table 2. Descriptive statistics, p-value regarding the effects of “cow” and “cycle”, and ef-fect sizes 2
P
ω for cycle wise gathered parameters in cow behaviour.1
Cycle wise parameter N Min Max Mean SD
avoidance (s) 152 3 65 13.3 10.6
runtime (s) 152 6 53 14.8 8.5
totaltime (s) 152 18 137 43.6 18.6
stops 152 0 8 1.2 1.3
Cycle wise parameter Factor “cow” Factor “cycle” Interaction “cow * cycle”
p 2
P
ω p 2
P
ω p 2
P
ω
avoidance <0.001 0.15 0.07 0.02 N.S. -
runtime 0.04 0.07 0.04 0.02 N.S. -
totaltime <0.001 0.28 <0.001 0.09 0.05 0.06
stops N.S. - N.S. - N.S. -
1: The number of observations (N), minimum (Min), maximum (Max), mean value (Mean), and standard deviation (SD) are given (rows 1 - 5). Rows 6 - 11 hold p-values and effect sizes ( 2
P
ω ). N.S. denotes that the factor had no significant effect.
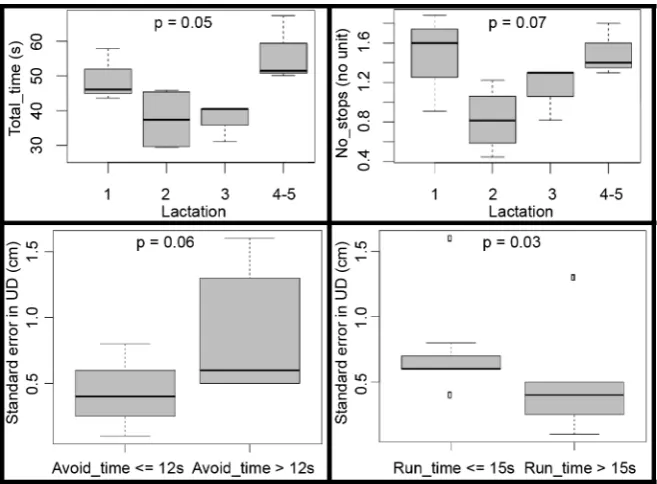
The behavioural traits Total_time and No_Stops significantly depended on the lactation number with p-values p = 0.05 and p = 0.07, respectively. Both traits were observed on a higher level in the first and the combined fourth and fifth lactation than the second and third lactation. The boxplots (Figure 4, top row) revealed monotonous increases from second to fourth and fifth lactation in both traits. In No_stops the highest mean was observed for primiparous cows, whilst cows in their fourth or fifth lactation showed the highest mean in Total_time. Significant effects of the behavioural traits Avoid_time and Run_time on SEUD were found with p-values p = 0.06 and p = 0.03, respectively. While higher stan-dard errors in UD were observed with the cows that avoided to pass the scanner longer than 12 seconds, a Run_time greater than 15 seconds led to lower stan-dard errors in UD (Figure 4, bottom row). The model with the best Good-ness-of-Fit measures for UD was given by
UDijklm = µ + LacNoi + massj + milkKGk + Cat_Runl + STm + εijklm, (6) where UDijklm are the cow wise means of the “udder depth”, µ is the overall mean, LacNoi is the fixed effect of ith lactation, massj is the fixed effect of the jth body mass after morning milking on the day of recording, milk KGk is the fixed effect of the kth milk yield during morning milking on the day of recording, Cat_Runl is the fixed effect of the lth category of the behavioural trait Run_time, STm is the fixed effect of the mth sacrum height, and εijklm is the random residual effect. The model with the best Goodness-of-Fit measures for SEUD was given by
UD
SEijkl = µ + LacNoi + Cat_Avoidj + Cat_Runk +
UD
DOI: 10.4236/as.2018.91004 45 Agricultural Sciences
where UD
SEijkl are the standard errors of UD, µ is the overall mean, LacNoi is the fixed effect of ith lactation, Cat_Avoidj is the fixed effect of the jth category of the variable Avoid_time, Cat_Runk is the fixed effect of the kth category of the behavioural trait Run_time, compUD
[image:9.595.209.538.263.505.2]l is the fixed effect of the lth percentage of images from which a value for “udder depth” was computed, and εijkl is the ran-dom residual effect. Goodness-of-Fit measures for both models can be found in Table 3.
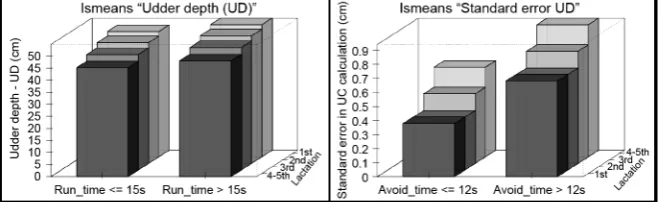
Figure 5 presents dependencies of the lsmeans for UD and SEUD across the factors LacNo and Run_time, respectively, Avoid_time. For both categories of Run_time, the adjusted means in UD were strictly monotonously decreasing with increasing lactation number. For every lactation number, smaller lsmeans in UD were observed with Run_time values lower or equal to 15 seconds. The
[image:9.595.208.539.630.682.2]Figure 4. The boxes upper and lower boundaries mark the 75% and 25% quartiles, re-spectively. The black line denotes the medians. Whisker lengths correspond to 1.5 times the boxes’ interquartile ranges. Outliers are marked with rectangles. Top row: Boxplots illustrating the differences in Total_time (left) and No_stops (right) depending on the lactation number. Bottom row: Boxplots illustrating the differences in standard error of UD depending on the behavioural traits Avoid_time (left) and Run_time (right).
Table 3. Goodness-of-Fit measures for the multiple linear regression models describing UD and SEUD.2
Model AIC BIC adjR2 Fstat p
Fstat RMSE
Model for UD 51.52 54.31 0.89 18.33 0.003 1.33
Model for SEUD 6.08 9.91 0.64 6.67 0.009 1.33
DOI: 10.4236/as.2018.91004 46 Agricultural Sciences
Figure 5. 3D barplots of the least square means of UD (left) and SEUD (right) regarding the factors lactation number and Run_time, respectively, Avoid_time. For the sake of better visibility, the arrangement of bars with respect to the lactation number was re-versed in the left 3D barplot. The statistics for the models applied to calculate the least square means for UD and SEUD were adjusted coefficient of determination adjR2 = 0.82, F-test statistic Fstat = 7.39, and p-value pFstat = 0.06, respectively, adjR2 = 0.53, Fstat = 3.43, and pFstat = 0.06.
adjusted cow wise means in SEUD increased monotonously with increasing lacta-tion number. For every laclacta-tion number, the lsmeans in SEUD were smaller with Avoid_time values lower or equal to 12 seconds. The statistics for the models applied to calculate the least square means for UD and SEUD were adjusted coef-ficient of determination adjR2 = 0.82, F-test statistic Fstat = 7.39, and p-value pFstat = 0.06, respectively, adjR2 = 0.53, Fstat = 3.43, and pFstat = 0.06.
4. Discussion
DOI: 10.4236/as.2018.91004 47 Agricultural Sciences whereas lines with positive gradient possibly correspond to the cows’ unwilling-ness to participate any longer. Possible stressors might have been the length of the data collection and that recording was carried out without returning to the conspecifics between the completion of cycles. Reference [26] stated that cows showed stronger attention towards the task to perform with a conspecific de-monstrator present. It was also proven, that cows adjust their behaviour to ex-ternal motivation like the access to pasture [27] or food reward [28]. In contrast, the presented setting did not provide any motivation for the cows to participate. As the recorded cows were kept in a loose-housing barn, locomotor activity was no motivation itself [29]. Frustration in cows was, thus, likely to occur. Within specific subgroups of cows change in parameter values had the same sign but differed in amount (quantitative interaction), but similarities between the re-spective cows were not explained by herd management data (lactation number, height, body mass, and milk yield; results not shown). The recorded cows also behaved inhomogeneously when avoidance, runtime, and totaltime were con-sidered simultaneously. Exemplarily, higher values in avoidance, runtime, and totaltime in “cycles ≥6” were observed for half of the animals, indicating that these cows expressed unwillingness within every section of the round path (Figure 2). However, the second main group of animals showed increases in two of the three parameters, but a decrease from “cycles 1 - 5” to “cycles ≥6” in the third one. Again, no significant differences in lactation number, height, body mass or milk yield were indicated between these groups of cows (results not shown) to provide an explanation. The findings were likely to be related to the animals temperament regarding fear, social behaviour, and stress resistance [13] [14]. As no temperament tests were performed in this study, and no former evaluation of the temperament of the recorded cows was available, it remained an item for specially designed future studies to reaffirm these connections. The dependency on the individual animal is supported by the effect sizes 2
P
ω .
DOI: 10.4236/as.2018.91004 48 Agricultural Sciences these might carry less weight in the averaged behavioural trait No_stops, and the effect of the age in terms of lactation number became visible (Figure 4, top row). The significant differences in Total_time due to lactation number might be ex-plained by dissimilar agility and experience of cows of different ages. The pri-miparous cows were less experienced and, thus, more uncertain of the situation. They probably acted more hesitantly which led to a reduced total time compared to cows in their second to third lactation. The individual walking speed of younger cows might have been higher than that of animals in the fourth or fifth lactation due to juvenile energy and, because less pregnancies strained the loco-motor system.
When it came to the effects of cow behaviour on the calculated “udder depth” and its measurement precision, significant dependency of SEUD on Avoid_time and Run_time, i.e. cow wise averaged avoidance and runtime, was observed. The standard error SEUD served as a measure of precision in the determination of cow wise averaged “udder depth” UD, whereat low SEUD corresponded to high measurement precision. The p-value with regard to Avoid_time (p = 0.06) was again larger than the usually reported limit 0.05. However, the authors
consi-dered it an interesting observation that SEUD increased with increasing
DOI: 10.4236/as.2018.91004 49 Agricultural Sciences traits, large differences in least square means between categories I and II in Avoid_time (Table 1) were observed for SEUD, but UD was only slightly larger for the category with longer Run_time values. Least square means of UD further showed that the udder lowered towards the ground with increasing lactation number. This was expected, and was already found and discussed in [19]. Least square means in SEUD were increasing with increasing lactation number indicat-ing that measurement precision decreased. Since the udder tissue became more stretched with every additional lactation, this was anticipated. The udder tissue was stressed during milking [34] and refilling, and occurrences of mastitis which affected the udder firmness [35] were more likely with increasing lactation number. Stretched tissue and less firm udders varied more strongly during ani-mal movement and were less defined in shape, leading to reduced precision in object recognition as well as udder bottom definition and, thus, to reduced measurement precision in UD.
In Precision Livestock Farming studies often the question arose why imple-mented analyzing algorithms produced precise and meaningful results for some animals whilst with other animals an additional source of variance seemed to have altered the results, although the measuring conditions were the same for all animals. Using the cow scanner recordings as an example, the authors’ aim was to show that successful analyses of sensor based data in an animal related con-text might not only depend on the precision of the sensor, but also on the beha-viour of the animals during gathering the sensor data. Individual animal tempe-rament is likely to introduced variance to the sensor data that might be difficult to explain during data analysis. However, developments that might be sold to farmers later need to deliver reliable results for the whole herd. As it was with most sensors impossible to measure animal temperament during data collection or to conduct contemporary external temperament tests, it seemed difficult to model the target variable including the temperament. The authors recommend to record general behavioural traits during test phases of product development in order to quantify the effects and to be able to better understand and report the variability in measurement precision across animals.
5. Conclusion
DOI: 10.4236/as.2018.91004 50 Agricultural Sciences target variable is calculated, behavioural parameters should be observed during the test phase of a developed product so that the underlying effect on the mea-surement precision can in retrospect be described.
Acknowledgements
Gratitude is expressed to Stiftung Schleswig-Holsteinische Landschaft and to Rinderzucht Schleswig-Holstein eG for advice and financial support.
References
[1] Berckmans, D. (2008) Precision Livestock Farming (PLF). Computers and Elec-tronics in Agriculture, 62, 1. https://doi.org/10.1016/j.compag.2007.09.002
[2] Neethirajan, S. (2017) Recent Advances in Wearable Sensors for Animal Health Management. Sensing and Bio-Sensing Research, 12, 15-29.
https://doi.org/10.1016/j.sbsr.2016.11.004
[3] Fournel, S., Rousseau, A.N. and Laberge, B. (2017) Rethinking Environment Con-trol Strategy of Confined Animal Housing Systems through Precision Livestock Farming. Biosystems Engineering, 155, 96-123.
https://doi.org/10.1016/j.biosystemseng.2016.12.005
[4] Snoek, D.J.W., Hofstee, J.W., van Dueren den Hollander, A.W., Vernooij, R.E., Ogink, N.W.M. and Groot Koerkamp, P.W.G. (2017) Quantification of Simulated Cow Urine Puddle Areas using a Thermal IR Camera. Computers and Electronics in Agriculture, 137, 23-28.https://doi.org/10.1016/j.compag.2017.03.012
[5] Weber, A., Salau, J., Haas, J.H., Junge, W., Bauer, U., Harms, J., Suhr, O., Schönrock, K., Rothfuß, H., Bieletzki, S. and Thaller, G. (2014) Estimation of Back-fat Thickness using Extracted Traits from an Automatic 3D Optical System in Lac-tating Holstein-Friesian Cows. Livestock Science, 165, 129-137.
https://doi.org/10.1016/j.livsci.2014.03.022
[6] Meen, G.H., Schellekens, M.A., Slegers, M.H.M., Leenders, N.L.G., van Erp-van der Kooij, E. and Noldus, L.P.J.J. (2015) Sound Analysis in Dairy Cattle Vocalisation as a Potential Welfare Monitor. Computers and Electronics in Agriculture, 118, 111-115.https://doi.org/10.1016/j.compag.2015.08.028
[7] Kruse, L., Salau, J., Traulsen, I. and Krieter, J. (2012) Application of Wavelet Filter-ing to Analyze Acceleration Time Curves of Horses Trotted on Different Surfaces. Journal of Equine Veterinary Science, 32, 696-703.
https://doi.org/10.1016/j.jevs.2012.02.013
[8] Shahriar, S., Smith, D., Rahman, A., Freeman, M., Hills, J., Rawnsley, R., Henry, D. and Bishop-Hurley, G. (2016) Detecting Heat Events in Dairy Cows using Accele-rometers and Unsupervised Learning. Computers and Electronics in Agriculture, 128, 20-26.https://doi.org/10.1016/j.compag.2016.08.009
[9] Van Hertem, T., Rooijakkers, L., Berckmans, D., Fernández, A.P., Norton, T., Berckmans, D. and Vranken, E. (2017) Appropriate Data Visualisation Is Key to Precision Livestock Farming Acceptance. Computers and Electronics in Agricul-ture, 138, 1-10.https://doi.org/10.1016/j.compag.2017.04.003
[10] Hesse, A., Bertulat, S. and Heuwieser, W. (2017) Survey of Work Processes on German Dairy Farms. Journal of Dairy Science, 100, 6583-6591.
DOI: 10.4236/as.2018.91004 51 Agricultural Sciences [11] Curley, K.O., Paschal, J.C., Welsh, T.H. and Randel, R.D. (2006) Technical Note:
Exit Velocity as a Measure of Cattle Temperament Is Repeatable and Associated with Serum Concentration of Cortisol in Brahman Bulls. Journal of Animal Science, 84, 3100-3103.
[12] Gibbons, J., Lawrence, A. and Haskell, M.J. (2009) Responsiveness of Dairy Cows to Human Approach and Novel Stimuli. Applied Animal Behaviour Science, 116, 163-173. https://doi.org/10.1016/j.applanim.2008.08.009
[13] Café, L.M., Robinson, D.L., Ferguson, D.M., McIntyre, B.L., Geesink, G.H. and Greenwood, P.L. (2011) Cattle Temperament: Persistence of Assessments and Asso-ciations with Productivity, Efficiency, Carcass and Meat Quality Traits. Journal of Animal Science, 89, 1452-1465.
[14] Haskell, M.J., Simm, G. and Turner, S.P. (2014) Genetic Selection for Temperament Traits in Dairy and Beef Cattle. Frontiers in Genetics, 5, 1-18.
[15] Lindahl, C., Pinzke, S., Herlin, A. and Keeling, L.J. (2016) Human-Animal Interac-tions and Safety during Dairy Cattle Handling—Comparing Moving Cows to Milk-ing and Hoof TrimmMilk-ing. Journal of Dairy Science, 99, 2131-2141.
https://doi.org/10.3168/jds.2014-9210
[16] MacKay, J.R.D., Haskell, M.J., Deag, J.M. and van Reenen, K. (2014) Fear Responses to Novelty in Testing Environments Are Related to Day-to-Day Activity in the Home Environment in Dairy Cattle. Applied Animal Behaviour Science, 152, 7-16.
https://doi.org/10.1016/j.applanim.2013.12.008
[17] Salau, J., Haas, J.H., Junge, W. and Thaller, G. (2016) Extrinsic Calibration of a Multi-Kinect Camera Scanning Passage for Measuring Functional Traits in Dairy Cows. Biosystems Engineering, 151, 409-424.
https://doi.org/10.1016/j.biosystemseng.2016.10.008
[18] International Committee for Animal Recording (2015) Conformation Recording Dairy and Beef Cattle.
http://www.icar.org/wp-content/uploads/2015/08/Conformation-Recording-CR-W G.pdf
[19] Salau, J., Haas, J.H., Junge, W. and Thaller, G. (2017) Automated Calculation of Udder Depth and Rear Leg Angle in Holstein-Friesian Cows using a Multi-Kinect Cow Scanning System. Biosystems Engineering, 160, 154-169.
https://doi.org/10.1016/j.biosystemseng.2017.06.006
[20] Ihaka, R. and Gentleman, R. (1993) The R Project for Statistical Computing.
https://www.r-project.org.
[21] Olejnik, S. and Algina, J. (2000) Measures of Effect Size for Comparative Studies: Applications, Interpretations, and Limitations. Contemporary Educational Psy-chology, 25, 241-286.https://doi.org/10.1006/ceps.2000.1040
[22] Hays, W.L. (1973) Statistics for the Social Sciences.2nd Edition, Holt, Rinehart & Winston of Canada, Vancouver.
[23] Olejnik, S. and Algina, J. (2003) Generalized Eta and Omega Squared Statistics: Measures of Effect Size for Some Common Research Designs. Psychological Me-thods, 8, 434-447.https://doi.org/10.1037/1082-989X.8.4.434
[24] Webb, L.E., van Reenen, C.G., Bak Jensen, M., Schmitt, O. and Bokkers, E.A. (2015) Does Temperament Affect Learning in Calves? Applied Animal Behaviour Science, 165, 33-39.https://doi.org/10.1016/j.applanim.2015.01.013
DOI: 10.4236/as.2018.91004 52 Agricultural Sciences https://doi.org/10.1093/pan/mpi014
[26] Veissier, I. (1993) Observational Learning in Cattle. Applied Animal Behaviour Science, 35, 235-243.https://doi.org/10.1016/0168-1591(93)90139-G
[27] Charlton, G.L., Rutter, S.M., East, M. and Sinclair, L.A. (2013) The Motivation of Dairy Cows for Access to Pasture. Journal of Dairy Science, 96, 4387-4396. https://doi.org/10.3168/jds.2012-6421
[28] Hirata, M., Tomita, C. and Yamada, K. (2016) Use of a Maze Test to Assess Spatial Learning and Memory in Cattle: Can Cattle Traverse a Complex Maze? Applied Animal Behaviour Science, 180, 18-25.
https://doi.org/10.1016/j.applanim.2016.04.004
[29] Veissier, I., Andanson, S., Dubroeucq, H. and Pomiès, D. (2008) The Motivation of Cows to Walk as Thwarted by Tethering. Journal of Animal Science, 86, 2723-2729.
https://doi.org/10.2527/jas.2008-1020
[30] Cohen, J. (1988) Statistical Power Analysis for the Behavioral Sciences. 2nd Edition, Lawrence Erlbaum Associates,Hillsdale, NJ.
[31] Andersen, M.R., Jensen, T., Lisouski, P., Mortensen, A.K., Hansen, M.K., Gregersen, T. and Ahrent, P. (2012) Kinect Depth Sensor Evaluation for Computer Vision Ap-plications (Technical Report No. ECE-TR6). Aarhus University, Aarhus.
[32] Salau, J., Bauer, U., Haas, J.H., Thaller, G., Harms, J. and Junge, W. (2015) Quanti-fication of the Effects of Fur, Fur Color, and Velocity on Time-of-Flight Technology in Dairy Production. SpringerPlus, 4, 1-14.
https://doi.org/10.1186/s40064-015-0903-0
[33] Salau, J., Haas, J.H., Junge, W. and Thaller, G. (2017) A Multi-Kinect Cow Scanning System: Calculating Linear Traits from Manually Marked Recordings of Hols-tein-Friesian Dairy Cows. Biosystems Engineering, 157, 92-98.
https://doi.org/10.1016/j.biosystemseng.2017.03.001
[34] Bobic, T., Mijic, P., Gantner, V., Šperanda, M. and Gregic, M. (2016) Ma-chine-Induced Changes on Cow’s Udder Tissue. Stockbreeding: Journal of Animal Improvement, 1, 25-32. http://hrcak.srce.hr/180256
[35] Rees, A., Fischer-Tenhagen, C. and Heuwieser, W. (2017) Udder Firmness as a Possible Indicator for Clinical Mastitis. Journal of Dairy Science, 100, 2170-2183.