DRIVER BEHAVIOUR AT HORIZONTAL CURVES
A thesis
submitted in partial fulfilment of the requirements for the Degree
of
Doctor of Philosophy in civil Engineering in the
University of Canterbury
by
WONG YIIK DIEW
Page i, line 29 :
replace "(except one)"
List of errata
with "(with the possible exception of one)" Page 68, line 18 :
replace "curves less than "
with "curves with radii less than " Page 70, line 12 :
replace "DMR" with "New South Wales DMR" Page 80, line 4
replace" (144 km)" with" (14.4 km)" Page 81, line 5
replace "were from" with "involved" Page 110, page 23 :
replace" (61 mm)" with" (61 cm)" Page 173 :
replace "Table 3.7 with "Table 3.7
Proportion Encroaching " Proportions (%) Encroaching Page 177, lines 3-4
.
.
replace "Lane Only Lane with "Lane & Sealed Shoulder Lane Page 196
replace "Scale 1 Page 222, line 14 :
replace "39% more Page 246, line 8 :
.
400" with "Scale 1.
" with "30% more
& Sealed Only"
2500"
"
"
Shoulder"
replace "Figures ... 4.42" with "Figures ... 4.43" Page 252 :
replace "Table 4.5 with "Table 4.5 lines 9-11
Proportion Encroaching " proportions (%) Encroaching
"roadway width. The .•. realignment."
"
Page 276, replace
with "roadway width at the Leithfield BS curve. The lateral separation at the curve mid-point seems to have not changed as a result of realignment at the Foremans Road curve."
Page 288, line 12 :
replace "Department of Main Road" with "DMR, New South Wales" Page 289, line 4 :
replace "Report pp" with "Report No." Page 292, line 20
NGINEERING
liBRARY
-HESIS
TL
I ABSTRACT
studies relating accident occurrence to horizontal curve geometry indicate a strong association between the radius of horizontal curves and accident occurrence, but the individual effect of horizontal curvature on safety is still uncertain. The preponderance of human error as a contributory cause of accidents has led to a growing interest in research on driver behaviour. The human factor in road safety is discussed and literature on driver behaviour on horizontal curves is reviewed.
A study involving unobtrusive observation of driver behaviour at two curves (an isolated curve and a reverse curve) before and after realignment was carried out. Data on driver behaviour was collected by continuous video-recording of each subject vehicle as it moved through each curve. Lateral placement and speed data along the curve were . extracted from the video record, and the path radius and sideway force coefficient at the mid-point of the curve were estimated. The observed driver behaviour is discussed.
The results of the study were checked against the underlying design assumptions, which are shown not to be completely and universally valid. The evaluation of the realignment, based on driver behaviour and the sideway force coefficient, and the accident records show that there was an overall improvement in the margin of safety at all the curves
(except one). The results do not support the concept SEE ERRATA
ACKNOWLEDGEMENTS
This research was carried out at the University of Canterbury, in the civil Engineering Department, of which Professor R. Park is Head.
To Dr Alan J. Nicholson, my supervisor, I would like to express my sincere thanks for his guidance throughout the course of this research. I am also especially grateful to my personal friend, Miss Jeab Paliyavuth, who typed this thesis and has assisted me in more ways than I can list here.
Thanks are also due to:
The Road Research unit of the NZ National Roads Board for the study Grant;
The technical staff of civil Engineering Department, (especially Mr Gordon Sim) for providing technical assistance for the project;
Mr Alan Bright and Mr Roger Corbett for providing technical assistance in the development of the video-recording system;
TABLE OF CONTENTS
Abstract i
Acknowledgements ii
Table of contents iii
List of Figures x
List of Tables xx
List of Plates xxiii
CHAPTER I 1
1.1 ROAD SAFETY IN NEW ZEALAND
1.1.1 Road accidents in New Zealand 1 1.1.2 New Zealand's Road Safety
-An International Comparison 3 1.1.3 Road Safety Research in New Zealand 3
1.2 HORIZONTAL CURVE : GEOMETRIC DESIGN 4
1.3 ROAD SAFETY STUDY 12
1.4 ACCIDENTS OCCURRENCE AT HORIZONTAL CURVES
A - LITERATURE REVIEW 15
1.4.1 Raff Study 1.4.2 Kipp Studies 1.4.3 Baldwin Study
1.4.4 Billion and Stohner Study 1.4.5 U.K. Studies
1.4.6 Kihlberg and Tharp Study 1.4.7 Dart and Mann Study
1.4.8 Australian Study
1.4.9 Wright and Robertson Studies
16 18
20
23 25
29
31 33
Page
1.4.10 Dunlap et ale study 40
1.4.11 Wright and Zador study 42
1.4.12 Hall and Zador study 43
1.4.13 McBean study 45
1.4.14 Neuman et ale study 46
1.4.15 Discussion 47
1.5 HUMAN FACTORS IN ROAD SAFETY 52
1.6 DRIVER BEHAVIOUR RESEARCH 60
1.7 DRIVER BEHAVIOUR AT HORIZONTAL CURVES 62
1.7.1 Taragin study 62
1.7.2 Tharp and Harr study 65
1.7.3 Emmerson Studies 67
1.7.4 Department of Main Roads Study 70
1.7.5 Glennon and Weaver Study 71
1.7.6 Recent Australian Studies 72
1.7.7 stimpson, Kittle and Berg Study 76
1.7.8 Lee Study 77
1.7.9 Study Involving Instrumented
Vehicles and/or Volunteer Subjects 79
1.7.10 Discussion 81
1.8 THE PRESENT STUDY 87
CHAPTER II 89
2.1 COLLECTION OF CURVE DATA 89
2.1.1 preparing the Site 89
2.1.3 Radius of Curvature 93 2.1.4 Stopping sight Distance Survey 94
2.1.5 Skid Resistance 95
2.1.6 Speed Survey 96
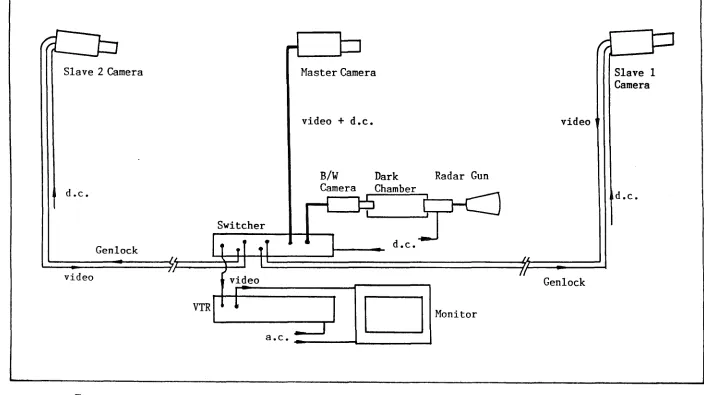
2.2 VIDEO DATA COLLECTION 97
2.2.1 Equipment for Video-Recording 97
2.2.2 setting Up 101
2.2.3 Video Recording 106
2.3 DATA EXTRACTION 109
2.3.1 Perspective Grid Construction 110
2.3.2 Extracting Data 113
2.3.3 Time Required for Data Extraction 115
2.4 DATA ANALYSIS 117
2.4.1 Transforming the Extracted Data 117
2.4.2 Level of Accuracy 121
2.4.2.1 Accuracy of Speed Values 121 2.4.2.2 Accuracy of Lateral
Placement Values 127
2.4.2.3 Accuracy of Path Radius and
Sideway Force Coefficient 129
2.4.3 Analysis of Reduced Data
2.4.3.1 Driver Behaviour along the Curves
2.4.3.2 Driver Behaviour at Particular 129
130
CHAPTER III 137
3.1 STUDY SITE 137
3.2 DRIVER BEHAVIOUR DATA COLLECTION 144 3.2.1 Period of Data Collection 144
3.2.2 Sample Sizes 145
3.3 ANALYSIS OF DATA AND PRESENTATION OF RESULTS 147 3.3.1 Data Analysis
3.3.2 Choice of Mid-Point as Point of Analysis
3.3.3 Presentation of Results
3.4 BEHAVIOUR ALONG CURVES 3.4.1 Mean Speed Profiles
3.4.1.1 Mean Speed Profiles 3.4.1.2 Mean Speed Profiles
147
147 149
150 150 BS Curve 150 AS Curve 152 3.4.1.3 Changes in Mean Speed
Profiles : Before/After 154
3.4.2 Cumulative Speed Distributions 156 3.4.3 Mean Lateral Placement 158
3.4.3.1 Mean Lateral Placement on
Before-Study Curve 158 3.4.3.2 Mean Lateral Placement on
After-Study Curve 161
3.4.3.3 Mean Lateral Placement on
Before and After Study Curves 163
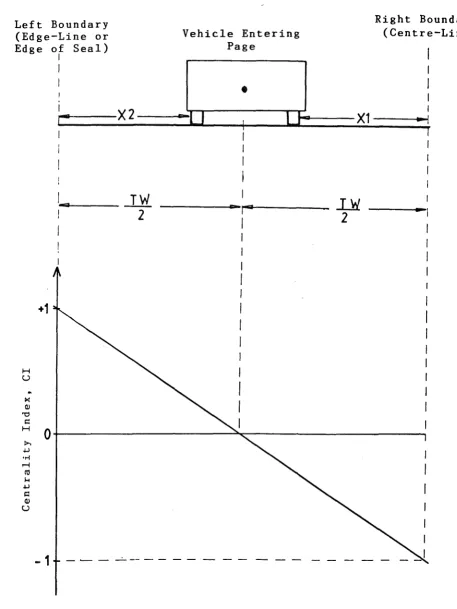
3.4.4 Centrality Index 164
3.4.6.1 Inside Shoulder Encroachment
Profiles 170
3.4.6.2 outside Shoulder
Encroach-ment Profiles 172
3.5 BEHAVIOUR AT THE CURVE MID-POINT 175
3.5.1 Lateral Placement 175
3.5.2 centrality Index 176
3.5.3 Speed 177
3.5.4 Wheel Path Radius 179
3.5.5 Relationship between Speed and Path
Radius 181
3.5.6 Required sideway Force Coefficient SFC 184
3.6 OPERATING SPEED ENVIRONMENT 186
3.7 ACCIDENT OCCURRENCE AT STUDY SITE 189
3.8 SUMMARY OF RESULTS 190
CHAPTER IV 194
4.1 STUDY SITE 194
4.2 DRIVER BEHAVIOUR DATA COLLECTION 201 4.3 ANALYSIS OF DATA AND PRESENTATION OF RESUTLS 203
4.4 BEHAVIOUR ALONG CURVES 205
4.4.1 Mean Speed Profiles 206
4.4.1.1 Mean Speed Profile on
Before-Study North Curve 206 4.4.1.2 Mean Speed Profile on
Before-Study South Curve 208 4.4.1.3 Mean Speed Profile on
After-Study North Curve 209 4.4.1.4 Mean Speed Profile on
4.4.1.5 comparison of the Mean Speed Profiles on the Inside and
outside Lanes of the Curves 212
4.4.2 comparison of Mean Speed Profiles on the Before-Study and After-Study
Curves 213
4.4.3 comparison of Mean Speed Profiles on
the North and South Curves 215 4.4.3.1 Mean Speed Profiles on the
Inside of Before-Study North
and South Curves 216
4.4.3.2 Mean Speed Profiles on the outside of Before-Study North
and South Curves 220
4.4.3.3 Speed Behaviour at Location of Minimum Stopping sight
Distance 222
4.4.3.4 Mean Speed Profiles on the Inside of After-Study North
and South Curves 225
4.4.3.5 Mean Speed Profiles on the outside of After-Study North
and South Curves 226
4.4.4 Mean Speed Behaviour in the Central
Region of the Reverse Curves 227 4.4.5 Mean Lateral Placement 229
4.4.5.1 Mean Lateral Placement on
Before-Study North Curve 230 4.4.5.2 Mean Lateral Placement on
Before-Study South Curve 232 4.4.5.3 Mean Lateral Placement on
After-Study North Curve 234 4.4.5.4 Mean Lateral Placement on
After-Study South Curve 235 4.4.5.5 Comparison of Mean Lateral
Placement Profiles for the Inside and outside Lanes of
4.4.6 Comparison of Mean Lateral Placement Profiles for the Before/After and
North/South Curves 239
4.4.7 Mean Lateral Placement in the Central
Region of the Reverse Curves 241
4.4.8 Centrality Index 243
4.4.9 Centre-line and Edge-Line Encroachment
Profiles 249
4.5 BEHAVIOUR AT THE CURVE MID-POINTS 252
4'.5.1 Lateral Placement 253
4.5.2 Speed 255
4.5.3 Wheel path Radius 258
4.5.4 Relationship between Speed and Path
Radius 262
4.5.5 Required Sideway Force Coefficient 264
4.6 ACCIDENT OCCURRENCES AT THE LEITHFIELD STUDY
SITE 268
4.7 SUMMARY OF RESULTS 270
CHAPTER V
5.1 SUMMARY OF RESULTS
5.1.1 Driver Behaviour at the Horizontal Curves
5.1.2 Results of Curve Realignment
5.2 COMPARISON OF DESIGN ASSUMPTIONS WITH ACTUAL
274
274 277
BEHAVIOUR 280
5.3 CONCLUSION 284
Figure 2.1 2.2 2.3 2.4 2.5 3.1 3.2 3.3 3.4 3.5 3.6 3.7 3.8
3.9 (a)
LIST OF FIGURES
The Different Points of the Curve
Control Points and Control Sections
Equipment Layout for Driver Behaviour Data Collection
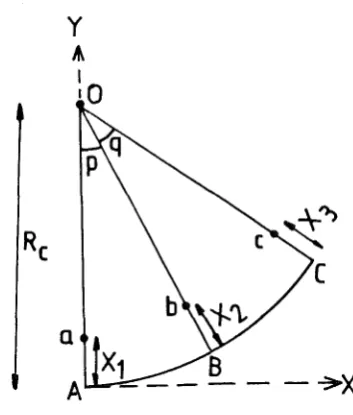
Wheel Path Radius at the Circular Arc
Centrality Index of Vehicle Centred between Left and Right Boundary
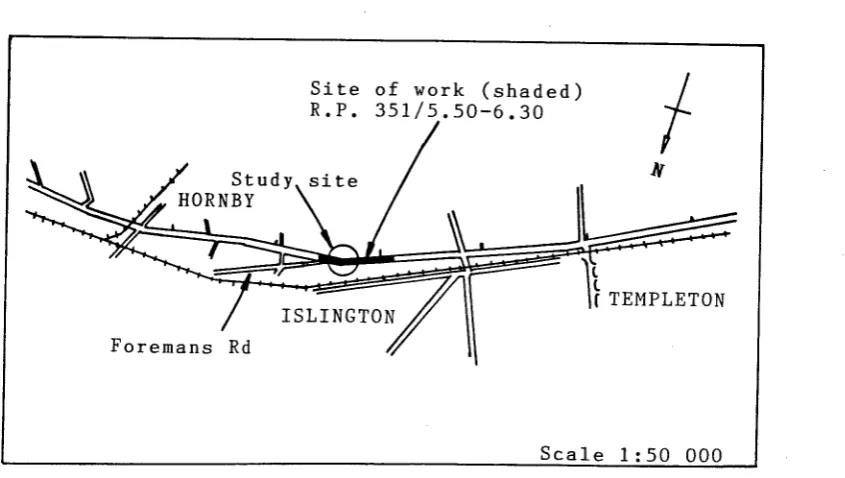
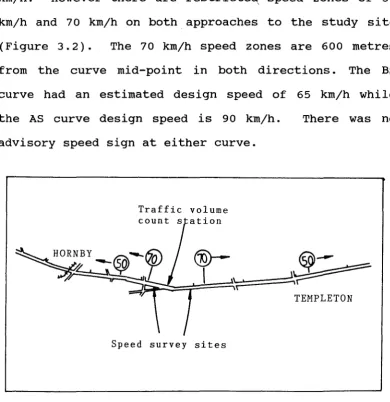
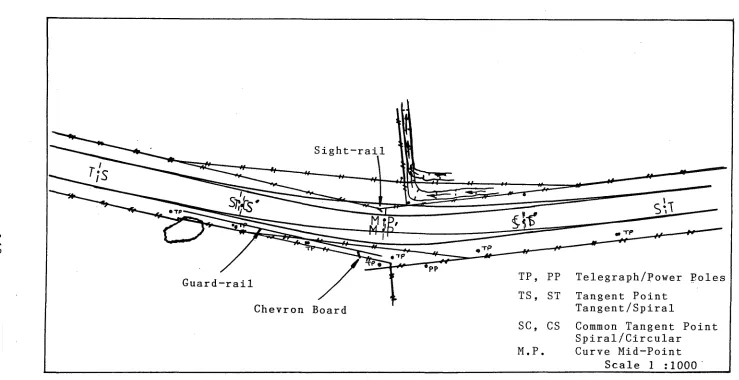
Locality Plan of Study Site
Speed Zones, Speed Survey sites and Traffic Volume Count station
Before-Study Curve (in transparency) and After-Study Curve
width of Travelled-Way
Mean Speed and 95% Confidence Interval on Both Lanes of Before-Study Curve
Mean Speed and 95% Confidence Interval on Both Lanes of After-Study Curve
Mean Speed and 95% Confidence Interval on Inside Lanes of Before- and After-Study Curves
Mean Speed and 95% Confidence Interval on outside Lanes of Before- and After-Study Curves
Cumulative Speed on Inside Lane of Before-Study Curve
Figure
3.9 (b)
3.9 (c)
3.9 (d)
Cumulative Speed on Inside Lane of After-Study Curve
Cumulative Speed on outside Lane of Before-Study Curve
Cumulative Speed on outside Lane of After-Study Curve
3.10 (a) Mean Lateral Placement and 95% Confidence Interval on Both Lanes of
157
157
157
Before-Study Curve 159
3.10 (b) Mean Lateral Placement (with vs. without opposing vehicle) on Both
Lanes of Before-Study Curve 159
3 .11 (a)
3.11 (b)
3.12
Mean Lateral Placement Confidence Interval on Both After-Study Curve
Mean Lateral Placement without opposing vehicle) Lanes of After-Study Curve
and 95% Lanes of
(with vs. on Both
Mean Lateral Placement on Both Lanes of Before- and After-Study Curves.
3.13 (a) Mean centrality Index (Lane only) on
162
162
163
Before Curve 165
3.13 (b) Mean Centrality Index (Lane Shoulder) on Before Curve
and
3.13 (c) Mean Centrality Index (Lane only) on
165
After Curve 165
3.13 (d) Mean centrality Index (Lane
Shoulder) on After Curve and
3.14 Centre-line Encroachment (Outer Lane Traffic) on Before Curve
165
Figure 3.15 3.16 3.17 3.18 3.19 3.20 3.21 3.22 3.23 3.24
3.25 (a)
3.25 (b)
3.25 (e)
3.25 (d)
Centre-line Encroachment (Outer Lane Traffic) on After Curve
Inside Shoulder Encroachment on Before Curve
Inside Shoulder Encroachment on After Curve
outside Shoulder Encroachment on Before Curve
outside Shoulder Encroachment on After Curve
Lateral Placement of Right-Front Wheel from Centre-line of Before and After Curves
Speed at Mid-Point (Inside Lane) on Before and After Curves
Speed at Mid-Point (Outside Lane) on Before and After Curves
Path Radius at Mid-Point (Inside Lane) on Before and After Curves
Path Radius at Mid-Point (Outside Lane) on Before and After Curves
Speed VS Wheel Path Radius on Before-Study Inside Curve
Speed Vs Wheel Path Radius on Before-Study outside Curve
Speed Vs Wheel Path Radius on After-Study Inside Curve
Speed Vs Wheel Path Radius on After-Study outside Curve
Figure 3.26 3.27 4.1 4.2 4.3 4.4 4.5 4.6 4.7 4.8 4.9 4.10 4.11 4.12 Sideway Lane of
Force Coefficient on Before and After
Inside Curves
Sideway Lane of
Force Coefficient on outside Before and After Curves
Locality Plan of Study site
Before Study Curve (in Transparency) and After Study Curve
width of Travelled Way North Curve
width of Travelled Way South Curve
Stopping Sight Distance North Curve
Stopping Sight Distance South Curve
Leithfield
Leithfield
Leithfield
Leithfield
Mean Speed and 95% Confidence Interval on Both Lanes of Before North Curve
Mean Speed and 95% Confidence Interval on Both Lanes of Before South Curve
Mean Speed and 95% Confidence Interval on Both Lanes of After North Curve
Mean Speed and 95% Confidence Interval on Both Lanes of After South Curve
Mean Speed and 95% Confidence Interval on Inside of Before and after North Curves
Figure 4.13 4.14 4.15 4.16 4.17 4.18 4.19 4.20 4.21 4.22 4.23
Mean Speed and 95% Confidence Interval on Inside of Before and After South Curves
Mean Speed and 95% Confidence Interval on outside of Before and After South Curves
Mean speed and 95% Confidence on Inside of Before North Curves
Mean Speed and 95% Confidence on outside of Before North Curves
Mean Speed and 95% Confidence on Inside of After North Curves
Mean Speed and 95% Confidence on outside of After North Curves
Interval and South
Interval and South
Interval and South
Interval and South
Mean Speed North and Curves
Profile on Inside of Before outside of Before South
Mean Speed Profile on outside of Before North and Inside of Before South Curves
Mean Speed on Inside of After North and outside of After South Curves
Mean Speed on outside of After North and Inside of After South Curves
Mean Lateral Placement Confidence Interval on Both Before North Curve
xiv
and 95% Lanes of
Figure 4.24 4.25 4.26 4.27 4.28 4.29 4.30 4.31 4.32 4.33 4.34 4.35
Mean Lateral Placement Confidence Interval on Both Before South Curve
Mean Lateral Placement Confidence Interval on Both After North Curve
Mean Lateral Placement Confidence Interval on Both After South Curve
and 95% Lanes of
and 95% Lanes of
and 95% Lanes of
Mean Lateral Placement on Both Lanes of Before and After North Curves
Mean Lateral Placement on Both Lanes of Before and After South Curves
Mean Lateral Placement on Both Lanes of Before North and South Curves
Mean Lateral Placement on Both Lanes of After North and South Curves
Mean Lateral Placement on Both Lanes of Before North and South Curves
Mean Lateral Placement on Both Lanes of After North and South Curves
Mean Centrality Index (Lane Only) and 95% Confidence Interval on Both Lanes of Before North Curve
Mean centrality Index (Lane only) and 95% Confidence Interval on Both Lanes of Before South Curve
Mean Centrality Index (Lane only) and 95% Confidence Interval on Both Lanes of After North Curve
Figure 4.36 4.37 4.38 4.39 4.40 4.41 4.42 4.43 4.44 4.45 4.46 4.47
Mean Centrality Index (Lane Only) and 95% Confidence Interval on Both Lanes of After South Curve
Mean Centrality Index (Lane Only) on Inside of Before and After North Curves
Mean Centrality Index (Lane Only) on outside of Before and After North
Curves
Mean Centrality Index (Lane Only) on Inside of Before and After South Curves
Mean centrality Index (Lane Only) on outside of Before and After South
Curves
Mean centrality Index (Lane and Sealed Shoulder) on Inside of Before and After North Curves
Mean Centrality Index (Lane and Sealed Shoulder) on outside of Before and
After North Curves
Mean centrality Index (Lane and Sealed Shoulder) on Inside of Before and After South Curves
Mean centrality Index (Lane and Sealed Shoulder) on outside of Before and
After South Curves
Centre-Line and Edge-Line Encroachment on Inside of Before North Curve
Centre-Line and Edge-Line Encroachment on Inside of After North Curve
Centre-Line and Edge-Line Encroachment on Inside of Before South Curve
Figure 4.48 4.49 4.50 4.51 4.52 4.53 4.54 4.55 4.56 4.57 4.58 4.59 4.60
Centre-Line and Edge-Line Encroachment on Inside of After South Curve
Centre-Line and Edge-Line Encroachment on outside of Before North Curve
Centre-Line and Edge-Line Encroachment on outside of After North Curve
Centre-Line and Edge-Line Encroachment on outside of Before South Curve
Centre-Line and Edge-Line Encroachment on outside of After South Curve
Lateral Placement of Reference Wheel from Centre-Line of Before and After North Curves
Lateral Placement of Reference Wheel from Centre-Line of Before and After South Curves
Cumulative Speed at Curve Mid-Point on Inside of Before and After North
Curves
Cumulative Speed at Curve Mid-Point on outside of Before and After North
Curves
Cumulative Speed at Curve Mid-Point on Inside of Before and After South Curves
Cumulative Speed at Curve Mid-Point on outside of Before and After South
Curves
Cumulative Speed at Curve Mid-Point on
250 251 251 251 251 254 254 256 256 256 256
Inside of Before North and South Curves 257
Cumulative Speed at Curve Mid-Point on
Figure 4.61 4.62 4.63 4.64 4.65 4.66 4.67 4.68 4.69 4.70 4.71 4.72 4.73
Cumulative Speed at Curve Mid-Point on Inside of After North and South Curves
Cumulative Speed at Curve Mid-Point on outside of After North and South Curves
Cumulative Wheel Path Radius on Inside of Before and After North Curves
Cumulative Wheel Path Radius on outside of Before and After North Curves
Cumulative Wheel Path Radius on Inside of Before and After South Curves
Cumulative Wheel Path Radius on outside of Before and After South Curves
Cumulative Wheel Path Radius on Inside of Before North and South Curves
Cumulative Wheel Path Radius on outside of Before North and South Curves
Cumulative Wheel Path Radius on Inside of After North and South Curves
Cumulative Wheel Path Radius on outside of After North and South Curve
Speed Versus Path Radius on Inside of Before Study North Curve
Speed Versus Path Radius on Inside of After Study North Curve
Cumulative Required Coefficient on Inside After North Curves
sideway Force of Before and
Figure Page
4.74 Cumulative Required Sideway Force
Coefficient on outside of Before and
After North Curves 265
4.75 Cumulative Required Sideway Force
Coefficient on Inside of Before and
After South Curves 265
4.76 Cumulative Required sideway Force
Coefficient on outside of Before and
After South Curves 265
4.77 Cumulative Required Sideway Force
Coefficient on Inside of Before North
and South Curves 266
4.78 Cumulative Required Sideway Force
Coefficient on outside of Before North
and South Curves 266
4.79 Cumulative Required Sideway Force
Coefficient on Inside of After North
and South Curves 266
4.80 Cumulative Required Sideway Force
Coefficient on outside of After North
Table 1.1 1.2 1.3 1.4 1.5 1.6 1.7 1.8 1.9 1.10 1.11
LIST OF TABLES
Lost Control Accidents on Open Roads
Accident Rates on Curves, by Degree of Curvature and Roadway Type (Raff, 1953)
Accident Rates on Two-Lane Curves, by Degree of Curvature and Frequency of Curves (Raff, 1953)
Accident Rates on Tangents and Curves, by Roadway Type (Raff, 1953)
Accident Experience on Rural Highways (AASHO, 1954)
Results of Improvements at Bends (DSIR, 1963)
Effect of Curvature on Accident Rates on Rural Roads in Buckinghamshire 1946-48
(Charlesworth and Coburn 1957)
Effects of Curvature on Accident Rates on Rural Roads in Lancashire 1946-47,
(Drake 1949)
Accident Rates on straights, and on Bends of Different Radii with Different Levels of Average Curvature, England 1957-58,
(DSIR, 1963)
Regression Variabl.es Related to Accident Occurrence (Dart and Mann, 1970)
Proportion of Crash and Comparison sites with the Maximum Curvature (Wright and Robertson, 1976)
[image:22.595.73.532.87.800.2]Table
1.12
1.13
3.1
Proportion of Crash and Comparison sites with the Maximum Curvature (Wright and Robertson, 1979)
Empirical Speed-Curvature Relationships (McLean, 1974)
Before-Study for Foremans Point Region
and After-Study Curve Data Road Curve, at Curve
Mid-38
73
141
3.2 Period of Data Collection 144
3.3 Sample Sizes 145
3.4 Proportions Exceeding Design Speed 156
3.5 Proportions Encroaching on the Centre-Line 168
3.6 Proportions Encroaching on Inside Shoulder 171
3.7 proportions Encroaching on outside Shoulder 173
3.8
3.9
3.10
3.11
3.12
3.13
Lateral Placement Mean and Standard Deviation
Centrality Indices Mean and Standard Deviation
Speed : Mean and Standard Deviation
Path Radii Mean and Standard Deviation
sideway Force Coefficient
Speed at Curve Mid-Point and Adjoining Tangents
176
177
178
180
185
Table
4.1 Before-study and After-Study Curve Data for Leithfield Reverse Curves, at Curve Mid-Point Region
4.2 Data Collection Period for Leithfield Reverse Curves
4.3
4.4
4.5
4.6
4.7
4.8
4.9
Sample Sizes for Leithfield Study site
Speed Behaviour at Locations of Minimum Stopping Sight Distance
Proportion Encroaching on Centre-Line and Edge-Line
Lateral Placement Deviations
Mean and Standard
Speed : Mean and Standard Deviations
proportions (%) at Curve Mid-Point Exceeding Advisory/Design Speed
Wheel Path Radius Deviations
Mean and Standard
197
201
203
223
252
253
255
258
261
4.10 Proportion (%) Less than Centre-Line Radius 262
4.11 Correlation Coefficient between Speed and
Path Way Radius 264
4.12 SFC Mean and Standard Deviations 267
LIST OF PLATES
Plate Page
4.1 Looking South from Curve Entry of North Curve 217 4.2 Looking North from Curve Entry of South Curve 217 4.3 Looking South from Curve Mid-Point of North
Curve 219
4.4 Looking North from Curve Mid-Point of South
Curve 219
4.5 Looking South from Curve Entry of South Curve 221
CHAPTER I
1.1 ROAD SAFETY IN NEW ZEALAND
1.1.1 Road Accidents in New Zealand
estimated the total cost of road accidents in New Zealand to be 510 million dollars in March 1983 prices, and official statistics accounted for only 40% of this total cost.
Examination of reported accident statistics shows that the number of road accidents, fatalities and injuries have been on an upward trend since 1979. Jones and Frith (1988) analysed ~eported accident statistics for the 1980-86 period and showed that there was an increase of 30% in fatal accidents, a 2% increase in serious injuries and a 70% increase in minor injuries over this period, with the increases occurring mostly on open-speed roads. They also identified the 'lost control on bend' accidents to be the most common accident type for both fatal and injury accidents, and especially on the open roads where 'lost control on bend' accidents accounted for a third of fatal and injury accidents. As a comparison, the statistics for lost control accidents on the open roads (i.e. rural areas) are as shown in the following table.
Year Fatal Fatal Injury: Injury:
(Straight) (CUrve) (straight) (Curve)
83 43 344 503 924
84 45 360 485 1041
85 40 402 569 1144
86 57 407 608 1282
87 59 456 652 1408
Analysis of data for New Zealand state highways (as extracted from aerial photographs) shows that there are over 7000 km of straight road compared to less than 3500 km of curves. This implies that lost control accidents are disproportionately represented on curves.
1.1.2 New Zealand's Road Safety : An International comparison
The problems involved in comparing international data on road safety has been addressed by Appleton (1982) who identified major difficulties in correcting for differences in accident data collection, procedures, transport conditions and stages of economic growth. Appleton concluded that the best statistic to use is fatalities per vehicle kilometre travelled (VKT) and showed that from a comparison of 17 countries with compatible data for the year 1982, New Zealand's road safety is ranked in the middle position. However a comparison of fatality rates with some other developed countries over the last 20 years (1965 to 1985) shows that New Zealand's safety performance is falling behind those of other comparable countries (Barnes, 1988).
1.1.3 Road Safety Research in New Zealand
importance is the fact that the New Zealand road transportation system is now relatively mature (the rate of infrastructure development is much lower than in the past) and the time has come to fine-tune the system to make i t safer and more efficient.
Road safety research in New Zealand is co-ordinated by the Road Traffic Safety Research Council
(RTSRC) which works closely with the Ministry of Transport as well as various funding organizations in pursuing all relevant research into road safety. The RTSRC annual reports give an appreciation of the increasing emphasis on road safety research activities in New Zealand; for example, the 1988 annual report listed 89 safety related research projects, compared to 36 in the 1978 listing. In general, road safety research in New Zealand falls into four categories: accident statistics and analysis, human factors, environmental factors and vehicle factors. It is not the intention of this thesis to further delve into the spectrum of road safety research except to mention that this project is in the area of human and environmental factors.
1.2 HORIZONTAL CURVE : GEOMETRIC DESIGN
curve), a tangent and another curve or between two
curves. 'Horizontal curves can be fully transitional,
fully circular or circular with adjoining transitions,
and usually involve some degree of superelevation.
Horizontal curves become an integral part of
the roadway mainly because of constraints imposed on
road layout by topography and land-use. Nowadays,
however, horizontal curves are purposefully inserted
along long stretches of tangent sections to reduce
monotony to the drivers. Horizontal curves also
improve perception of speed in oncoming vehicles, as
well as reducing glare from opposing vehicles during
hours of darkness.
The geometric design of horizontal curves is
concerned with the horizontal alignment of the roadway.
The elements of design comprise, where appropriate, the
radius of the central circular arc, the superelevation,
the length of spiral transition curve, pavement
widening and lateral clearance on the inside of the
curve for ensuring adequate sight distance across the
curve.
The design of the central circular arc is
where,
e + f
=
(v2 ) / ( gR) . . . • . . . . (1 . 1 )e
f
v R
g =
=
=
=
=
superelevation,
sideway force coefficient, SFC vehicle speed
radius of curvature of the horizontal curve acceleration due to gravity
This equation has been derived from a consideration of the mechanics involved in a vehicle traversing the circular arc.
An excellent review of the development of horizontal curve design is contained in ARRB Special Report No. 15 (Good, 1978). In using equation (1.1) the aim of the designer is to determine values of the radius of curvature (R) and superelevation (e) which also satisfy the constraints on the sideway force coefficient (f) and the stopping sight distance, while using the vehicle speed as the overall control.
Australian Road Research Board (McLean 1978) have indicated that driver speed behaviour can be related to the standard of the geometric elements (principally horizontal curves) and the road environment (principally terrain), and accordingly, an alternative approach to road design has been adopted by the National Association of Australian Road Authorities (NAASRA 1980). A major difference between the tradi tional approach and the NAASRA approach is that the former generally assumes a constant speed value for design while the latter considers the influence of alignment standard on driver speed behaviour, thereby also necessitating an iterative method for arriving at the final design.
Superelevation at the central circular arc helps to counteract some or all of the centrifugal force of a cornering vehicle. The range of superelevation values is usually between a maximum of 0.10 and a lower bound equal to the normal crossfall on straights (typically 0.03). Values higher than 0.10 are not normally used because of stability problems for highly laden vehicles and the tendency of slow moving vehicles to track towards the centre of the curve.
surface conditions, the condition of the tyre and the speed of the vehicle. The typical friction capability assumed by AASHO (Glennon, 1969) is in the range of 0.45 at 30 km/h to 0.27 at 120 km/hi measurement of skid resistance using the M.L. Mu-meter at eight sites in Auckland, New Zealand (RRU, 1977) shows the sideway force coefficient varying from 0.65 at 32 km/h to between 0.65 and 0.40 at 96 km/h (where there is good macrotexture, speed increase has little effect). The sideway force coefficient used for design is set by the New Zealand standard (NRB, 1955), and ranges from 0.2 at 20 km/h to 0.08 at 160 km/h.
Horizontal curves may be widened to maintain the lateral clearance between meeting vehicles at a level equal to the clearance on straights, as vehicles on horizontal curves occupy a greater width than on straights. The amount of widening depends on the design speed, pavement width (on straights) and the geometric radius of the curve.
Apart from designing horizontal curves for safe passage under normal conditions, provision is also made to ensure that drivers are able to perceive any road hazard ahead in sufficient time to identify and take appropriate actions. The safe stopping sight distance ( SSSD) is a theoretical stopping distance, measured along the travelled lane, for a driver with an eye height of 1.0 m and an object (hazard) height of 0.15 m, and allowing a driver perception-reaction time of 2.5 seconds (NRB, 1960).
The above discussion of the various parameters of horizontal curve design
the basic ideas involved
expectation of the driver's behaviour which could very well be different from the actual on-the-road behaviour (for example, the speed behaviour at curves, discussed previously in conjunction with design speed). The designer hypothesizes a model of driver's behaviour (e.g. wheel path radius equal to geometric radius and constant speed inside the curve) and relies upon the laws of mechanics as a technique of design. However the road user's driving behaviour is a result of judgement based on an interaction of factors such as motive, attitude and experience. The technicalities of using the road is also generally 'learned' through experience rather than through an analytical examination of the underlying mechanics involved. It is therefore not adequate to model driving behaviour through merely understanding the mechanics of road design. Rather,· an empirical approach involving systematic observation of driver behaviour is necessary to provide the designer with a better idea of road user's behaviour.
difficult to control because behaviour varies from person to person and operates in a transient manner within each indiviual. stringent screening of users similar to that for airline pilot could solve much of the problem but such a step is both politically and socially unacceptable, given the importance being placed upon the road transport as a mean of mobility.
Within the present state of knowledge of driver behaviour, the current approach to road design is to set a limiting value on this behaviour and design wi thin this limit in accordance with a hypothetical model of driver behaviour. A safety factor is also incorporated into the design. For example, in horizontal curve design, drivers are assumed to negotiate the curve with a path equal to the as-designed geometric radius.
used to decide on values
area of study is to do field observation to assess the discrepancy between the 'observed' and the 'as-designed' .
1.3 ROAD SAFETY STUDY
The study of road safety can be conveniently grouped into the three areas that reflect the major components in the road transportation system (namely the driver, the vehicle and the environment). There have been many studies carried out concerning the interaction of each of the components as related to road safety. Research into the design of vehicles, such as crash-worthiness and road handling characteristics, have contributed to an improvement in the safety standard of modern road vehicles (SAE Handbook). There have been significant changes in the design and operations of traffic controls and roadway elements (FHWA, 1982). There has also been a big increase in the quantity and quality of research concerning the driver behaviour (Naatanen and Summala, 1976; Shinar, 1978).
A frequently used approach in the study of road safety is the statistical analysis of reported accident statistics. One method is to measure accident occurrence based on a model of the form:
Safety
=
level of accident occurrenceBroadly speaking, there is general acceptance of the utility of the risk and exposure concepts in studying road accident involvement, but there is no general agreement as to how risk and exposure can best be defined (Wolfe, 1982; Hauer, 1982; Haight, 1986). The traditional approach is to express the accident rate as the number of accidents per unit exposure (of time, distance, population, or some combination of these) and use this as accident risk. The most common form is the number of accidents per vehicle kilometre travelled.
Another frequent use of accident statistic is for the evaluative studies of counter-measures, which typically involve a before-and-after design. The emphasis here is on whether or how effective the implemented change has been in bringing about the desired result.
Notwi thstanding the mechanics involved in the statistical analysis, there are several aspects of road accident statistics that warrant some attention.
include:
They
(a) the not-always-consistent definition, across national boundaries, of accident type and accident severity, as well as the type of associated variables that are collected;
(b) inconsistent data due to varying reporting thresholds across different jurisdictions and between different accident types and severity;
(e) inconsistent data due to failure to investigate e.g. during busy periods;
Hence reported accident statistics are neither totally reliable nor completely consistent. However, since accidents are very rare events and because i t is not possible to experiment with accident events, the extensive accident statistics which have been routinely collected over many decades provide a common source of information for many road safety studies, and particularly mass data statistical analyses.
1.4 ACCIDENT OCCURRENCE ON HORIZONTAL CURVES - A LITERATURE REVIEW
Past research on the relationship between horizontal curvature and accident rate on two-lane rural highways is reviewed. Most studies have indicated that the accident rate increases as the radius of curvature decreases i. e. sharp curves are more hazardous. The studies are reviewed in chronological order.
The magnitude of a curve is expressed either in degree or radius of curvature. The degree of curvature is defined as the central angle subtended by an arc of
100 feet. If Rand 0 are radius and degree of curvature respectively, then
R
=
5729.6/0 (R in ft)turns to the left (from the drivers' perspective) is a left curve or left-turning curve, and one that turns to the right a right curve or right-turning curve. It is important not to forget that drivers travel on the right side of the road in America whereas in New Zealand, Australia, U.K. and other countries, drivers travel on the left hand side of the road.
1.4.1 Raff study
It is appropriate to begin this review of horizontal curvatbre and accident experience by referring to the classical study by Raff (1953), whose work on road geometries and motor vehicle safety has been extensively quoted. In the study, 15 states in the U.S.A. provided information covering one year (1941) for 16421 accidents on about 5000 miles of main rural highways. Factors studied included the number of lanes, average daily traffic (ADT), degree of curvature, frequency of curves, pavement width and shoulder width. Accident data were merged by applying a weighting factor to each state's data (Type 1), by selecting those states whose reporting met a certain standard (Type 2), and by including all data without adjustment (Type 3). The unadjusted accident rate
(Type 3) was found to be "most reasonable".
ACCIDENT RATES ON CURVES BY DEGREE OF CURVATURE AND ROADWAY TYPE TJPt' 1 leeldtnt ntu (All ,'I"., uln~ .dJu.t1n~nl 'aelou)
T1tfO~ ll.he road' Tbrn .. lant roads Four-lant roads
UndlVldtd Dtvlclt-d Controlltd lee, ••
C .. natun P.r mil. P~T mit. Ptr II\U. Per mU. Per mil. thambu • tMtlt- Number Yehlel ... Numbu .thid .... Number .ehieJ ... Number ..thielI' ..
mU" mUll ~Utl moUn .Uta
DccrM.
1.1
0-2.8 104 2.1 11 II 4.' '$ 1.4 110 2.4
J -$.8 116 3. e 11
•••
.0 1.4 U 4.1 112 '.4 I - 8.8 338,
..
e 14.1 II,
..
$ II. • S8 i.1 SO or InOrt' U4 4. e II 18.0 ) I .• 12 30. e 0-TJPf' 2 ICttde-nt r.tn (BtIteltd Itattl, "1lhout adJu.5tmtnt)
0-2.1 340 I . ' 0
-
U I. I 33 O. , 110 I.e S - i. I 447 2. $ 0 0.0 33 2.1 12 2. , lIZ I. )1-'.1 187 2. I 0
-
10 2.' 1 1. I IS 4.510 or moTt 181 3.4 1 10.0 0
-
0-
0-Typt 3 aceidmt rltts tAll .t.t~" without adlu,tmtnt}
0-1.' $04 I.e II 1. , 18 1. I .5 I.. 18" I.e
I
S - $.' $16 2.5 11 2 .• 10 2.' 15 2.4 162 2.3 1-1.1 U8 2.1 I 3. $ 16 3.3 5 3.1 S8 4. $. 10 or mon SM 3.5 II'.'
3 1.2 12..
,
0-Table 1. 2 (Raff, 1953)
ACCIDENT RATES ON TWO-LANE CURVES. BY DEGREE OF CURVATURE AND FREQUENCY OF CURVES
Tvno 1 accident rates (All states usin~ ad'ustment factors)
Curvature
o -2.9° 3° - 5. gO 6°-9.9° 10° or more
Frequency of Per mil. Per mil.
Per mil. Per mil.
curves Number vehicle- Number vehlcle- Number vehicle- Number
vehicle-miles miles miles miles
Number per mile
0-0.9 128 3.0 110 5.4 13 4.2 31 8.9
1.0 - 2.9 178 2.3 163 3.7 96 4.5 53 4.2
3.0 - 4.9 125 2.1 223 2.9 170 3.3 139 4.3
5.0-6.9 75 3.3 100 3.2 59 2.8 130 4.6
Type 2 accident rates (Selected states, without adjustment)
0- 0.9 42 1.6 47 3.2 2 1.1 4 1.4
1.0 - 2.9 105 1.4 97 2.1 65 2.9 30 2.6
3.0-4.9 118 2.0 203 2.5 161 3.2 117 3.3
5.0 - 6.9 75 3.1 100 2.9 59 2.6 130 3.9
Type 3 aCCident rates (All states. without adjustment)
0- 0.9 128 1.4 110 2.7 13 2.0 31 4.3
1. 0 - 2.9 178 1.4 163 2.1 96 2.9 53 2.6
3.0-4.9 125 1.9 223 2.5 170 2.9 139 3.4
5.0 - 6.9 75 3.1 100 2.9 59 2.6 130 3.9
Table 1. 3 (Raff, 1953)
ACCIDENT RATES ON TAIIGENTS AND CURVES 'llY ROADWAY TYPE TJPt 1 acetdent ratn (AU wtatu, Ul1ni adJUltrDtn1 Ilttora) T.,o·}an, road.s Three~la.nt "Qadi Four·ll.ht roadA
tlnd,.ld.d DIt1ded Controlltod lettlS Pl'rmil. Pcr mU. P.., ."u. Per mU, Per ml .
'hnnbtr ... hielt Number •• hlc:l.- Number •• htcle .. Number ...hiel.- IIWIlbe • .chiclt.
• Ut. mUu .Utl .U •• .11.,
Tanlen1l 1.414 3. , 127 1.1 1,In 1.4 .12 4.1
".
2.2evn •• 1,11. I.S 10 10.2 110 '.1 177 S.I UO I.'
TJPt 2: aee\&knl rile, (StlKtf'd Itattl, Without adJu~Dlf'nt)
T~'fnt. 4.2~~ S.1 115 1.3 n, I.S III I.' '74 1. ,
Cunu 1,155 2.' I 2. $
..
I.. 16 I. S no 1.0 TJPf 3 aCcident ratn (An ~atel, wtthout adJultmfnt)Tanetnta 1.474 2. S 227 I. $ 1,348 2, , 182 I.' '74 1. ,
Cunu 1,114 2 S 3~ 2 •• 210 1.2 177 2.1 sao 1.0
lAB 'foluD'ln, Indu, cunaturu, I'lc.
highways (Table 1.2) but the frequency of curves did not appear to have any consistent effect on the accident rate on two-lane curves (Table 1.3), even when the curves were subdivided by degree of curvature. The effect of frequency of curves on the accident rate on adjacent tangents was also inconclusive. The accident rates (Type 3) on tangents and aggregated curved sections were not much different (Table 1.4).
There was a large amount of irregularity in most of the results; few of the data can be fitted by smooth curves. The considerable scatter about the overall trends was attributed principally to the tremendous complexity of the problem itself and partly to inconsistency in the data (collected from 15 states) .
1.4.2 Kipp Studies
One aspect of the investigations dealt with accidents on tangent sections. The accident rate for shorter tangents was found to be lower but the difference was not significant enough to show conclusively that short tangent sections (interrupted by intersections and curves) were safer than longer tangent sections. Further analysis into accident rate at curves occurring at the end of these tangents indicated that a lower accident rate was associated with curves adjacent to tangents less than 3 miles in length (2.1 acc./million vehicles miles (MVM)) as compared to accident rates at at curves adjacent to tangents more than 3 miles in length (2.5 acc/MVM). Kipp (1952) attributed this difference to driver relaxation and inattention on long tangents. While not emphatically reflected in the accident rates for long tangents, it seemed to be reflected in the rate for curves that terminated these sections.
The study also showed (among many other findings) that:
(a) the accident rate for curves of 7 degrees or more was nearly four times the accident rate for curves of less than 3 degrees, and
distance (this average was also twice as great as that for curves with adequate sight distances).
Kipp (1951), in an earlier report on the same study, had also presented results of analysis for curved sections grouped by degree of curvature. The accident rates for these groupings were
Degree of curve
less than 3
3 to 5 5 and over
Rate (per MVM)
1.37 2.48 3.86
The accident rate for tangent sections was 1.14 compared to 1.54 accidents per MVM on curves.
The author concluded that "due to numerous factors the occurrence of motor-vehicle accidents cannot be predicted on the basis of roadway elements and roadside features however, these various elements, along or in combination, make varying degrees of contribution to accident occurrence."
1.4.3 Baldwin study
forcasting for rural highways. In this study, Baldwin related accident rates to such items as traffic volume, width of pavement, relative width of structures, roadway alignment, highway type and presence of intersections. Data were collected from 10 states, covering over 9000 accidents occurring on almost 4000 miles of major rural highways.
ACCIDENT EXPERIENCE ON RURAL HIGHWAYS
Hi~hway or Value ot' Accident rate,
traffic dement dimension
aU
reported accidentsADT No. per million .'eh. miles
-VOLUME Less than 3000 3000 - ~ooo 3.3 3.9
(2-lane tangents) ~ooo
-
8000 4.28000- 9000 6.2
9000 and over 2.6
Feel No. per million f'eh. miles
PAVEMENT Less than 18
-
~.2WIDTH 18 - 20 3.8
(2-1ane tangents) 20- 23 3.~
23 and o\'er 3.4
Greatu or leu than No. per 10 million fJehirleJ
STRUCTIJRE 1l~t2,oa(h u,jdtb-teet E,tr 'lear
WIDTH
-
1 or more 10.0(2-lane)
-1 to
+
~ ~.8+
~ or more 1.2Degree Cllrt't! ~er mile No. t!.tr million fJeh. mileJ
Less than Less than O.~ 2.6
3 1 to 1.~ 3.0
4 to ~ 2.4
HORIZONTAL
Less than o.~ 4.9
CURVATURE
(2-lane) 3 to 6 1 to l.~ 4.2
4 to ~ 2.6
Less than 0.) 13.2
10 and 1 to 1.) ~.9
over 4 to , 3.~
Af'eraE,t tor all fJO/llfntJ No. 1!,er million fJeh. mileJ
n"PE OF 2-lane 3.7
HIGHWAY 3-lane '.0
4-lane undivided 3.7
4-lane expressway 2.3
Highulll}' type No. 1!,er 10 million .'ehirles
I!..er lear
INTER- Less than 10% 10% or-more
SEcrIONS cross traffic cross traffic
AT GRADE 2-lane
3.7 - 1.8 10.0- 6.0
3·lane 7.2 "2.'
4·lane, undiv. 8A - 3.3 14.1- 38.3 4·lane, divided ).1- ).2 17.4 - 27.4 NOTE: Accident rates (or a specific State or region may differ materially from
these composite vaJues.
The 1954 AASHO document was revised in the mid-sixties to become the AASHO
Design of Rural Highways
"A Policy on Geometric 1965". The section on safety was expanded to include a broader and more detailed treatment of the factors affecting highway safety. The effect of inconsistent design on driver surprise was recognized, and standardization of design was encouraged by which means "the driver becomes aware of what to expect on a certain type of highway".
The 1965 document also postulated that for two-lane rural roads, the safest alignments were straight and level roads without intersections and with insignificant numbers of private driveways. The study by Billion and Stohner, (1957) (See the following section) was quoted in support of this. However, to prevent drivers falling asleep while going along long tangents, "it is highly desirable to provide gentle curvature and avoid a fixed cross-section for long tangent sections".
Overall, the safety aspect in highway design had assumed greater importance, and the need to build safety features into roads was duly stressed.
1.4.4 Billion and stobner study
(Billion and Stohner, 1957). A sample of 1753 fatal and severe injury accidents (from 1947 to 1953) were analysed with regard to shoulder width, pavement width and horizontal and vertical alignments. Accident experience was measured by an accident index, defined as the ratio of percent of accidents to percent of travel (an accident index > 1 implies a greater than average number of accidents occurred, and vice versa). The accident indices indicated that:
(a) narrow width shoulders (3-4 ft) had significantly higher accident frequency on poor alignments than wider shoulders, and
(b) regardless of shoulder width, grades > 5 percent, horizontal curves > 5 deg, and combination of grades and curves had 2.4, 6.3 and 9.5 times (respectively) the accident frequency of level tangents. Poor alignments, grades over 5 percent and/or curves over 5 degrees respectively, accounted for only 13 percent of travel but as much as 40 percent of the accidents.
alignment and shoulder width category was tested (Chi-square statistic), and the results showed a significantly different (significance level not given) accident distribution (except for wide shoulders), the conclusion being that factors (e.g., alignment and shoulder width) other than travel exposure were influencing accident occurrence. The inclusion of the values of variance (for the calculation of confidence intervals) would have been very beneficial but the research method (relating geometric data to each accident) made such analysis difficult.
The 1965 AASHO document quoted this study in support of its conclusion that straight, level rural roads were the safest highway within their general class. However, caution was expressed regarding the reliabili ty of the data; the sample sizes for some alignments were very small (especially for curve plus grade, and long-term trends in accident occurrence (8 years' data were used) were overlooked.
1.4.5 UK Studies
A number of studies (including Raff, 1953) that examined the effect of road curvature on road accidents were mentioned in
1963). Results
Results of improvements at bends
Type of improvement
Re-alignment of isolated bend (17 cases)
Superelevation of isolated bend (6 cases)
Improved visibility at isolated bend (6 cases)
Major re-alignment of lengths of road (7 cases)
• Statistically significant at the 5 per cent level.
Reduction in injury-accidents (per cent)
60
63
95·
Table 1.6 (DSIR, 1963)
Effect of curvature on accident rates on rural roads in
Buckinghamshire 1946-48 (Two- and three-lane carriage ways)
Radius (ft)
Over 2900 (including straights)
2900-1450 1450-950. 950-550 .
Less than 550
Injury-accidents per million vehicle-miles (Numbers of accidents
shown in brackets)
2'5 (177) 3'0 (48)
3'5 (21) 3'8 (9) 14· J (18)
Table 1.7 (Charlesworth and Coburn, 1957)
Effect of cuTt'ature on accident rates on rural roads in Lancashire 1946-47
Radius «(t)
Over 2000 2000-1000 1000-500.
500-200 . Less than 200
Injury.accidents per million vehicle-miles
1'5
2'5
4'0 3'7
16'7
improvement had been made (Table 1.6). studies of accident rates per vehicle-mile in Buckinghamshire (Charlesworth and Coburn, 1957) and in Lancashire (Drake, 1949) showed that there was a distinct tendency for accidents to cluster on bends, particularly on the very sharp curves (Tables 1.7 and 1.8). A British study that related accident rates at tangents and curves with average curvature (total horizontal curve deflection per unit length of section) was also included. The results of this study (Table 1.9) showed that:
Accident rates on straights, and on bends of different radii, on sections of 30-/t carriageway with different levels of
average curvature, England, 1957-58
Non-junction injury accidents involving motor vehicles only
Accidents per million vehicle-miles (and numbers of accidents)
Average STJlA)GKTS BENDS
curvature and bends
(degrees of radius radius radius radius TOTAL
per mile) more than 5000 ft- 2000 ft- Jess than 5000 ft 2000 ft 1000 ft ]000 ft
0-40
. ·
]'2 (284) ]'2 (33) 1-0 (4) 8-6 (18) 1- 3 (339) 40-80 •·
0-9 (142) 0-9 (37) 0-9 (23) l' 5 (14) 0-9 (216)8~J20.
·
0·' (69) 0·5 (J 1) 0·9 (16) 1'6 (24) 0-8 (120) Over 120·
0·4 (1S) 0'5 (3) 1'0 (19) 1'2 (19) 0·' (56)TOTAL
·
1·0 (SI0) 0'9 (84) 1'0 (62) 1'8 (75) 1'0 (731)(a) accidents bends, and
tended to cluster at sharp
(b) accident rates were lower on "bendy" roads than on less "bendy" roads; this was especially true for straights, with low accident rates on roads where bends were frequent, and high accident rates on roads where curves were infrequent.
The above observations were reported to hold true for all injury and serious injury acidents, independent of the level of traffic flow, and to be applicable to both 30-ft carriageway and trunk roads in Britain. The second observation was in agreement with Baldwin's (1946) results for sharp curves (> 3 deg). However, Raff had reported an inconclusive finding between curves with different degrees of curvature.
The DSIR (1963) suggested on the basis of the above evidence, that:
(b) the policy of designing roads without excessively long straights was supported by the evidence.
It was however noted that the interpretations should not be regarded as conclusive.
1.4.6 Kihlberg and Tharp study
The relationship of motor vehicle accidents to highway types and highway design elements was
investigated by Kihlberg and Tharp (1968). The investigation was conducted in two phases; phase 1 studied accident rates (by type and severity) for various highway types, and phase 2 related these rates to various geometric elements of the highway.
During phase 1, data from California, Louisiana and Ohio were obtained and analysed. Accident and severity rates were calculated for homogeneous segments of known length and average daily traffic (ADT). In addition, the data were regressed using a model of the form
log A = a+b1 log L + b 2 log T
known ADT and 0.3 mile length. For statistical analysis, the segments were arranged into 15 ADT groups, and the data within each group were regressed by using a model of the form
log A
=
a + b I log T + b 2 (log T)2where A and T were the number of accidents per segment and the mean ADT, respectively. This analysis was done for each of the several highway types (classified according to the number of lanes, median, access control) subdivided by geometric elements (curve, grade, intersection, structure) for each accident type (multi-vehicle, one vehicle, injury, property damage, and all accidents). The results were presented as accident rates on II pure II segments (baseline rates) with multiplication coefficients for segments containing geometric elements or combinations of elements.
The results showed that:
(a) intersections (and access control) had the greatest effect on accident rates,
(c) partitioning of gra~e and curvature did not show any effect due to steepness of grade and sharpness of curve, and
(d) there was no evidence of accident severity being related to any geometric element.
An interesting outcome of phase I of the study was that accident rates were dependent on segment length; high accident rates were associated with short segments and low accident rates with long segments. Segment length was held constant for phase 2 of the study. Again, the results of the study could apply directly only to the individual states studied because the level of accident reporting varied from state to state. Overall, a study of this magnitude (with massive data input and regression calculations) is feasible only if the necessary data are readily available.
1.4.7 Dart and Mann study
contribution of the variables to accident occurrence
(Table 1.10). The mathematical model relating the 10
variables to total accidents gave a coefficient of
determination R2 of 0.46. The 2 geometric variables
appearing to have the greatest effect on accident rates
were pavement cross-slope and the number of traffic
FOUR VARIABLES CONTRIBUTING MOST TO MULTIPLE RJ
VALUES
Accidents Analyzed Total acc idenls: all first order
variables versus main effects Fir,,' order
Main effects
Fatalities versus injuries Fatalities
Injuries
Day versus night
Day
Night
Dry versus wet road Dry
Wet
Variables
TVR • CS TVR • TC LW. TC TVR • HA All TVR CS VA TC Ten
TVR • CS CS • TC HA. VA
SW. CO All TVR • CS TVR • TC LW. TC TVR • HA All
TVR • CS TVR • TC T .TVR TVR • HA All (TVR)J TVR • TC TVR • CS LW.TC All
(TVR)' TVR • TC TVR • CS TVR All
TVR • CS T .TVR
(T)'
TVR All
Note: CS crou ,lope CO continUOUS obnrucllons HA ho,ironta' ahgnment T trucks
LW lane Width SW Ihoulder Width
Variable Order I 2 3
..
1 2 3 4 1 2 3 4 1 2 3 4 1 2 3 4 1 2 3 4 1 2 3 4 1 2 3 4 Multiple R' 0.305 0.365 0.386 0.398 0.587 0.241 0.265 0.272 0.278 0.295 0.136 0.179 0.199 0.209 0.424 0.304 0.358 0.388 0.404 0.610 ·0.307 0.354 0.374 0.384 0.588 0.258 0.300 0.327 0.347 0.537 0.303 0.352 0.378 0.402 0.615 0.291 0.331 0.337 0.352 0.487TC 1,.lhc confhcts
TVR traflic ... ,.tIO
VA _uc., ahgnment
conflicts (number of traffic access points) per mile. Horizontal alignment, expressed as the percentage of the length of a highway section that had a horizontal highway curvature in excess of 3 degrees, was found to be related to accident occurrence, but the effect was not clear.
Al though a broad range of geometric variables was studied, only 46 percent of the variation was explained. This pointed to the complexities involved in formulating a mathematical model for accident prediction and showed that geometric variables alone are not sufficient to describe accident causation. The application of the findings was also limited to the area where the data were obtained (i. e. Louisiana), since no cross-validation was attempted.
1.4.8 Australian Studies
An analysis of fatal accidents on rural state Highways in New South Wales for three years (1966-68) was carried out by Cowl and Fairlie (1970). A sample of 750 fatal acccidents were classified by location of accident, time of day, types of vehicle involved, age of drivers, accident type and road alignment. The results showed that
(b) 40 percent of all fatal accidents occurred at curves with radii less than 1500 ft,
(c) 67 percent of all fatal accidents on or adjacent to curves occurred where the curve radius was 1000 ft or less,
(d) 30 percent of all fatal accidents were "head-on collision", and
(e) 20 percent of all fatal accidents were "ran off road" accidents
(f) head-on-collision and ran-off-road accidents were the most common types of fatal accidents; together they constituted 65 percent of all fatal accidents occurring on curves with radii less than 600 ft.
1.4.9 Wright and Robertson Studies
The traditional approach has usually involved making inventories of geometric and traffic variables and relating them to accident statistics; included in the data base are data for sites at which no accidents may have occurred. Some recent studies have departed from the traditional research method, and have focussed on accident locations. The recent trend is towards in-depth investigation of accident sites.
Maximum Curvature Crash ComRarison (degree)
0 19 45
.0001-1 1 2
1.001-2 3 4
2.001-3 4 7
3.001-4 9.5 8
4.001-5 6 5
5.001-6 7.5 6
> 6 50 24
Table 1.11 ProRortion (%) of Crash and CommRarison sites with the Maximum Curvature uR to 152 Metres from Fatal Fixed Objected Crash and ComRarison sites (Extracted from Figure 3, Wright and Robertson, 1976)
By comparing crash occurrences against the functional classification of the roads, i t was shown that the majority (83 percent) of crashes occurred on non-local roads, which constituted only one third of all roads. A survey of fixed objects showed little difference in potential hazard near the roadside
(i.e. similar frequency of fixed objects at crash and comparison locations). About 90 percent of objects struck were within 11 m from the pavement edge.
The study showed that:
(b) roadside obstacles influenced the severity of run-off-road (ROR) crashes.
An extension to the study on roadside hazard modification by Wright and Robertson (1976) was carried out by the same authors (Wright and Robertson, 1979). The research method used was identical but the crashes studied covered fatal, personal-injury and property-damage-only single vehicle fixed-object accidents (i.e. all levels of severity). A sample of 300 crash locations closely resembling the statewide fixed object crash population was drawn from 3 counties in North Georgia. The study area included a variety of land uses, roadway type and topogr