http://www.scirp.org/journal/ojmi ISSN Online: 2164-2796
ISSN Print: 2164-2788
DOI: 10.4236/ojmi.2017.74023 Dec. 13, 2017 248 Open Journal of Medical Imaging
Use of Foot Measurements as Sonographic
Parameter for Estimation of Fetal Age
Bushra Abdel Malik
1, Mohammed Ibrahim
2, Qurashi Ali
3, Mohamed Yousef
4,5,
Qurain Turki Alshammari
1, Saddig Jastaniah
5,61Department of Diagnostic Radiology Sciences, College of Medical Applied Sciences, Hail University, Hail, KSA 2College of Radiologic Technology, The National Ribat University, Khartoum, Sudan
3National University, Khartoum, Sudan
4College of Medical Radiologic Sciences, Sudan University of Science and Technology, Khartoum, Sudan 5Department of Radiological Science, Batterjee Medical College, Jeddah, KSA
6Department of Diagnostic Radiology, Faculty of Applied Medical Sciences, King Abdulaziz University,Jeddah, KSA
Abstract
Objectives: this research was conducted to describe the ultrasonic mea-surements of the foot full meamea-surements (FFM) and their importance in the antenatal care (ANC). Material and methods: the Descriptive quantitative cross-sectional study conducted in the ultrasound department at Alshaekh Mohammed Ali Fadol hospital in Omdurman locality. The study included 400 healthy Sudanese pregnant women whom in the 1st (late), 2nd and 3rd trimesters (i.e., after 10 weeks gestational age) of different parity and ages (15 years old and above); they have regular menstrual cycle and well certain of their last menstrual period and calculated date of delivery. Ultrasono-graphic measurement of Full Foot Length1 (FFL1), Foot Full Length2 (FFL2), and Foot Full Width (FFW) of all pregnant women were done. So-nographically we measured fetal foot from 14 to 40 weeks of gestation. Re-sults: the study revealed that the mean FFL1 was 58.7 ± 12.9 mm. The minimum measurement was 18.8 mm, and the maximum was 89.1 mm, while the mean value of FFL2 was 53.4 ± 11.4 mm, with minimum value 17.5 mm and maximum 81.7 mm, and the mean FFW was 23.7 ± 5.1 mm, with minimum value 7.0 mm and maximum 38.0 mm. Conclusion: a strongly significant relationships were observed between (FFL1, FFL2, FFW) and gestational age (p = 0.00). However there is no significant difference between the FFL1, FFL2, and correlations with sex of embryo, residence, occupation, parity, maternal height, socioeconomic status, bleeding during this pregnancy, chronic illness, and caesarian section, moreover there are significant correlations between the FFL1, FFL2 and the (maternal age,
ma-How to cite this paper: Abdel Malik, B., Ibrahim, M., Ali, Q., Yousef, M., Alsham-mari, Q.T. and Jastaniah, S. (2017) Use of Foot Measurements as Sonographic Para-meter for Estimation of Fetal Age. Open Journal of Medical Imaging, 7, 248-262. https://doi.org/10.4236/ojmi.2017.74023
Received: November 13, 2017 Accepted: December 10, 2017 Published: December 13, 2017
Copyright © 2017 by authors and Scientific Research Publishing Inc. This work is licensed under the Creative Commons Attribution International License (CC BY 4.0).
DOI: 10.4236/ojmi.2017.74023 249 Open Journal of Medical Imaging
ternal weight, and body mass index), but in the measurement of the fetal FFW there were no significant correlations with (sex of embryo, maternal age, body mass index, residence, occupation, parity, socioeconomic status, bleeding during this pregnancy, chronic illness, and caesarian section). Also there are significant correlations between the FFW and the maternal weight and height.
Keywords
Gestational Age, Full Foot Measurements, Foot Full Length1 (FFL1), Foot Full Length2 (FFL2), and Foot Full Width (FFW)
1. Introduction
Pregnancy (gestation) is the physiologic process of a developing fetus within the maternal body. Several terms are used to define the developmental stage of hu-man conception and the duration of pregnancy [1].
Rapid and accurate determination of gestational age may be vital to the ap-propriate of the antenatal care (ANC), pregnant women and improve obstetric care through allowing the optimal timing of necessary interventions and the avoidance of the unexpected evidence. Ultrasound scans are considered to be the most cost-effective, accurate and safe methods for measurement of various fetal parts in pregnant women [2]. Ultrasound gave clinicians a method to measure the fetus and therefore to estimate gestational age [3].
Fetal biometry is the measurement of the fetus and various segments of the fetal anatomy. Every part of the fetal anatomy may be imaged, these biometric measurements can be used to estimate gestational age and fetal weight, evaluate interval fetal growth, and these measurements may influence antepartum and intrapartum management and may be used to predict pregnancy outcomes. Therefore, biometry is an integral and valuable element of obstetrical practice
[4].
The Role of U/S for pregnant women should be offered an ultrasound scan for the detection of fetal anomalies and pregnancy complications. Many countries routinely offer at least one midtrimester sonogram for this purpose [5].
A standard obstetrical sonogram in the first trimester includes evaluation of the presence, size, location, and a number of gestational sacs(s). The gestational sac is examined for the presence of yolk sac and embryo/fetus. When an emb-ryo/fetus is detected, it should be measured and cardiac activity should be rec-orded by 2D video clip or M mode. Use of spectral doppler is discouraged. The uterus, cervix, adnexa, and sac region should be examined [6].
tech-DOI: 10.4236/ojmi.2017.74023 250 Open Journal of Medical Imaging
nically feasible [6].
Several anatomical parameters are used in the assessment of gestational age. In early pregnancy, sonologist can use mean sac diameter (MSD) 0 - 7 weeks, crown-rump length (CRL) 9 - 13 weeks to assess gestational age. In second and third trimesters, sonologist use four main anatomic parameters; biparietal di-ameter 13 - 40 w/g, femur length 24 - 40 w/g, head circumference and abdomin-al circumference, the traditionabdomin-al biometric parameters have some limitations; conditions affecting shape of skull like a cranial malformations will affect bipa-rietal diameter (BPD) and head circumference (HC), abdominal conditions (hy-drops, severe growth restriction) affect abdominal circumference (AC) and fe-mur length (FL) measurements may be difficult to obtain in deeply engaged breech or may be abnormal in limb dysplasias. In these situations, we need to use other parameters for more estimation of gestational age [7] [8] [9].
The fetal foot length can be useful parameter because it is easy to assess and measure [7] [8] [9]. In second and third-trimester fetuses, several studies else-where, have demonstrated improved age determination by including the CRL and foot length, i.e., heel-toe length, and other parameters of the extremities. However, foot length in small embryos between 4 - 7 weeks (according to Car-negie stages 13 - 18) is difficult to define, since the heel and toe have not yet dif-ferentiated and appeared only as a foot bud or foot plate.
However, foot bud and foot plate measurements performed on fresh tissue could be an easily acquired measurement to the complement of the Carnegie staging method [10].
This research was conducted to describe the ultrasonic measurements of the foot full measurements (FFM) and their importance in the antenatal care (ANC).
2. Materials and Methods
2.1. Study Design and Area
This is a descriptive quantitative cross-sectional study, with an aim to assess the sensitivity of fetal foot measurements in order determine gestational age during the period from August 2012 to August 2015.
2.2. Study Population and Sampling
DOI: 10.4236/ojmi.2017.74023 251 Open Journal of Medical Imaging
The present study included four hundred pregnant women for the routine booking exam in the 1st (late), 2nd and 3rd trimesters (between 12 weeks gesta-tional until term) we used different criteria which are divided into inclusion and exclusion criteria.
The inclusion criteria adopted includes; Normal antenatal singleton patients in late first , second and third trimesters (20 - 41 weeks) and women who are certain of their last menstrual period and estimated gestational age early by the ultrasound machine (before 10 weeks) and they a regularly menstrual cycled.
While the exclusion criteria include; chronic maternal pathology like hyper-tension, gestational diabetes and fetal congenital lower limbs abnormalities, fetal growth restricted, Multiple pregnancy, and Maternal medical illness is known to affect fetal size.
2.3. Equipment
Obstetric ultrasonography was performed on ultrasound machine using 3.5 MHz frequency curvilinear probe. Ultrasound examinations were performed using a Toshiba power Vision 6000 Ultrasound Machine (Tokyo, Japan).
2.4. Techniques
2.4.1. Preparations of Pregnant Women
For transabdominal ultrasound, the woman should have a full bladder. To fill her bladder, the woman should drink four glasses of water 0.5 - 1 h before the procedure.
2.4.2. Position and Scanning Technique
For transabdominal ultrasound, the woman should lie on the examination bed on her back, with extended or flexed legs. After ultrasonographic gel has been applied to the woman’s skin,
Transabdominal, the probe is placed longitudinally in the lower lateral qua-drant of the abdomen, angled medially to examine the pelvis and lower part of the abdomen in different directions; horizontal (transverse), vertical (sagittal) and oblique scanning planes and adjust the gain to produce the best image. The probe frequency should be at 3.5 - 5.0 MHz.
2.4.3. Method of Data Collection and Instrumentation
Data was collected using pre-prepared questionnaire which included:
Maternal age, residence, occupation, parity, date of LMP, anthropometric measurements: weight-height-BMI, socioeconomic status, past medical his-tory.
Also, it included the result of ultrasound measurements (Foot Measurements,
BPD, FL, AC and Expected Fetal Weight). The data was divided into three groups:
DOI: 10.4236/ojmi.2017.74023 252 Open Journal of Medical Imaging
Group 2 included late second-trimester pregnancy (20 - 27) weeks. Group 3 included third-trimester pregnancy (28-until term) weeks.
2.5. Statistical Analysis
Statistical analysis was performed in the pool data using the. (IBM - SPSS Statistics 22-Inc. USA) Software. (International Business Machines Corporation-Statistical Package for the Social Sciences) values are expressed a mean ± standard error of the mean (SEM) statistical significance was determined by one analysis of variance (ANOVA) followed by Tukey’s test for companion fall parameters.
2.6. Ethical Consideration
Diagnostic ultrasound studies of the fetus are considered safe during pregnancy. This diagnostic procedure should be performed only when there is a valid medi-cal indication, and the lowest possible ultrasonic exposure setting was used to gain the necessary diagnostic information. Exposure was kept as low as reasona-bly achievable (ALARA).
Ethical aspects were carefully considered at the time of these studies as: 1) The study was approved by the ethical committee of al-Ribat University. 2) Permission was taken from the Ministry of Health, Khartoum state. 3) Permission was taken from the head of the radiology and imaging of Al-shaekh Mohammed Ali Fadol Hospital, Omdurman to perform the study.
4) Informed and verbal consent was obtained from each pregnant woman be-fore subjecting her in the study.
3. Results
The study was conducted in 400 pregnant women between 14 to 40 weeks of gestation, attending at OPD for 2nd and 3rd-trimester routine checkups, in the department of Ultrasound, Alshaekh Mohammed Ali Fadol hospital, Omdur-man area, Sudan. Measurements were taken using the sonographic technique.
Maternal data was collected such as age, occupation, weight, and height, and recorded in prepared data collection sheet. Fetal biometrics such as biparietal diameter, head circumference, abdominal circumference, femoral length and fetal foot measurements (fetal foot length 1, fetal foot length 2, and fetal width) has been calculated. The study showed that the earliest age at which fetal foot measurements (fetal foot length 1, fetal foot length 2, and fetal width) could be seen sonographically was found to be in 14 weeks of gestation, Maximum num-ber of cases were fit GA of 34 weeks (35 cases), minimum numnum-ber of cases were in GA of 14, 15, 16 and 20 weeks (1 case each). A long with foot measurements biparietal diameter (BPD), Femur length (FL), abdominal circumference (AC) also were measured for comparison.
4. Discussion
DOI: 10.4236/ojmi.2017.74023 253 Open Journal of Medical Imaging [11]. Regarding maternal age range between (14 - 44 years), 50.0% of the res-pondents were belong to the maternal age that in between 25 - 34 years, 40.3% of the respondents belong to the maternal age in between 15 - 24, 08.5% of the pondents belong to the maternal age in between 35 - 44 and 01.3% of the res-pondents belong to the maternal unknown age (Figure 1).
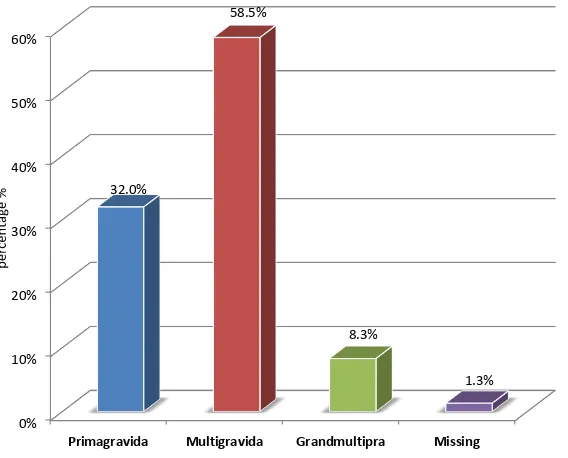
[image:6.595.232.512.187.449.2]This depicts that 58.5% have multigravida (parity type), 32.0% have primagra-vida, 8.3% have grandmultipra and only 1.3% have unknown parity (Figure 2).
Figure 1. Maternal age of females subjects percentage.
Figure 2. Parity distribution.
% 0.0
% 5.0
% 10.0 15.0% 20.0% % 25.0
% 30.0
% 35.0
% 40.0
% 45.0
% 50.0
24 to
15 25 to 34 35 to 44 Unknown
% 40.3
% 50
% 8.5
1.3%
Maternal age
% 0
% 10
% 20
% 30
% 40 50% 60%
Primagravida Multigravida Grandmultipra Missing 32.0%
58.5%
8.3%
[image:6.595.235.519.482.711.2]DOI: 10.4236/ojmi.2017.74023 254 Open Journal of Medical Imaging
Results showed that 40 kg minimum and 110 kg maximum with the mean 64.68 of the maternal weight of the respondents were to the maternal height the minimum was 140 mm and maximum was 193 mm with the mean160.97 and regarding to the maternal BMI the minimum was 16.23 and the maximum was 60.23 with the mean 25.07 (Figure 3).
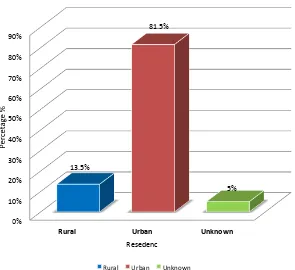
[image:7.595.227.521.204.407.2]Results showed that 81.5% of the respondents were belonging to the urban areas, while 13.5% of the respondents belong to the rural areas and 5.0% of the respondents belong to the unknown areas (Figure 4).
Figure 3. Maternal weight, height, and BMI.
Figure 4. Maternal residence percentage.
0% % 20 % 40 % 60 % 80 % 100 120% 140% 160% 180% 200%
Minimum Maximum Mean Std. Deviation
40% 110% % 65 % 11 140% % 193 161% % 6 % 16 60% % 25 5%
Maternal weight Maternal height Maternal BMI
0% % 10 % 20 % 30 % 40 50% 60% % 70 80% 90%
Rural Urban Unknown
% 13.5
81.5%
5%
Resedenc
Rural Urban Unknown
[image:7.595.228.523.435.705.2]
DOI: 10.4236/ojmi.2017.74023 255 Open Journal of Medical Imaging
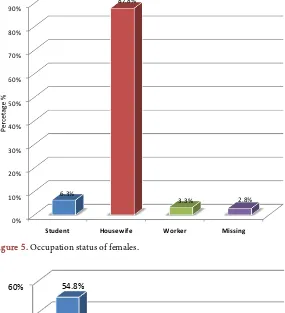
Data also illustrated that 87.8% of the respondents were housewives, whereas 6.3% of the respondents were students, while 3.3% of the respondents were workers and only 2.8% of the respondents were unknown in their occupation status (Figure 5).
[image:8.595.231.516.214.527.2]Depicts that 54.8% of the respondents/subjects are belong to the lower class followed by medium class 16.6% of the respondents, 54.8% of the subjects be-longed to the unknown class and only 3.0% and 54.8% of the respon-dents/subjects belongs to the high class (Figure 6).
[image:8.595.230.518.478.708.2]Figure 5. Occupation status of females.
Figure 6. Socioeconomic status distribution.
0% 10% 20% 30% 40% 50% 60% 70% % 80 90%
Student Housewife Worker Missing
6.3%
% 87.8
3.3% 2.8%
%
0 % 10
% 20
% 30
% 40 50% 60%
Low Medium High Unknown
% 54.8
28.5%
0.3%
DOI: 10.4236/ojmi.2017.74023 256 Open Journal of Medical Imaging
The study showed the mean values and standard deviation of maternal data, the mean maternal weight was (64.68 ± 11.287 kg), with minimum (40 kg) and maximum (110 kg). The mean maternal height was (160.557 ± 10.1554 cm), with minimum (2.0 cm) and maximum (193.0 cm). The mean Maternal body mass index was (25.0709 ± 4.77944), with minimum (16.23) and maximum (60.23), (Table 1).
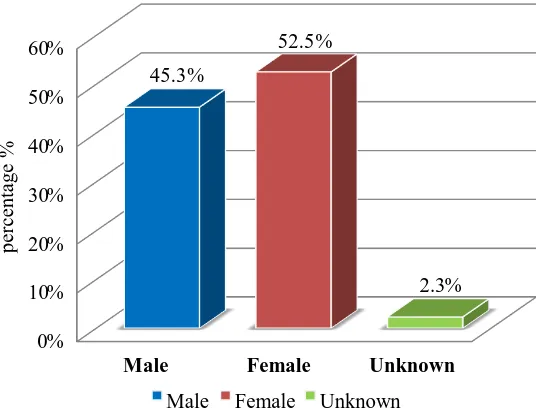
Depicts that 52.5% have female sex of embryo and 45.3% have male sex of embryo and only 2.3% have unknown sex (Figure 7).
[image:9.595.239.507.280.486.2]The cronbach’s alpha analysis for reliability and validity showed that the liability of the GA, FFL1, FFL2, and FFW was 90.2, and validity was 95.0. The re-liability of the GA was 89.9 and validity was 94.8, while the rere-liability of the FFL1 was 83.3 and validity was 91.3, the reliability of the FFL2 was 81.8 and validity was 90.5, and the reliability of the FFW was 90.1% and validity was 95.0 (Table 2).
[image:9.595.210.540.537.595.2]Figure 7. Sex of embryo distribution.
Table 1. Descriptive statistics of maternal weight maternal height and maternal BMI.
N Minimum Maximum Mean ± SD
Maternal weight (Kg) 388 40 110 64.68 ± 11.287
Maternal height (Cm) 385 140 193.0 160.557 ± 10.1554 Maternal body mass index 384 16.23 60.23 25.0709 ± 4.77944
Table 2. Reliability and validity of the GA, FFL1, FFL2, and FFW.
Parameter Scale Mean if Item Deleted Variance if Scale Item Deleted
Corrected Item-Total Correlation
Cronbach’s Alpha if Item
Deleted
GA 135.845 805.381 0.834 0.899
FFL1 108.694 414.769 0.956 0.833
FFL2 113.977 481.973 0.933 0.818
FFW 143.645 811.380 0.841 0.901
% 0
% 10 20%
% 30
% 40
% 50
% 60
Male Female Unknown
% 45.3
52.5%
2.3%
[image:9.595.208.540.629.732.2]DOI: 10.4236/ojmi.2017.74023 257 Open Journal of Medical Imaging
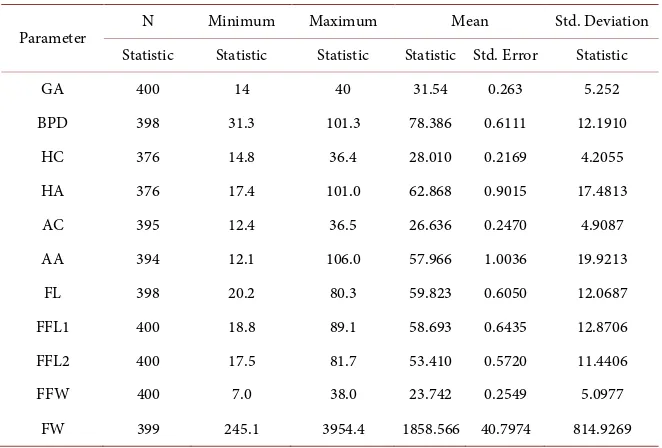
[image:10.595.209.540.466.690.2]The mean values and standard deviation of fetal biometric. The mean GA is (31.5 ± 5.3 mm), Std. Error of mean was (0. 26 mm), with minimum (14.0 mm) and maximum (40.0 mm), the mean BPD is (78.4 ± 12.2 mm), Std. Error of mean was (0. 61 mm), with minimum (31.3 mm) and maximum (101.3 mm). The mean HC was (28.0 ± 4.2 mm), Std. Error of mean was (0.22 mm), with minimum (14.8 mm) and maximum (36.4 mm), the mean HA was (62.9 ± 17.5 mm), Std. Error of mean was (0.90 mm), with minimum (17.4 mm) and maxi-mum (101.0 mm), the mean AC was (26.6 ± 4.9 mm), Std. Error of mean was (0.25 mm), with minimum (12.4 mm) and maximum (36.5 mm), the mean AA is (58.1 ± 20.0 mm), Std. Error of mean was (1.00 mm), with minimum (12.1 mm) and maximum (106.0 mm), the mean FL is (59.8 ± 12.1 mm), Std. Error of mean was (0.61 mm), with minimum (20.2 mm) and maximum (80.3 mm), the mean FFL1 was (58.693 ± 12.8706 mm), Std. Error of mean was (0.64 mm), with minimum (18.8 mm) and maximum (89.1 mm), the mean FFL2 was (53.4 ± 11.4 mm), Std. Error of mean was (0.57 mm), with minimum (17.5 mm) and maxi-mum (81.7 mm), the mean FFW was (23.7 ± 5.1 mm), Std. Error of mean was (0.25 mm), with minimum (7.0 mm) and maximum (38.0 mm), the mean FFW was (1858.6 ± 814.9 gm), Std. Error of mean was (40.8/g), with minimum (245.1/g) and maximum (3954.4/g) (Table 3). In the present study, we com-pared elicited results with the outcome of ultrasound and morphological exami-nations: The high correlations between the studied fetal foot measurements (FL1, FFL2, and FFW) and GA indicated that the growth increase existed in dif-ferent ranges in all of the evaluated growth parameters (Table 3). FFL1 is a measurement between the end of the big toe and the heel in the planter surface
Table 3. Basic descriptive statistics of the GA, BPD, HC, HA, AC, AA, FL, FFL1, FFL2, FFW.
Parameter N Minimum Maximum Mean Std. Deviation
Statistic Statistic Statistic Statistic Std. Error Statistic
GA 400 14 40 31.54 0.263 5.252
BPD 398 31.3 101.3 78.386 0.6111 12.1910
HC 376 14.8 36.4 28.010 0.2169 4.2055
HA 376 17.4 101.0 62.868 0.9015 17.4813
AC 395 12.4 36.5 26.636 0.2470 4.9087
AA 394 12.1 106.0 57.966 1.0036 19.9213
FL 398 20.2 80.3 59.823 0.6050 12.0687
FFL1 400 18.8 89.1 58.693 0.6435 12.8706
FFL2 400 17.5 81.7 53.410 0.5720 11.4406
FFW 400 7.0 38.0 23.742 0.2549 5.0977
DOI: 10.4236/ojmi.2017.74023 258 Open Journal of Medical Imaging
of the foot, FFL2 is a measurement between the end of the little toe and the heel in the plantar surface of the foot, and FFW is a measurement in the widest area of the planter surface of the foot at the base of metatarsal bones, no differ signif-icantly in the left and right limb [11].
Rajeev Mukhia etal.[12] previously studied foot length and its relationship to GA by ultrasonography. They suggested that there is a good correlation between foot length and GA.
Vishram Singh et al. [13] studied the relationship between foot length and GA; they stated that with an ultrasonic determination of foot length, the foot length is a good marker for gestational age and can be used in cases who are not sure about their LMP. In the present study FFL1 showed good correlation with gestational age with correlation coefficient 0.828 with p < 0.0001, FFL2 showed good correlation with gestational age with correlation coefficient 0.817 with p < 0.0001, and FFW showed good correlation with gestational age with correlation coefficient 0.720 with p < 0.0001.
Pandey V D etal.[14] in 2015 conducted their study in 100 pregnant women between 15 to 36 weeks of gestation in 2nd and 3rd trimesters , their study is a comprehensive study in North India demonstrated a strong correlation on comparison of linear regression of foot length versus gestational age with corre-lation coefficient (r = 0.960, p < 0.001) which is comparatively much higher than the FFL1 in the present study has showing correlation coefficient (r = 0.828, p < 0.001). Although both studies were consistent, with the mean foot length (17.5 ± 1.29) in 15 weeks and mean sonographic foot length at 36 weeks of gestation (64.4 ± 3.28) which was closely related to the present study in which the mean FFL1 was. 24.60 in 15 week and mean sonographic FFL1 at 36 weeks of gestation is 67.00 ± 7.58, with the equation relationship between fetal foot length and ges-tational age was y = 7.130 ± 0.503x which was comparatively related to the ob-served equation in the present study (y = 11.7 ± 0.34), where y = gestational age in week and x = FFL1 in mm.
Joshi et al. [7] found a significant correlation between fetal foot length and gestational age (r = 0.970, p = 0.0001) and between fetal foot length and femur length (r = 0.980, p = 0.000) in 779 pregnant women between 15 to 40 weeks of gestation in Nepalese Context. However in the present study correlation coeffi-cient between FFL1 and gestational age (r = 0.828, p < 0.0001) and between FFL1 and femur length (r = 0.915, p < 0.0001) was found. The variation in values in our study was lower or higher due to significant racial and socioeconomic dif-ferences between individuals of the present study and that of previous studies such as the comparison between the values of FFL1 of present study with pre-vious studies done by Pandey V D etal.[14], Rajesh Bardale etal.[15], Shripad Hebbar etal.[8], Andrzej etal.[13] and Joshi etal. [7].
DOI: 10.4236/ojmi.2017.74023 259 Open Journal of Medical Imaging
were observed between sex type and between right or left side measurements. However his results are generally in close agreement with FFL1 in our study in which we observed no significant correlation between the sex of embryo and FFL1, (Pearson Correlation is −0.025 and 2-tailed is 0.617).
The data of the present study is in accordance with those conducted by Rajesh Bardale MD etal.[15] how analyzed the measurements of foot length applicabil-ity in fetal age assessment. Such authors examined 123 fetal foot that aged 12 - 40 weeks and foot length revealed high correlation with gestational age (r = 0.975, p < 0.0001).
Furthermore Shripad Hebbar etal. [8] concluded that the normal developing fetus, the foot length increases with advancing gestational age. A longitudinal study was taken in 2013 in which authors were examined 50 manipalian patients, starting from 16 weeks till term. The mean age of patients that were studied was 24.7 years, 36% of them were primagravida. That means, the data demonstrated strong correlation on comparison of linear regression of foot length versus ges-tational age with correlation coefficient (r = 0.97, p < 0.001) which is compara-tively much higher than the FFL1 that detected in the present which showed correlation coefficient (r = 0.828, p < 0.0001) although both sets of studies were consistent, with the equation relationship between fetal foot length and gesta-tional age was y = 14.02 ± 2.36x which was comparatively related to the observed equation in the present study (y = 11.7 ± 0.34), where y = GA in week and x = FFL1 in mm.
Jowita Woźniak et al.[11] in 2009 analyzed the length and width measure-ments of fetal foot in the autopsy. They examined around 158 fetuses 62 females and 96 males aged between 13 - 32 weeks of fetal life: Anthropological and pre-parational methods are used and they found strong correlation between foot length and week of foetal life (r = 0.749, p < 0.0001 with the regression equation: FFL1 = −11.7 + 1.59x week) and correlation between foot width and gestational age (r = 0.980, p < 0.0001 with the regression equation: FFW = −4.2 + 0.64x week): The rate of female feet growth in the analysed foetal period was stable and amounts to 1.79 mm/week and was bigger one of the males (1.51 mm/week) and left and right limb feet lengths and widths did not differ significantly. The results obtained herein was comparatively much lower than the FFL1 and FFW and study showed correlation coefficient of FFL1 (r = 0.828, p < 0.0001 with eq-uation: Y = 11.7 + 0.34x) and correlation coefficient of FFW (r = 0.720, p < 0.0001 with equation: Y = 33.64 + 1.89x) although both studies were consistent, Regression model formed on the basis of direct measurements on autopsy ma-terial differs significantly from the ultrasound models, which make own study more reliable.
DOI: 10.4236/ojmi.2017.74023 260 Open Journal of Medical Imaging
These data was unaffected by gender, environmental tobacco smoke, maternal smoking and alcohol consumption factors. When comparing the results of the FFL1 in the present study with that of previous workers the present study was concordant with that of previous studies.
Meirowitz etal.[9] in 2000 conducted a large-scale ultrasound examination of foot length on 5372 singleton fetuses between 15 and 37 weeks of gestation. They observed that fetal foot length was a reliable predictor of gestational age even in reading extremes of fetal growth. However in fetuses with growth abnormalities, fetal foot length can affect measurement of the fetal foot and incorporates both soft tissue and bone. Soft tissue stores of subcutaneous fat are reduced in cases of growth restriction and increased in situations of accelerated growth. Therefore it makes sense that fetal foot length is relatively smaller in the SGA fetus and larger in the LGA fetus.
Moawia etal.[17] in 2014 studied 100 cases with 81 multiparous and 19 nul-liparous, the maternal age ranged between 15 and 45 years. Comparison of mean values of foot lengths was possible with the present study. They compared fa-vorably with each other R2 values in both these studies are high indicating a strong relation between gestational age and foot length; 0.94 and 0.828, respec-tively, for Moawia’s study and the present study. A P value obtained from both studies is less than 0.05 (less than 0.001 for Moawia’s study and less than 0.001 in the present study) which is statistically significant. Standard error of regression coefficient was 0.144 in Moawia’s study and 0.069 in the present study. Both these values are statistically significant.
Available literature did not provide FFL2 which was the aim of the survey. Our results suggested that the measurements of fetal foot measurements with ultrasound are a reliable assessment of anatomical fetal foot length and highly correlated to the menstrual age of the fetus.
In the present study, strong associations of the different fetal growth parame-ters showed the importance of these fetal measurements in the assessment of GA, and it might be widely applicable for further investigation purposes. Though the mean foot measurements of all the above studies showed there was a positive linear relationship between foot measurements and gestational age. The correlation coefficient (R-value) of foot measurements and gestational age was different in different studies. Never the less foot measurements were correlated well at least with one or many anthropometric measurements. However the use of fetal foot measurements for gestational age assessment has limitations partic-ularly in fetuses with growth abnormalities.
In the present study, strong correlations between the fetal foot measurements and fetal weight. The most precise means of estimating FW was (1858.57 gm.), the model that include FFL1 alone (1859.75 gm).
The most precise means of estimating FW was (1858.57 gm) comparing with the model that include FFL2 alone (1859.74 gm).
DOI: 10.4236/ojmi.2017.74023 261 Open Journal of Medical Imaging
5. Conclusions
All measurements of the foot were significantly increased with increasing of GA.
Reference ranges that developed in the present study can enable accurate evaluation of gestational age throughout pregnancy.
Nomograms of foot measurements for Sudanese fetuses of 14 - 40 weeks ges-tation are provided.
Such study can be used in the detection of fetal limb anomalies such as short limb dwarfism. In addition linear growth functions are observed between foot measurements with the common fetal biometric parameters such as BPD, HC, HA, FL, AC, AA and FL.
Foot measurements could be used to predict from these common fetal bio-metric parameters in fetal weight formulas.
Furthermore, linear correlation between foot measurements has been eva-luated and considered extremely significant; hence FFL1 could be calculated from FFL2 and vice versa.
The measurements of foot could be considered as one of the reliable methods for assessing gestational age, and foot measuring is an easy and reliable me-thod of fetal age evaluation in anatomical and ultrasound studies.
References
[1] DeCherney, A., Nathan, L., Goodwin, T.M. and Laufer, N. (2012) Current Diagnosis and Treatment Obstetrics, and Gynecology. 10th Edition, McGraw-Hill Medical, New York City.
[2] Falatah, H.A., Awad, I.A., Abbas, H.Y., Khafaji, M.A., Alsafi, K.G. and Jastaniah, S.D. (2014) The Accuracy of Ultrasound to Determine Gestational Age in the Third Trimester. OpenJournalofMedicalImaging, 4, 126-132.
https://doi.org/10.4236/ojmi.2014.43018
[3] Butt, K. and Lim, K. (2014) Determination of Gestational Age by Ultrasound. Jour-nalofObstetricsandGynaecologyCanada, 36, 171-183.
https://doi.org/10.1016/S1701-2163(15)30664-2
[4] March, M.I., Warsof, S.L. and Chauhan, S.P. (2012) Fetal Biometry: Relevance in Obstetrical Practice. ClinicalObstetricsandGynecology, 55, 281-287.
[5] Salomon, L., Alfirevic, Z., Berghella, V., Bilardo, C., Hernandez, E., Johnsen, S.,et al. (2011) Practice Guidelines for Performance of the Routine Mid-Trimester Fetal Ultrasound Scan. UltrasoundinObstetricsandGynecology, 37, 116-126.
https://doi.org/10.1002/uog.8831
[6] Medicine AIoUi (2013) Aium Practice Guideline for the Performance of Obstetric Ultrasound Examinations. Journal ofUltrasound inMedicine: Official Journalof theAmericanInstituteofUltrasoundinMedicine, 32, 1083.
[7] Joshi, K., Marahatta, S., Karki, S., Tamrakar, S. and Shrestha, N. (2012) Fetal Foot Length and Femur/Foot Length Ratio: Significance in Nepalese Context. Nepalese JournalofRadiology, 1, 15-22. https://doi.org/10.3126/njr.v1i1.6317
[8] Hebbar, S., Kopal, S., Adiga, P., Rai, L. (2013) Fetal Foot Length throughout Gesta-tion: A nomogram. SriLankaJournalofObstetricsandGynaecology, 35, 58-61.
DOI: 10.4236/ojmi.2017.74023 262 Open Journal of Medical Imaging [9] Meirowitz, N.B., Ananth, C.V., Smulian, J.C., McLean, D.A., Guzman, E.R. and Vintzileos, A.M. (2000) Foot Length in Fetuses with Abnormal Growth. Journalof UltrasoundinMedicine, 19, 201-205.
[10] Lutterodt, M.C., Rosendahl, M., Yding Andersen, C., Skouby, S.O. and Byskov, A.G. (2009) Age Determination Enhanced by Embryonic Foot Bud and Foot Plate Mea-surements in Relation to Carnegie Stages, and the Influence of Maternal Cigarette Smoking. HumanReproduction, 24, 1825-1833.
https://doi.org/10.1093/humrep/dep176
[11] Chikkannaiah, P. and Gosavi, M. (2016) Accuracy of Fetal Measurements in Esti-mation of Gestational Age. IndianJournalofPathologyandOncology, 3, 11-13.
https://doi.org/10.5958/2394-6792.2016.00003.X
[12] Mukhia, R., Mukherjee, A. and Sabnis, A. (2016) Determination of Gestational Age of Human Fetuses from the Crown-Heel Length, Crown-Rump Length, Foot Length and Abdominal Circumference. InternationalJournalofRecentScientificResearch, 7, 8164-8166.
[13] Singh, V., Usmani, Y., Pandey, V.D., Nigam, G., Yadav, Y. and Sharma, A. (2015) Ultrasonographic Fetal Gestational Age Determination. Journal of Anatomy, 23, 20-24.
[14] Pandey, V.D., Singh, V., Nigam, G., Usmani, Y. and Yadav, Y. (2016) Fetal Foot Length for Assessment of Gestational Age: A Comprehensive Study in North India.
JournaloftheAnatomicalSocietyofIndia, 65, S19.
https://doi.org/10.1016/j.jasi.2016.08.068
[15] Rajesh Bardale, M. and Sonar, V. (2008) Assessment of Gestational Age from Hand and Foot Length. IndianJournalofForensicMedicine & Pathology, 1, 47-51. [16] Bulandra, A.M., Kuczera, M., Machnik, J., Kuczera, B.M. and Gielecki, J.S. (2004) Is
Manual Foot Length Measurement of Comparable Value to Ultrasound Femur and Humerus Measurement in Anatomical Studies for the Assessment of Fetal Age? Fo-liaMorphologia-Warszawa-EnglishEdition, 63, 203-208.