DUCTILITY OF REINFORCED CONCRETE BRIDGE PIERS
UNDER SEISMIC LOADING
A report submitted in partial fulfilment of the
requirements for the degree of
Master of Engineering, at the University of Canterbury,
Christchurch, New Zealand.
by
ANG BENG GHEE -;:
ABSTRACT
A continuation of the extensive research project undertaken in
"
the University of Canterbury on ductility of bridge piers is reported. The testing described herein covers an experimental investigation into the post-elastic ductile behaviour of reinforced concrete bridge piers, particularly into the influence of aspect ratio on such behaviour.
The test units, two octagonal and two square sections, were
-designed according to the Second Draft of the Concrete Design Code DZ 3101, for different axial load levels. The testing included slow static incremental loading followed by fast dynamic cyclic loadings.
The results are presented in the form of load-displacement hysteresis curves, curvature profiles and transverse steel strain distribution. Discussion of results deals with the comparison of ultimate moment capacities, measured ductilities, equivalent plastic hinge lengths, maximum concrete compression strains, the ultimate shear forces, the enhancement of concrete strength by confinement and the idealized stress-strain curves for confined concrete.
-ACKNOWLEDGEMENTS
The research reported herein was carried out in the Department of Civil Engineering, University of Canterbury, under the overall guidance of Professor R. Park.
The project was supervised by Dr. M.J.N. Priestley and Professor R. Park, whose advice, guidance and encouragement is gratefully acknowledged.
I wish to take the opportunity to express my appreciation of the assistance given by the Senior Technical Officer, Mr. N.W. prebble, and all the technical staff of the Department who, in one way or
another, contributed towards the success of the project . . Special
acknowledgements are given to Mr. G. Hill, Mr. G. Clark and Mr. A.H. Bell, because their helpful advice and valuable practical experience in the process of construction and testing enabled me to achieve the successful results.
I am also very grateful for the generous financial assistance provided by the National Roads Board.
Furthermore, the work of Mrs. D.E. Ball in typing the manuscript is very much appreciated. Many thanks to her.
TABLE OF CONTENTS
Page
Abstract i
Acknowledgements ii
Table of Contents i i l
List of Figures vi
List of Tables ix
Notation x
CHAPTER ONE INTRODUCTION 1.1
1.2 1.3 1.4 CHAPTER TWO
2.1
2.2
2.3
General
Aim and Scope
Review of Previous Projects Format
DESIGN AND CONSTRUCTION OF TEST SPECIMENS Design of Column Specimens
1 1
2 5
6
2.1.1 Octagonal section 6
Cal column designation 6
(b) Designed material and section properties 6 (c) Longitudinal reinforcement 8
Cd) Spiral steel ratio 8
Cel pitch of spiral, Sh 9
(f) Potential plastic hinge region 9
(g) Shear design 10
2.1.2 Square Section 13
(a) Column designation 14
Cb) Designed material and section properties 14 Cc) Longitudinal reinforcement 14 Cd) Transverse reinforcement 14
Cel Hoops' spacings, Sh 15
Cf) Potential plastic hinge region 15
Cg) Shear design 15
Construction Process 2.2.1 Mould construction
2.2.2 Fabrication of steel cage 2.2.3 Placing of concrete
Instrumentation
2.3.1 Strain gauges for measuring shear, confining and longitudinal strains
15 15 17 17 20 20
?
CHAPTER THREE
3.1
3.2
3.3
CHAPTER FOUR 4.1
4.2
2.3.2 Dial gauges for measuring curvature and longitudinal strains
2~3.3 Dial gauges for measuring horizontal displacement
2.3.4 Linear potentiometer for measuring horizontal displacement
TESTING PROCEDURE Loading Frame
Specimen Installation Testing Proper
RESULTS AND OBSERVATIONS
Summary of Material properties and Test Unit Details
Results and Observations
Page 23 24-24 26 29 29 32 38
4.2.1 Specimen One 38
(a) General description 38
(b) yield displacement and yield curvature
derivation 39
(c) Lateral load vs displacement curve 44 (d) Curvature profiles and curvature ductility 44 (e) Transverse steel strain 46 (f) Maximum concrete compression strain 49
(g) Equivalent plastic hinge length 49 (h) Idealized stress-strain curve 52
4.2.2 Specimen Two 55
(a) General description 55
(b) Yield displacement and yield curvature
derivation 57
(c) Lateral load vs displacement curve 57 Cd) Curvature profiles and curvature ductility 57 (e) Transverse steel strain 57 (f) Maximum concrete compression strain 62 (g) Equivalent plastic hinge length 62 (h) Idealized stress-strain curve 62
4.2.3 Specimen Three 67
(a) General description 67
(b} yield displacement and yield curvature derivation
(cl Lateral load vs displacement curves
67
70
CHAPTER FIVE 5.1 5.2
.s.3
Page (d) Curvature profiles and curvature ductility 70
(e) Transverse steel strain 70
tf} Maximum concrete compression strain 74 (g) Equivalent plastic hinge length 74 (h) Idealized stress-strain curve 74
4.2.4 Specimen Four 77
(a) General description 77
(bl Yield displacement and yield curvature
derivation 77
(c) Lateral load vs displacement curve 80 Cd) Curvature profiles and curvature ductility 80
(e) Transverse steel strain 80
(fl Maximum concrete compression strain 84 (g) Equivalent plastic hinge length 84 (h) Idealized stress-strain curve 84
DISCUSSION OF RESULTS Deflection Behaviour
Concrete Compression Strains Equivalent plastic Hinge Lengths
87 87
90 5.4 Curvature Distributions and Curvature Ductility
Factors 91
92 93 93 94 99 5.5 5.6 5.7 5.8 5.9 5.10
CHAPTER SIX
6.1
6.2
APPENDIX
Confining Steel Strains
Transverse Steel Strains Due to Shear Ultimate Loads
Ultimate Moment Capacities Ultimate Shear Capacities
Code Provisions for Transverse Confinement Steel for Ductility
CONCLUSIONS AND RECOMMENDARIONS FOR FUTURE RESEARCH Conclusions
Ca)
(bl (c) (d) (e) ( f) (g)Lateral load-displacement relationship Concrete compression strains
Equivalent plastic hinge lengths Curvature distributions and curvature ductility factors
Confining steel provisions Ultimate moment capacities Ultimate shear capacities Recommendations for Future Research
LIST OF FIGUFES Figure
2.1 a & b Dimensions of specimens
2.2 Pier idealization
2.3 a & b Reinforcing details
2.4 Octagonal mould construction 2.5 Centre block construction
2.6 a
&
b Reinforcing cage2.7 a & b Steel cage in mould
2.8 a & b Identification of strain gauges
2.9 a,b & c Strain gauges for curvature measurements 2.10 a Dial gauge position
2.10 b Dial gauge stand
3.1 a Loading frame
3.1 b Force diagram
3.2 a & b Details of loading frame
3.3 Loading sequence
3.4 a & b General view of test set-up
4.1 a,b,c & d Stress-strain curve for reinforcing steel 4.2 a Load vs displacement (Unit 1)
4.2 b 4.2 c 4.3 4.4 4.5 4.6 4.7 4.8 4.9
, 4.10 a
Dynamic cycles at ~
=
8 (Unit 1) oDisplacement computation Yield curvature (Unit I) Measured curvature profile
Measured confinement strain distribution (Unit 1)
Measured shear strain distribution (Unit
11
E: vs ~ (Unit 1)
cu
Equivalent plastic hinge length L vs ~ (Unit 1)
p
Figure
4.10 b
4.11 4.12 4.13 4.14 4.15 4.16 4.17 4.18 4.19 4.20 4.21
4.22 a
4.22 b 4.23 4.24 4.25 4.26 4.27 4.28
4.29 a
4.29 b
4.30 4.31 4.32 4.33 4.34
Modified Park-Kent stress-strain curve for confined concrete
Analytical stress~strain curve for confined concrete (Unit I}
Moment computation
Load vs displacement (Unit
2l
Hysteresis loops at II=
6 ando
=
8Page 53 54 56 58 59
Yield curvature (Unit
2l
60Measured curvatire profile (nni t 2 1 6 1
Measured confinement strain distribution (Unit 2) 63
Measured shear strain distribution (Unit 2) 64
S vs II (Unit 2)
cu
L vs II (Unit 2)
p
Analytical stress-strain curve for confined concrete (Unit 2)
Load vs displacement (Unit 3)
65 66
66 68
Dynamic cycles at llo = 6.12 and 7.65 (Unit 3) 69
Yield curvature (Unit 3)
Measured curvature profile (Unit 3)
Hoop strain distribution (Unit 3)
S vs II (Unit 3}
cu
L vs II (Unit 3}
p
Analtyical stress-strain curve for confined concrete (Unit 3)
Load vs displacement (Unit 4)
Dynamic cycles at Jl
=
6 oYield curvature (Unit 4)
(Unit 4)
Measured curvature profile (Unit 41
Hoop strain distribution (Unit 4)
S vs II (Unit
4>-cu
L vs II (Unit 4)
Figure
4.35
5.1 5.2 5.3 a
5.3 b
5.4 a & b
Analytical stress-strain curve for confined concrete (Unit
41
ACI stress block
Confining lateral pressure
L
M
JZ.
vsh
VDL P
: vs fl A e
c g
Code provisions for transverse steel for confinement
viii
Page
86 95
96 96
96
TABLE
4.1
5.1
5.2
5.3
5.4 5.5
LIST OF TABLES
Test unit details
Ultimate moment capacities tkNmt and yield displacement
Cmrnl
Concrete compression strains, equivalent plastic hinge lengths and curvature ductility factors Comparison of ultimate moment capacities (kNm) at high concrete compression strains
Ultimate shear forces (kN}
Variation of equivalent plastic hinge length with axial load level, spiral steel content
and aspect ratio
Page
88
89
98
100
[image:10.600.67.538.55.824.2]r
A c A g A sh A sp A v b c d D,h d,h"
s E c f C fl C fl cc fll cc fR, f Y fyh H u I gross I cr K
=
=
=
==
===
=
=
KI ,K2,K3
,f\
kl ,k3 =
NOTATION
area of concrete core measured to outside of hoops or spirals.
gross area of section.
total effective area of hoop bars and supplementary cross ties in direction under consideration within spacing s h ' area of spiral steel.
area of shear reinforcement.
width of compression face of member. neutral axis depth.
distance from extreme compression fibre to centroid of tension reinforcement.
overall lateral dimension of section.
lateral dimension of section to outside of transverse reinforcement.
modulus of elasticity of concrete. concrete compressive stress.
compressive cylinder strength of concrete. enhanced concrete compressive strength.
experimental enhanced concrete compressive strength. lateral pressure on concrete due to confinement. yield strength of longitudinal reinforcement. yield strength of transverse reinforcement. ultimate lateral load.
moment of inertia of section.
moment of inertia of cracked section neglecting tension contribution from concrete.
concrete strength enhancement factor.
=
concrete compressive stress block parameters.factors for equivalent plastic hinge length computation, depending on steel and concrete strength.
M
M ==
u
NA ==
n
Pe
Sh ==
V
c
V
s
V ==
u
V. ==
1-V u vb v c z,z m
11
11
P11
==Y E: c E: cu E: 20c E: sh E: Y
110 == 11
¢
¢
== u<Py
==e
==moment of resistance. ultimate moment. neutral axis modular ratio
maximum design axial load due to gravity and seismic loading.
pitch of spiral reinforcing or centre to centre spacing of hoop sets.
shear force carried by concrete.
shear force carried by shear reinforcement. ultimate shear force.
ideal shear strength of section. ultimate shear stress.
basic shear stress.
ideal shear stress provided by concrete.
slope of falling branch of concrete stress-strain relation.
lateral deflection.
lateral deflection. due to inelastic deformation beyond lateral deflection at first yield.
concrete compressive strain.
ultimate concrete compressive strain. concrete strain at 0.2f'
c
strain at qtrain-hardening of steel. steel strain at commencement of yield. overall displacement ductility factor. displacement ductility factor.
section curvature or strength reduction factor. ultimate curvature.
curvature at first yield. rotation of centre-block.
11
plastic rotation.
ratio of transverse steel to volume of concrete core measured to the outside of transverse steel.
xii
CHAPTER ONE
INTRODUcrION
1.1 GENERAL
I t has been shown by dynamic analyses that the theoretical response inertia loads of structures responding elastically to severe earthquake ground motions are significantly greater than the static design lateral loads recommended by codes such as NZS 4203 el}. However, i t would be very uneconomical to design structures to respond elastically to such high inertia loads. Hence/-if the structures are to survive through such severe earthquakes, some means of energy dissipation need. to be provided. So, unless devices such as mechanical energy dissipators are incorporated in the design, the structures must possess sufficient ductility so that seismic energy can be absorbed and dissipated by some form of
post-elastic deformation.
Unlike buildings, column hinging in bridge structures is not easily avoidable if adequate ductility is to be achieved. In order to obtain such column hinges sufficient transverse confining reinforcement must be provided to confine the concrete core as well as to prevent the brittle shear failure and at the same time, providing lateral support to the longitudinal flexural reinforcement which, otherwise, will buckle laterally under high axial compression.
The 1971 San Fernando earthquake resulted in the collapse of 5 bridges together with 42 others suffering significant damage. The main cause of the failures was attributed to the inadequate detailing of the bridge columns in terms of providing enough transverse steel in the plastic hinge regions, and in the anchorage of the transverse steel. Nevertheless, this earthquake did give impetus to later research on the seismic design practice for bridges.
At the University of Canterbury, research into the ductility demand and ductility capacity of bridge piers under seismic attack has been
carried out during the past decade. this extensive research programme.
1.2 AIM AND SCOPE
This project is a continuation of
F
?J
reversed flexure and axial loads. Particular attention will be given to
and
(l) the influence of aspect ratio on the ductility of bridge
(21
piers,
the shear carried by the concrete confined by transverse reinforcement
(2,31.
Since significant efforts have been made to discuss and define the term "ductility" and the ductility demand criteria in several previous projects, i t is not the intention of this report to elaborate on this topic again.
In this research project, 4 column specimens (2 octagonal and 2 square sections) were designed to the code specifications of the Second draft of DZ 3101 (17) for different levels of axial load. The specimens were similar to those studied by R.T_ potangaroa (4) and W.D. Gill (5) except that the lateral dimension of the cross-section was reduced while the length was increased so as to increase the aspect ratio. Comparison with their results is included in the later part of this research report.
1. 3 REVIEW OF PREVIOUS PROJECTS
A series of theoretical and experimental investigations into the seismic resistance of reinforced concrete bridge columns w,as conducted at the University of Canterbury. The following paragraphs give a brief
2
review of the related work conducted during M.E. and ph.D. investigations: Year*
1969
1971
Brief description of project
Kent (6) investigated the behaviour of flexural
members with concrete confined by transverse reinforce-ment. He attempted to present theoretical stress-strain relations for steel and confined rectangular concrete sections under monotonic loading. The idealization of
stress-~train characteristics of confined concrete was assumed to act as the envelope for cyclic behaviour. Sampson (7) made a theoretical study of the effect of confinement of concrete on curvature ductility for
columns under monotonic loading. A computer program was then developed to investigate the parameters which
influence the stress-strain behaviour.
1972
1974
1975
1975
1976
3
Norton (8} extended the work of Sampson by further studying the moment-curvature characteristics of rectangular eccentrically loaded reinforced columns. He discovered that the then design procedures
recommended by some seismic codes of practice were unsound and inadequate. He suggested an alternative and more rational procedure for detailing.
Leslie (9} conducted a comprehensive literature survey into the research on th~ characteristics of confined concrete. From the surveyed materials, he proposed an idealized stress-strain relationship for circularly confined concrete. He also undertook the laboratory testing of grade 380 reinforcing steel to obtain the required cyclic stress-strain behaviour.
Davey (10) started the first testing of reinforced concrete bridge piers, the prototype structure of which was designed according to the MWD "Highway Bridge Design Brief" (15). He subjected the 3 one-third scale
octagonal models to static cyclic loading with different moment to shear ratio and found that large post-elastic deformations were available for all the units tested. Cameron (II} carried out a series of computer analyses to investigate the effects of several parameters on the inelastic seismic response of bridge piers. He drew conclusions on several factors which have significant effects on the seismic resistance performance of bridge piers. Among them were the hysteresis loop shape and the foundation flexibility. He further concluded that the MWD specification of displacement ductility capacity of 6 for. highway bridges was a realistic requirement. Munro (12) continued the experimental work by testing a unit similar to those of Davey's but with a higher spiral steel content. He also tested an identical pier at
r
1978
1979
1979
4
Ng (13) "investigated the interaction between additional foundation flexibility, earthquake characteristics and ductility demand using computer modelling. He further tested Munro's one-sixth model which had not been shaken to destruction and another one-sixth model with large transverse reinforcement content and subject to high axial load. Testing of his second unit showed good ductile behaviour.
Gill (51 conducted tests on 4 full-size reinforced concrete colunms with various quantities of rectangular hoops, designed in accordance with the draft concrete code DZ 3101, and subjected to various levels of axial load. The columns were tested under simulated earthquake loadings and the results obtained showed good ductile behaviour. Considerable enhancement of flexural strength was observed over that calculated by normal code design procedures.
Fotangaroa (4) conducted tests similar to Gill's work but on octagonal specimens with spiral reinforcement. Again, the results demonstrated good ductile behaviour for the columns designed to the confinement requirements of DZ 3101. He also noticed a large increase in the flexural strength and the high maximum concrete strains at the extreme compression fibre of the confined core. The above review, though not fully comprehensive, illustrates the trend along which the research programmes have been conducted. Since this project is the continuation of Gill's and Potangaroa's work, more detailed descriptions of their projects and results will be given elsewhere in other chapters.
!
Concurrently, there was a parallel study oy T. Zanza on similar sized specimens investigating the influence of laps in the plastic hinge zone which was provided with half of the confining steel required by DZ 3101.
1.4 FORMAT
In Chapter 2, the design and construction of the test specimens are described. Besides the theoretical calculations, the practical aspects of construction and instrumentation will be discussed.
Chapter 3 contains the description of the testing procedures
employed which include the design of a new loading frame and the process of specimen installation.
The results and observations of the tests form the contents of Chapter 4. A summary of material properties is included as well.
Chapter 5 presents the discussion and analysis of the results. Comparison with those of Gill's and Potangaroa's studies will be put forward. Confinement for the test columns is compared with requirements from various codes (16,17,18).
Finally some conclusions are drawn and recommendations for future research made in Chapter 6.
CHAPTER TWO
DESIGN AND CONSTRUCTION OF TEST SPECIMENS
2.1 DESIGN OF COLUMN SPECIMENS
The installation in 1978 of the 10 MN Dartec Universal Testing machine at the University of Canterbury had enabled the testing of full size or near full size models of column units in the last two projects
6
(4,5) . The same facility was used for the present project which involved similar testing procedures on more slender columns. Fig. 2.la and Fig. 2.lb show the dimensions of ~he column specimens tested. The lateral dimension of cross-section was deliberately decreased to 400 mm and the longitudinal dimension increased to 1.6 m in order to achieve a ratio of shear span to member thickness of four which was twice that of the
previous two projects. The governing factor for the dimension was the maximum clear height, after making allowance for plates and rollers, available within the Dartec machine. Eventually, an overall length of 3.9 m was adopted and this length gave enough room for rotating the specimen into its vertical position (see Sec. 3.2) 0.
2.1.1 Octagonal Sectlon
(a) Column designation
The columns were numbered according to the sequence at which they were cast and tested.
Two octagonal specimen$ were designed and detailed for the following axial load levels:
P
Specimen 1 e 0.12
f' A c g
P
Specimen 2 e 0.53
f'
A c gFinal levels of axial load provided were calculated and adjusted to give an exact concordance with DZ 3101 confinement requirements, using the actual material strength.
(b) Designed material and section properties
Aspect ratio
=
1600 400-
r-0
o
0
1
U"l
I:'--
or-~I
I
, -
I-e>
I
8-8
e>~
...:r
f-~
~
600x 400
TRE
BLOCK
A
t
0
12-HD16
FIG.
2.1 b
e>
0 to
~
c::>'f-I..il
....!:::.-'-600x
CEN
t
~
p
0
400
B
t
~
e>
N
0
.--l{)
I:'--0
~
400
./
N
.--.J
1--
3 4.5
mm
COVER TO MAl
N
STEEL
( A- A
I
!I
B
t
FIG.
DIMENSIONS OF SPECIMENS
[image:20.595.45.551.45.820.2]I
132775 2
A rom
g
109858 2 (cover
A
=
nunc
fl :::; 30 MFa c
E 47001E'
c c
25.7 x 10 3 MPa
. . . 4
4 'If x 0.4
=
mgross 64
1.2566 x 10- 3 m 4 f
=
275 MFa nominaly
275 MPa nominal
(c) Longitudinal reinforcement
13 nun}
Adopting the same amount of steel content as in Potangaroa's specimens,
P
t
=
0.0243, the area of longitudinal steel required was 2C
~)
x area of 16 - D24'3
2
=
3217 nunThis value gave sixteen D16 bars having the same arrangement as those in Potangaroa's specimens (Fig. 2.lal.
8
The longitUdinal bars were welded to 10 nun end plates at both ends of the specimens to ensure enough anchorage.
Cd) Spiral steel ratio
In accordance with Second Draft of DZ 3101 (17), Clause 6.4.4.3 (a-I), the special transverse spiral steel required for confinement in potential plastic hinge when
p
<
0.7 f' A ise c ,g
A fl P
0.45 [ ~- 1] c [0.5
+
eP
s AfYh
1.25 f, A
c c g
(1)
f' p
o
12 ~ [0.5+
eJ
or
P
s
=
. f 1.25 f'Ayh c g
(2)
whichever is the greater. The corresponding equations in First Draft (16) were modified to give the above equations which provide some extra confinement at low axial load levels, and compensate for the possibility of the actual value of f' significantly exceeding the specified
c
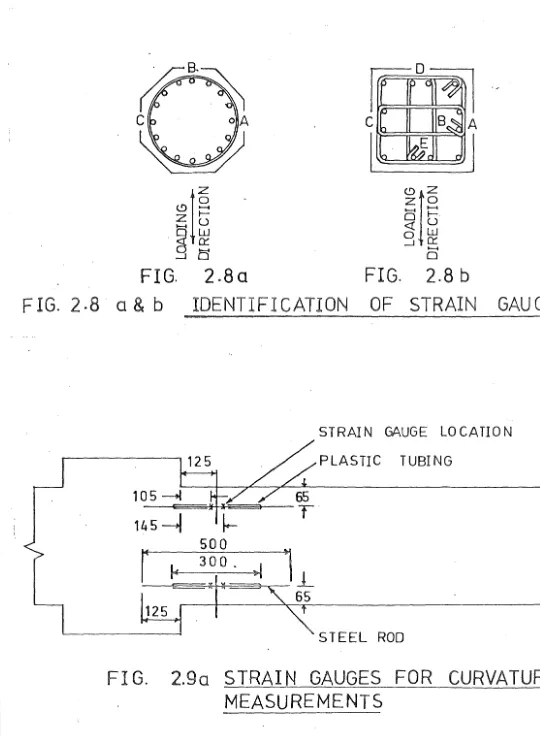
Since 0.45
I
J
- lJ
=
0.09<
0.12, Equation (2) governed and Aaccordingly c
p for specimen 1
=
0.00851 sand Ps for specimen 2
=
0.0015224
AP (provided)
=
~" where d*=
400 - 2 xl3 nun.s d Sh s
s
374 nun
=
Fig.2.3a gives the details of the amount of spiral steel provided.
2
* The cover concrete~as scaled from 20 nun to - x 20
3 13 nun. (e) pitch of spiral, Sh
From DZ 3101 requirements, the maximum centre to centre spacing between spirals should not exceed the smaller of
(i1 one-fifth of column diameter
=
--nun 4005
=
80 nun(iH
six times the longitudinal bar diamater 6 x 16 mm96" nun
or (iii) 200 nun
In Clause 6.4.4.3 (a-3), the third criterion of 200 mm replaces the original requirement of 125 mm (from the first draft of DZ 3101) because i t was felt that adequate confinement of the concrete core of columns with diameter less than 1.0 m would be obtained with first criterion of the three (2).
Therefore the maximum allowable pitch for spirals in both specimens was 80 mm.
Over the remaining length of the columns the spacings of spirals were governed by the shear requirements as shown in Fig. 2.3a.
(f) Potential plastic hinge region
According to the code specifications (Clause 6.4.4.1), for
specimen 1 where P
<
0.3 f' A ,the potential plastic hinge is takene c g
to be not less than
(i)
or (ii)
the diameter of cross-section
where the moment exceeds 0.8 the maximum moment at that end of the member
400 nun
[image:22.598.112.541.56.201.2]Hence, 400 rom governs for specimen 1, and for specimen 2 where
p
>
0.3 fl A , the potential plastic hinge region extends over thee c g
region not less than
or
eil
(ii)
1.5
times column diameterwhere the moment exceed
0.7
of the maximum moment at that end of the memberTherefore, 600
rom
governs for specimen 2.=
1 .. 5 x 400 nun=
600 rom~ 0.3 x 1600 rom
= 480 rom
The potential plastic hinge region had been modified from the first draft of DZ 3101 to take into account the greater spread of plasticity under high axial load levels
(2i.
(g) . Shear design
Using the appropriate column design charts of the ACI publication, "Ultimate Strength Design of Reinforced Concrete Columns" (19), the
moment capacities of the columns can be determined. The chart values for flexural strength were adjusted to give a capacity reduction factor,
~ , of unity. 0.75 times the axial loads were input to obtain the
chart values of ultimate strength which were then multiplied by a factor 1
of 0.75 The resulting moment was then factored by 1.25 to give the overstrength moment expected from strain hardening and material strength exceeding specified values.
The design shear force was calculated from the computed flexural strength, taking into account the p-~ effect. Referring to Fig. 2.2, the ultimate moment
M
u
Therefore using the I
H cr then be 2u •
H u
( 2:
x 1. 6)+
P e ~ (3)H = u
value.
M - P ~
u e
0.8 where the value of ~ was obtained The ultimate design shear force*, V, , would
u
10
From Second Draft of DZ 3101, Clause 7.4.2, the shear force carried by concrete in
v
c
potential plastic hinge
4Vb}
f~~
- 0.1, c g
regions is given by
(4)
* Since the capacity design approach was used, the strength reduction factor ~ was taken to be unity and consequently V
=
V ..Hu-+
2
II
I I
\ \
\
\
Hu
\
t
-2
E
ULTIMATE MOME NT
ULTIMATE LATERAL
LOAD
f
I
w3
0.. az
w E E aUNI T 1
1350
R G ot 50 mm
£
4-R6 TIES IN END BLOCKI
600
R6 ot 40mm
I
1)'-I
f
/.
I
1\
h
6 ' ! I \ q \ h
f L {
LI
_V
! \ I ! I \1- ~~
11 Iii U jL \L Jt/
I
~n
16 - D 16 ( EQUALLY SPACED )~200
I
~
300 850 8005
1R10atSOmm R 10 ot 150 mm I R 10 ot 55mm [image:25.598.71.570.58.832.2]~
I
UNIT 2I
...u
FIG.
2.30
REFORCING DETAILS FOR OCTAGONAL
~ UNIT 3
... I -U W v') 0:
«
- ' ::> u 0: U W I-«
-' 0.. o Z LJJ50 900 400
6 SETS Rl0 at 180mm SSETS R12 at
100mm
t===~~~
2-HD15 NEAR INNER FACE OF MAIN STEEL2 EXTRA
SE;:OO~F
TIES1
L
900 160 70 360
~~~~~---6 SETS R10 at 180 mm 1 SET RIO 5 SETS R10 at
55 110 55
90mm
SECTIONS
E
E
I
UNIT 4I
NOTE: SETS OF TIES REFER TO STANQArm SETS AS SHOWNIN FIG. 2.1b
a
FIG. 2.3 b
REFORCING DETAILS OF SQUARE SECTIONS
where
where
v
c
=
a
for ft e A c g<
(0.07
+
10p)1f'w
co.oslf'
<
v<
0.21fTc - b - c
0.1 , and
(5)
According to clause 7.4.3.2, Equation (41 applies over the end region which is not less than
(il the depth of member in the direction of earthquake forces
(ii} one-sixth the-height of the member
400 Illffi
3200 --6- mm
533 Illffi.
Therefore, for simplicity, i t was taken to be valid over a length of 600 mmi equal to the potential plastic hinge region of Specimens 2 and 3.
The rest of the shear force is resisted by the spiral steel, clause 7.2.1.3, i.e.
provided and
v
sv
u
v
cv - v
<
0.671fT <-clause 7.2.6.10)u c c
v
<
O.S1fT
(clause 7.4.4.5).u c
(6)
Beyond the regions defined by clause 7.4.3.2, shear contribution from concrete is taken to be
where
v
c
p
e
(1
+
3 ft Ac g
vb' (clause 7.2.2.1 (b»
is as given by Equation (5).
(7)
Finally, the shear resistance provided by the spiral steel was calculated using the following equation,
vs(provided)
=
4
TI ds
- A fyh Sh sp
(S)
and a minimum amount of steel to resist at least 0.35 MFa, clause
7.2.4.3, shear stress is desirable even if i t is found to be not required by virtue of Equation (6), i.e.
2.1.2 Square Section
v
>
V c - uwere
Cal Column designation
To follow up those of octagonal section, the 2 square sections
Specimen 3
Specimen 4
p
e fl A
c g
p
e
f ' A
c g
=
0.380.21
(b) Designed material and section properties
lc)
Aspect ratio = 1600
400
I
=
4
(c.f. 550 1200=
2.18, Reference 51
A
=
g 160000 mrn
2
2
A 13201 mrn , hn
=
351 mrn (RIO hoopsl c2
=
126025 mrn , hI( = 355 rom (R12 hoops) f'=
30 MPac
E 47001f'
c c
3 25.7 x 10 MPa
1 4 4
U X 0.4 m
gross
-3 4
2.1333 x 10 m
f
=
380 MPa yf '
=
275 MPa yhLongitudinal reinforcement
Conforming ,to the requirements as set out in Second Draft of DZ 3101, Clause 6.4.4.2, i t was decided to use 12-HD16 bars with the spacing as shown in Fig. 2.1 b. This amounted to a longitudinal steel content, P
t ' of 0.0151 (c.f. Pt
=
0.0179 of Gill's units) •. The anchorage provision was the same as that in octagonal section.Cd) Transverse reinforcement
For similar reasons (3), in clause 6.4.4.3(b), the equations in First Draft were modified to give the following equations: .
'f
I
!
=or
A f '
0.3 Sh h" [ A g - 1
J
cc fyh
I
0.5+
1. 25P
f'
c
0.12 Sh hit
I
0.5+
1.25 fyhe
f'A
c g
]
P
e
f'A
c g
A
] (9)
(l0)
whichever is greater. In the case under investigation, 0.3 [ ~ - 1 ] A
0.09 <0.12. Hence Equation (10) governed. c The arrangement of the hoops is summarized in Fig. 2.3b.
(e) Hoop spacings, Sh
Since the same lateral dimension of cross-section and same size of main steel were used, the maximum allowable spacing was still 80 mm.
(Sec. 2.1.1 (el).
(f) Potential plastic hinge region
The criteria for potential plastic hinge, region were decided by the length of column and the lateral dimension which were the same in the 2 different sections, hence, for
and
Specimen 3 Specimen 4 (g) Shear design
600 rmn
400 rom (Sec. 2.1.1
(f».
The basic design equations were the same as for spiral steel (Sec. 2.1.1 (gll except for some small variations in the provision for transverse steel. The value of shear resistance provided by the ties is given by
v
s
=
(11}where Sh is limited to be not greater than 0.5d (Le. about 180 rmn) nor 600 rmn , Clause 7.2,5.4. (a), and i t needs to be halved if
tv -
V )>
0.33if' , Clause 7.2.5.4 (cl.u c c
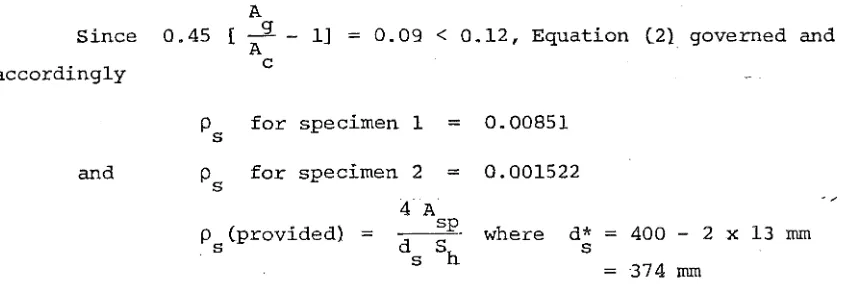
2.2 CONSTRUCTION PROCESS 2.2.1 Mould Construction
r
I
I
FI G. 2.4 OCTAGONAL MOULD CONSTRUCTION
FIG. 2.5 CENTRE
BLOCK
CONSTRUCTION
[image:29.597.68.548.68.838.2]The plywood was given a few coats of paint to prevent water absorption during curing. Just prior to placing the concrete any gap along joining edges was sealed with waterproof tape and the mould given a coat of oil to assist stripping of formwork after curing.
In the case of the octagonal section, cardboard was placed over the tight corners to prevent any breaking of these corners during ·stripping.
2.2.2 Fabrication of Steel Cage
From the experience in fabricating similar specimens in the last two projects, the fabrication process was easily accomplished. The construction sequence started with tying the transverse reinforcement to the main steel, starting from the centre and working out towards the ends. To be efficient time-wise, the main bulk of the reinforcement, i.e. the spirals and hoops, were bent by a steel fabricator outside the University. The longitudinal bars were then welded to the end-plates. The centre block reinforcing cage, Fig. 2.5, was constructed and the steel rods for the dial gauges were positioned and tied. The final procedures included placing the lifting hooks and positioning and welding the steel tubes at their correct locations.
There were some small variations in the construction process for the 2 different sections. For the octagonal specimens, the electrical resistance strain gauges were placed after the spirals were tied in
position, whereas the ties of the square sections were strain-gauged before they were placed. Furthermore, to control any excessive cracking of
concrete around the 2 reaction pins at the ends, the pitch of the spirals was reduced to 50 rom over a distance of 300 rom at these end regions while 4 additional R-6 ties were included. In the case of square sections 2
~-shaped steel were placed near the inner face of longitudinal bars together with 2 additional sets of ties, one at each side of the pin. (See Fig. 2 .6a,b) . Finally the spirals were lapped (about 100 rom) and single V flare welded. The ties were not welded.
2.2.3 Placing of Concrete
/
The completed steel cage was placed in the mould and the holding-rods were tightened to prevent the mould from moving apart during
FIG. 2.7
a
STEEL CAGE IN
MOULD
(OCTAGONAL)
[image:32.598.92.582.97.736.2]r
20 and vibrated, then screeded and later on floated. The sides of the mould were lig~tly tapped to remove any air bubbles trapped under the top
slanting sides of the octagonal section to eliminate the occurrence of blow-holes.
After initial set of the concrete has occurred the specimen was covered with damp sacks and plastic sheetings for about seven days before· stripping the forrowork. After stripping, any blow holes present were plastered and the specimen was given a coat of white paint to facilitate crack identification.
While the concrete was being placed, slump test was carried out to check against that specified in the order and nine standard concrete cylinders were made for later determination of concrete strength.
The concrete was provided by a ready mix contractor and the concrete properties specified were as follows:
Average aggregate size = 20 rom
2.3 INSTRUMENTATION
slump 75 rom
f'
=
30 MPa.c
2.3.1 Strain Gauqes for Me~?urinq Shear. Confining and Longitudinal Strains Since quite a positive result was arrived at in the previous
two projects, i t was felt that less extensive strain gauging would be sufficient. In fact, for each column, only one potential plastic hinge region was given a sufficient number of strain gauges to cover the whole area of interest.
serve as a check.
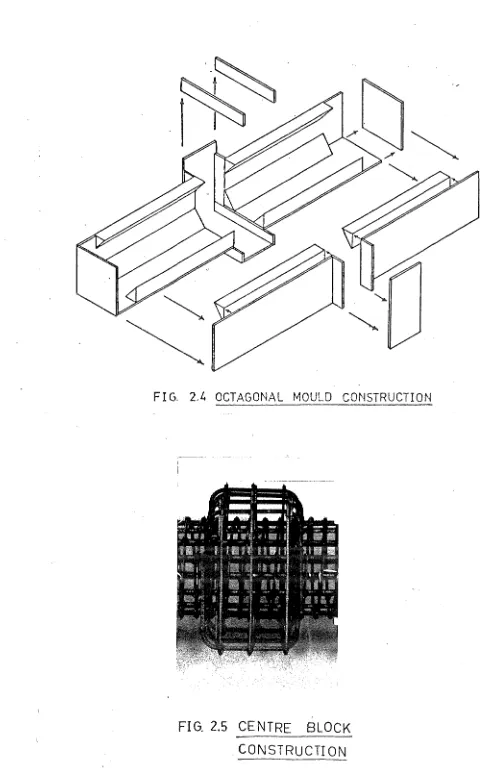
The other hinge region contained just a few gauges to The identification of strain gauges was done
arbitrarily as shown in Fig. 2.8a & b. The strain gauges were numbered from the centre block outwards. No attempt was made to give the check gauges a different labell~ng system because their number was not large enough to confuse the job.
A new method of strain-gauging to monitor longitudinal strains was tried on specimen 4. In this method two pairs of diametrically opposite strain gauges were mounted on a piece of 8 rom bright plain mild steel rod at 20 rom on each side of the centre point (Fig. 2.9al. The rod was 500 rom long, and threaded over a distance of 90 rom at both ends to provide sufficient anchorage in the concrete. The rod was then
<.!)lS
Z
r-~ U
S
~
-1 0
FIG.
2.8
a
~I§
<!
u
o
W
-1 0::
---.
o
FIG.
2.8 b
F 1G. 2·8
0
&
b
IDENTIFICATION OF
STRAIN GAU GE
STRAIN GAUGE
LOCATION
PLASTIC
TUBING
105
~
145
----.j
~
r
soo
lL
,,,
300.
~I
..
125
STEEL ROD
[image:34.608.34.574.68.804.2]the dial gauge rods on either face in the direction of loading. {See Fig. 2.9cl.
The process of applying the electric resistance strain gauges was as follows.
{il The gauge locations were lightly filed, then smoothed -with emery paper and cleaned thoroughly with Methyl Ethyl Ketone (MEK1.
(ii) The 5 rom Kyowa KFC-S-Cl-ll electric resistance strain gauge was glued using a cyano acrylate strain gauge cement, CC-1SA, with the aid of cellotape and light finger pressure.
(iii) The self-adhesive Showa SFG-ST terminal strips were then stuck to the gauge sites.
(iv) The wires, in a protective vinyl tube were soldered on to the terminal.
(v) Several layers of Shinkoh SN/4 water-proofing were applied. They were applied successively one after each previous layer had dried up.
(vi) Finally, a strip of vinyl mastic was placed over the gauge to provide mechanical resistance.
Fig. 2.6a illustrates the finished appearance of some strain gauges.
As mentioned in Sec. 2.2.2, the strain gauging on stirrups was carried out before fabrication so as to avoid difficulty and awkwardness in mounting such strain gauges as B and E (Fig. 2.8b).
The gauge factor for the strain gauge used was 2.1.
2.3.2 Dial Gauges for Measuring Curvature and Longitudinal strains The method of mounting the dial gauge frames on the two different sections was identical to that used in the two previo~s projects
respectively. However, in the case of octagonal section, polystyrene pieces were used instead of soft plastic tubing to ensure ingependent movement of rod outside concrete cover (Fig. 2.6a). Care was taken to ensure that this movement would not be jammed when concrete spalled off during the test.
same for Specimen 1 with the one furthest away from the centre block missing, Fig. 2.l0a.
The four dial gauges nearest to the centre block (100 mm away) were 0.01 - 20 mm Mitutoyo gauges and the rest were 0.001 - 0.5" Mercer gauges.
2.3.3 Dial Gauges for Measuring Horizontal Displacement
24
Some modifications to the previous method of horizontal displacement measurements were made. only two gauges were used instead of four.
Replacing the two end dial gauges, two steel brackets were erected and fixed rigidly to the end blocks. A length of rectangular hollow section was then spanned across these two brackets. I t was bolted to the top bracket and was allowed to travel vertically between two smooth rollers at the bottom bracket, Fig. 2.l0b. This steel member was considered to be stiff enough to give accurate deflection measurements and not so heavy as to cause additional loading to the specimens. The two 0.01 - 50 mm Mitutoyo gauges were then mounted at the top and bottom edges of the centre block. (Fig. 2.l0a).
2.3.4 Linear Potentiometer for Measuring Horizontal Displacement During the testing of the first specimen, i t was found that the two dial gauges for measuring horizontal displacement had to be re-set for ductility factor greater than two. I t was troublesome and time
consuming to re-set the dial gauges, particularly at higher ductilities, so a further modification was made for this displacement measurement. The two dial gauges were replaced by two 30LP200 Sakae linear
potentio-meters having a total range of travel of 200 rom (i.e. 100 mm in each direction) and sensitivity 0.04 mm. The dial gauge stand was stiffened with the addition of three bracing members as shown in Fig. 2.l0b.
+
12
11
10
g
8
7
....,.6
5
4
3
2
1
+
FIG. 2.10 a
---,:--
f--
f-- '
f--
t----.: f-
,-'-200
200
100
100
100
100
---.:
-
r-
f-
i-100
100
100
100
200
i-200
DIAL GAUGE POSITION
FIG. 2.10 b
[image:38.605.76.558.33.832.2]CHAPTER THREE
TESTING PROCEDURE
3.1 LOADING FRAME
In view of the difficulty and awkwardness in erecting the existing test frame used for Potangaroa's and Gill's tests, and the cost and time required to extend i t to fit the new test specimens, i t was suggested that a new frame be built. In order to have an efficient way of applying the dynamic lateral loads, the frame was designed to have two incline~ "arms" with the hydraulic jack along the line of angle bisection, Fig. 3.1. The two "arms" were made from 410 UB54 with plates welded at their ends. (For details see Fig. 3.2 a & b) . Together with the jack, the two "arms"
were connected with a 75 rom steel pin. At both ends of the specimen, a 26
50 rom steel pin passed through the arms and a steel circular hollow section cast at that end. By pinning the jack at both ends in such an arrangement, there was no danger of bending moment being applied to the specimen by the jack or vice versa. Unlike the previous arrangement, this set-up resulted in less wear and tear at the pins and required little effort in the
erection process.
From the consideration of the force diagram Fig .. 3.lb, i t was evident that the loading pattern would introduce an additional axial component to the specimen. Hence, applied axial load was continuously adjusted during lateral loading to compensate for this effect and maintain the required axial load level.
At the ends a semi-circular steel cylindrical roller was welded to a steel plate which in turn was secured in position between two angle sections welded to the end plate. The matching scalloped plates were
bolted to the Dartec loading platform. The roller and the scalloped plate at the ends acted as the axial loading points as well as allowing for the necessary end rotation.
The simulated lateral seismic load was applied through a 500 kN capacity MTS hydraulic jack which was connected to the loading plates via a 38 rom pin. The loading plates were held against the centre block by means of four 25 rom diameter high strength rods threaded through the plastic tubings cast in the concrete and bolted at both ends. The loading frame and the MTS jack were assembled as one unit with minor adjustment of jack level through the slotted hole connection in the two angle sections which kept the jack in position. The load cell was calibrated using an Avery
\
o
w
u ::>
o
z
- '
«
~
FI G.
3.1 b FORCE DIAGRAM
40mm ~
840
20 mm £ ---\: ....
50 mm STEEL PIN----t->~
,900
FIG.
3.1
a
LOADING
FRAME
o 0
o LJ1
co 01
--\--ft--'---'- t
4-HS BOLTS
E E a
\
OJZ ~-<
tt
q
a
Ln
I'
OOZ '/ -2: a::«
n:: W 0.. 0.. :J ~GJ
hLli
~r-.~
~
~
"""
I
I~
L/
1\
~ --3 Ln. W :J a ~ -3 !1-.-
a a ~ ag
I-ra
a -~1 , .
-o V'l N
CT
a a a M t-o S' ~r -2: n::
«
n:: Ws:
0 -'0 .
-0 M M -~ Ln CO :J a ~ ~I,
I~
W L«
0:: LL (9 Z I-to
«
o
-1 LLo
U) -1 1-1«
I-Wo
CI NM
OOZ
~
SI
E E
28
~~ --~
aa 0 S'
--.
P
a6-~.=--~
Ln a Ln N
M N
FI G.
3.2 b
+
+
NOT E: DESIGN TO FULL CAPA-CITY OF THE JACK (500 KN)
3.2 SPECIMEN INSTALLATION
Since the new loading frame occupied only one side of the test machine time was saved because there was no need to dismantle the frame to make way for the specimen during installation.
The column specimen was first aligned with the test machine and placed over a pair of trolleys. The column was then manually pulled
towards the machine along a steel plate path used to protect the laboratory floor. Once the top end of the column was under the machine, two 3-tonne chain-block hooks permanently fixed to the cross head of the machine were attached to the lifting brackets near the top end of the specimen. The column was then winched and rotated into its vertical position with the bottom end riding in freely on its trolley. The bottom pair of rollers and scalloped plate was then fixed while the specimen was suspended by the chain-blocks. The top pair were fixed before the specimen was pulled into position. The plates were then adjusted and plastered. A small axial load was used to hold the machine while the loading frame-hydraulic
jack unit was lifted and pinned to the specimen. When the process of installation was completed the chain-blocks were left suspending the frame and holding the specimen but they were slackened during testing.
3.3 TESTING PROPER
Just prior to commencement of testing, compression tests were carried out on the concrete cylinders to determine the as-tested concrete strength. Using the available data on material properties and reinforcing details the axial load was then adjusted to give the required level as governed by Cl. 6.4.4 of Second Draft of DZ 3101. As i t was mentioned in Sec. 3.1, this axial load level was maintained by adjusting the applied axial load before every lateral load increment. However, this adjustment was not
possible in the case of dynamic loading during the final part of the testing procedure. This discrepancy was taken into account in later analysis.
The lateral load was applied by a 500 kN capacity double acting MTS hydraulic jack operated by a servo-hydraulic closed-loop control system. Loading was under displacement control, with load being monitored by a straingauged load-cell between the jack and test specimen. Maximum velocity of ram operation was controlled by the size of the pumping unit
[20 US gal/min] to 64 rom/so
30
the predicted yield load was used to establish the first yield displace-ment, t::,
y (For detailed computation refer to Chapter 4). Subsequently,
two complete cycles to displacement ductility factors of two, four and six were carried out in turn. For ductility factor of eight, three complete cycles were carried out to check on any obvious strength and stiffness degradation, Fig. 3.3. This was followed up by dynamic loading to at least ten cycles of loading at the same ductility factor. The dynamic load was applied sinusoidally with a frequency of 0.13 Hz and the hysteresis loops of lateral load vs deflection were obtained on the HP X-Y plotter.
During each cycle of static loading, the initial part was
controlled by load increments to some load level close to the theoretical ultimate load (neglecting the P-t::, effects) and then by displacement increments to the pre-determined value of ductility factor. Only the two horizontal displacement transducers were read at every increment. The complete set of readings (including strain gauge readings) was taken at each increment during the initial cycle and only at every new load level during subsequent cycles.
At the peak of each load cycle, both negative and positive peak values, all the cracks were marked and photographed.
During the later stage of laboratory testing, the dynamic cycles were filmed using a movie camera. This ensured a permanent record of the dynamic testing.
}J
8
6
it
2
.75
~~~~~--~~--r-~--+-~--+-~~~~r-~--L--L--L-~~
OF CfCLES
-4 -6
-8
FI
G. 3.3
LOADI N G
V
FIG. 3.40 GENERAL VIEW OF TEST SET-UP
[image:44.595.48.563.26.807.2]32
CHAPTER FOUR
RESULTS AND OBSERVATIONS
4.1 SUMMARY OF MATERIAL PROPERTIES AND TEST UNIT DETAILS
Figs. 4.1a -d show the stress-strain curves for the reinforcing steel used. The average of three tests for every bar size was taken as representative. All the steel specimens tested showed a significantly higher yield strength than the specified values. The high strength steel showed a shorter yield plateau but considerably more stress increase during strain hardening than the mild steel. In the case of specimens of spiral steel which had been straightened after forming, since they had been yielded twice, the tensile tests did not give a definite yield point or yield plateau. Hence the test results from
initially straight pieces were used for the calculations. Unfortunately, the complete stress-strain curve to failure was not obtained and
consequently steel stresses for strains higher than 0.05 have to be estimated.
The test unit details are summarised in Table 4.1. For all units, the concrete strength was lower than the specified ft of 30 MFa. As
·c
discussed in Section 2.l.1(a) , the actual axial load levls provided in the tests were to be adjusted to give an exact concordance with the
DZ 3101 transverse steel requirements using the actual material properties. This was carried out in the first test and there was a considerable
change in the axial load applied (from 0.12 flA to 0.2 flA ). Hence i t
c g c g
was decided to maintain the original design axial load obtained for specified strength and to tolerate the difference between required and provided transverse steel content. For example, in Unit 2, design axial load P = 0.53 flA
e c g
Therefore, P
e 0.53 x 30 x 132.775 kN 2111 kN
Actual fl at time of testing unit
c
P
e
£fA
= c g2111
0.56 28.5 x 132.775
28.5 MFa
and when substituted into Equation (2), i t gave a required spiral steel content of 0.01466 which was 96% of the p
=
0.01527 actually provided.UNIT
1 2 3
4
-~-~~-Note
Concrete Axial P Longitudinal
Strength Load e Reinforcement Transverse Reinfo~cement
f'A
fl P c g
Yield diameter spacing volumetric yield
c e
P
t
Strength d sh ratio,
P
strength, fyh(MFa) (kN) f s s
Y
% (MPa) (rom) (mrn) (%) (MFa)
26.0 680 0.20 0.0243 308 6 40 0.00756 308
28.5 2111 0.56 0.0243 308 10 55 0.01527 280
23.6 1435 0.38 0.0151 427 12 100 0.02832 320
25.0 840 0.21 0.0151 427 10 90 0.02218 280
, .. - _ ...
-p required by Second Draft of DZ 3101 for Units 1 and 2 are 0.00760 and 0.01466, respectively s
and for units 3 and 4 are 0.01918 and 0.01823, respectively.
w
[image:46.848.45.799.86.573.2]o
0....L
If) If) W CC r-IJl
500
400
200
I''''''''
I~
4
Ey
~I
1 1.5 E
0.01
0.02
[ H D 16
I
y'r
ELD STRENGTH::;
427 MPa
UTS::;670
MPq
Ey==0.002
Esh
=
0.010
I
D
16
1YIELD STRENGTH == 308
MPa
0.03
UTS ==
465 MPa
Ey
=
0.0016
Esh== 0.0200
OD5
STRAIN
~
0
0.... ">
...
-U)
I..J)
w
cr:
f
-I.f)
\~
10.4
£1
.\
•
200
YIELD STRENGTH :::
320 M Po
UTS :::
434 MPa
£y
:::
0.0014
£sh:::
0.0160
o ·
0.01
OD2
OD3
0.04
0:05
~
FIG.
4.1 b STRESS- STRAIN CURVE FOR
R12
STEEL
STRAI N
W
0
Cl.
2
U1
(J)
W
cr:
I -U)
400
200
STRAIGHTENED
FROM SPIRALS
\
YIELD STRENGTH:= 280 MPa
UTS
=
408 MPa
Ey
=
0.0014
Esh= 0.0160
o
I0.01
0.02
0.03
0.04
0.05
FIG.
4.1c STRESS- STRAIN CURVE FOR
R10 STEEL
STRAIN
w
[image:49.845.39.842.79.539.2]400
0
0...
2:
til If) W
er::
I
-If)
200
6.1 Ey
YI ELD STRENGTH
=
308
M Po
U T S
=
41 9
MPo
Ey
=
0.0014
Esh=
0.0100
STRAI GHTENED FROM SPIRALS
o
I I , S I I )w0.01
0.02
0.03
0.04
ST
0.05
FIG.4.1d
STRESS-STRAIN' CURVE FOR
R6
STEEL
RAIN
W
However, in the case of the square sections, due to the incorrect values of f' being used in calculating
P
,
the a,ctualP
If'A valuesc e e c g
were significantly lm-rer" than they should have neen for exact concordance with the DZ 3101 transverse steel requirements. For ex~ple, in unit 3
Actual
p
e f'A
c g
0.38
and when substituted into Eq. (lOL i t gave a required transverse steel content of 0.01918 which was 68% of the Ps 0.02832 actually provided.
Similarly, in unit 4,
Actual
p
e f'A
c g
0.21
and when substituted into Eq. (10) i t gave a required transverse steel content of 0.01823 which was 82% of the P
=
0.02218 actually provided.s
4.2 RESULTS AND OBSERVATIONS
The following sections deal with the results and observations of individual test unit Included in each section are the following aspects:
(a) the general description of the behaviour of the piers during testing,
(b) the derivation of yield displacement and yield curvature, (c) lateral load-lateral displacement relationship, including dynamic test results,
Cd) curvature profiles as well as curvature ductility factor, (e) transverse steel strains, i.e. both confining and shear induced strains,
(f) maximum concrete compressive strains, (g) equivalent plastic hinge lengths, and
Ch) idealized stress-strain curve for the confined concrete core. For the convenience of comparison and discussion, a summary of these results is presented in Chapter 5l and to differentiate from the W
values for individual hinge, the overall values were taken as ~o
4.2.1 Specimen One
(a) General description