An improved upper limit on the direct 3α decay of the
Hoyle state
BISHOP, Jack, SMITH, Robin <http://orcid.org/0000-0002-9671-8599>,
KOKALOVA, Tzany, WHELDON, Carl, CURTIS, Neil, FREER, Martin and
PARKER, David
Available from Sheffield Hallam University Research Archive (SHURA) at:
http://shura.shu.ac.uk/23391/
This document is the author deposited version. You are advised to consult the
publisher's version if you wish to cite from it.
Published version
BISHOP, Jack, SMITH, Robin, KOKALOVA, Tzany, WHELDON, Carl, CURTIS, Neil,
FREER, Martin and PARKER, David (2018). An improved upper limit on the direct 3α
decay of the Hoyle state. In: 6th International Conference on Production, Energy and
Reliability 2018: World Engineering Science & Technology Congress (ESTCON). AIP
Conference Proceedings, 2038 . AIP Publishing, 020035.
Copyright and re-use policy
See
http://shura.shu.ac.uk/information.html
AIP Conference Proceedings 2038, 020035 (2018); https://doi.org/10.1063/1.5078854 2038, 020035 © 2018 Author(s).
An improved upper limit on the direct 3
α
decay of the Hoyle state
Cite as: AIP Conference Proceedings 2038, 020035 (2018); https://doi.org/10.1063/1.5078854
Published Online: 13 November 2018
Jack Bishop, Robin Smith, Tzany Kokalova, Carl Wheldon, Neil Curtis, Martin Freer, and David Parker
ARTICLES YOU MAY BE INTERESTED IN
A method to determine γ branching ratios using charged particle detectors for states in 18O
AIP Conference Proceedings 2038, 020037 (2018); https://doi.org/10.1063/1.5078856
Recent theoretical advances and open problems in nuclear cluster physics
AIP Conference Proceedings 2038, 020002 (2018); https://doi.org/10.1063/1.5078821
An overview of recent experimental results in nuclear cluster physics
An improved upper limit on the direct 3
α
decay
of the Hoyle state
Jack Bishop
1,a), Robin Smith
1,b), Tzany Kokalova
1, Carl Wheldon
1, Neil Curtis
1,
Martin Freer
1and David Parker
11University of Birmingham, Edgbaston, Birmingham, United Kingdom B15 2TT a)Corresponding author: [email protected]
Abstract.The structure of the Hoyle state, a near-threshold 0+state of extreme astrophysical significance in12C has long been
investigated. An experiment was performed to measure the branching ratio for the decay of this state directly into 3α-particles. Such a branching ratio is expected to be a good observable for whether the resonance can be described as a dilute gas ofα -particles known as anα-condensate. This experiment gave the best upper limits to date for this direct decay via the improvement of the traditionally used DDΦmodel to isotropic decay to the available phase space. The new DDP2model includes three-body
penetrabilities and gives a limit of<0.026% (95% C.L.), a factor of 5 improvement over the previous experimentally obtained limit.
IMPORTANCE OF CLUSTERING
[image:3.612.185.430.509.647.2]The area of clustering presents a great probe of the nuclear force. An understanding of the nuances of the nuclear force beyond the mean-field approximation can be extracted by studying the structure of light-nuclei. The dominant driver of clustering in the light nuclear region is the inert sub-unit of theα-particle. The residual interaction between this tightly-bound boson and the core of a light system is weak, therefore, around theα-decay threshold, this cluster structure is expected to manifest itself, an idea represented by the well-known Ikeda diagram (FIGURE 1). As well as those nuclei where clustering occurs around theα-decay threshold, there is also the possibility for clustering where the entire nucleus dissociates into a system ofα-particles, known as an N-αstate. The consequences of such structures have huge astrophysical importance in nucleosynthesis.
FIGURE 1.Ikeda-diagram showing the expected energies at which different forms of clustering are expected to occur in light-nuclei. Adapted from [1].
Proceedings of the 4th International Workshop on “State of the Art in Nuclear Cluster Physics” (SOTANCP4)
AIP Conf. Proc. 2038, 020035-1–020035-8; https://doi.org/10.1063/1.5078854 Published by AIP Publishing. 978-0-7354-1764-9/$30.00
Nucleosynthesis and clustering
Following the primordial nucleosynthesis of the Big Bang, stars accrete matter and their temperatures rise to a suffi -cient temperature to fuse hydrogen to form helium. As this source of energy becomes exhausted, the star can now fuse helium to form heavier elements. Two4He nuclei can therefore fuse together with a sufficiently small rate as limited both by quantum tunneling through the Coulomb barrier and by their distribution of energies. The compound nucleus formed is8Be. Like all other mass 8 (and 5) nuclei,8Be is unstable and in this case decays back to two4He nuclei in
∼10−16s. The synthesis of heavier elements has therefore reached a bottleneck through which there is no apparent
path. An early understanding of this problem was achieved by modeling the probability of an interaction of a third4He
nucleus with the unstable8Be in what is known as the “triple-alpha process” [2]. Such a reaction, however, is severely impeded both by the requirement for a third4He interaction to occur within∼10−16s as well as the larger Coulomb barrier between the8Be and4He. A calculation of the expected reaction rate in stars, and therefore the amount of12C
and heavier elements which will be created following this bottleneck however underestimated the abundance of12C
and heavier elements by roughly seven orders of magnitude [3]. Fred Hoyle provided the insight into the rectifica-tion of this discrepancy by postulating the existence of a near-threshold state in12C which provided a resonance that could enhance the reaction rate for the triple-alpha process [4]. Furthermore, this state would most likely have a 0+ spin-parity. While such a state at∼7.6 MeV had been measured previously (and subsequently not-detected in later experiments) [5], this renewed insight into the triple-alpha process allowed for measurement of a state at 7.65 MeV, only 30 keV from where Fred Hoyle had predicted it to exist [6]. It is for this reason that this 0+2 state in12C carries
his name.
Structure and importance of the Hoyle state
In order to sufficiently enhance the triple-alpha reaction rate, the Hoyle state must have a large width to the8Be+ α channel. By virtue of8Be being unbound (and subsequent work demonstrating 8Be has a dumbbell α-particle
structure [7]) the Hoyle state can be thought of as a 3αcluster structure. While the dominant contribution to the triple-alpha reaction rate is related to the8Be+αwidth, the other decay channels also have a large contribution to
the nucleosynthesis rate. The first of these is the radiative width. Following the population of the Hoyle state via the mutual coalescing of 3α-particles, to produce12C, the state must radiatively decay. This can be achieved either through sequential gamma-decay through the 2+1 or through internal pair conversion directly to the 0+1(g.s). Finally, the Hoyle state can also decay directly into 3α-particles in a three-body decay. While this decay mode is largely suppressed relative to the sequential decay through the8Be(g.s), the decay width becomes important at higher temperatures [8].
[image:4.612.148.467.457.630.2]This whole process is portrayed inFIGURE 2.
FIGURE 2. Schematic of the stages of the triple-alpha process. A two-step process of the formation of8Be followed by the
formation of12C?then requires de-excitation to the ground-state for the synthesis of12C(g.s).
and with such a large moment of inertia, rotational excitations of the Hoyle state have not been found where such a structure would require them [9]. Later models following a geometrical basis suggested a “bent-arm configuration” where the8Be stays more tightly bound within the nucleus [10]. The Algebraic Cluster Model (ACM) was used to
predict the vibration-rotation spectrum of an equilateral triangle configuration of 3α-particles which has remarkable success in ascribing different excitation modes to different rotational bands within12C [11]. A particularly captivating model takes the role of theα-particles in the system further by treating the nucleus as a dilute gas ofα-particles which have condensed into the (0s)4 lowest energy level as allowed by their bosonic nature [12]. This transition from a
fermionic liquid to a bosonic gas is known asα-condensation and has been predicted to occur in light nuclei up until around40Ca [13]. This represents a new state of matter inside the nucleus where the density has dropped fromρ0to
∼ρ03 → ρ05 allowing for a unique investigation into the nuclear equation of state [14, 15, 16, 17].
To understand the underlying structure of the Hoyle state, one can rely on a precise measurement of the direct 3α decay branching ratio observable. If the Hoyle state is indeed a dilute gas ofα-particles, the expected direct 3αdecay branching ratio will be larger than a “bent-arm” or equilateral triangle arrangement [18]. The previously published limit is<0.2% (95% C.L.) [19] however such a value is insufficient to be able to differentiate between the predicted structures. A new experiment was therefore performed which has a higher level of sensitivity to elucidate the degree to which the Hoyle state can be described as anα-condensate [20] [21].
EXPERIMENT
Experimental set-up
The experiment was designed in such a way as to minimize any source of background identified as contributing to the direct 3αbranching ratio. To populate the Hoyle state, the12C(4He,4He)12C?inelastic scattering reaction was used
by virtue of a 40 MeV4He beam provided by the Birmingham MC40 cyclotron incident on a natural carbon target. The scattered beam was identified using a 65-500µm dE-E silicon DSSD telescope. The break-up of the Hoyle state was detected on the opposite side of the beam using a quad array of 500µm DSSDs. This quad array was placed such that population of the Hoyle state placed the scattered beam and the break-upα-particles in kinematic coincidence to maximize the count rate. A thin carbon target (100µg/cm2) was used and placed at 45◦ to the beam direction to
[image:5.612.223.381.436.667.2]minimize the energy loss and energy straggling, another source of background. The experimental set-up is summarized inFIGURE 3. In total, 60 hours of beam-time data were taken with an average beam current of 6 enA.
FIGURE 3.Experimental set-up for the12C(4He,4He)12C?reaction. Figure taken from [21].
Data analysis
To ensure the best resolution and lowest background level, only events with full-kinematics (i.e. detection of all 4 particles) were taken. To ensure these 4 particles arose from the desired12C(4He,4He)12C?reaction, particle identifi-cation was first performed on the scattered beam by placing a cut on the4He locus seen inFIGURE 4from the plot of
energy in the dE and E DSSD. Following this selection, requiring 3 hits in the quad array of DSSDs then left 14% of events showing the relatively large efficiency for detection of 3 particles. Following this restrictions, the data were then separated into two different sets. These two data sets constituted a higher count, higher background and a lower count, lower background set. When multipleα-particles hit a detector, there becomes an ambiguity about the hit positions. The lower background subset of data therefore consists of events where eachα-particle hits a separate detector and no such ambiguity exists. As this requires a more stringent cut on the phase-space of the system, only 21% of events with 3 hits in the quad belong to this data set (type I). The higher background data set therefore correspond to where 2α-particles hit a single detector and the 3rdis measured in a separate detector. This less restrictive subset contributes
[image:6.612.175.443.273.483.2]73% of the events with 3 particles in the quad hence provide better statistics (type II). The remaining 6% of events occur where all particle hit a single detector and provide a situation whereby the ambiguity about hit positions is greatly enhanced and such these data are ignored.
FIGURE 4.2D histogram ofE−dEenergy from the silicon DSSD showing the loci populated by different nuclei (labeled).
To ensure the populated state is that of interest, the excitation energy was obtained using two methods. The first method used the scattered beam to obtain the excitation energy and kinetic energy of the scattered12C?(E
xandEC
respectively) using conservation of energy and momentum from the scattered beamPb0;
~
PC = ~Pbeam−P~b0,
EC = ~
PC. ~PC
2mC
and
Ex = Ebeam−EC−Eb0. (1)
The second method obtained the excitation energy via the break-up of12C?(with energy and momentumE
CandP~C)
into 3α-particles and their corresponding momentaP~α1,P~α2andP~α3.
~
PC = 3
X
i=1 ~
EC = ~
PC. ~PC
2mC
and
Ex = Eα1+Eα2+Eα3−EC. (2)
Gates were placed on both these excitation energies to mutually assure the 7.65 MeV Hoyle state was populated. Additionally, a cut was placed on the total reaction Q-value to further clean the data. Finally, a cut was placed on the total x, y and z momenta which was found to be a parameter that was very sensitive to the inclusion of background events. Given the data were now at a maximally clean level, the break-up mechanisms of the selected events in the two data sets were then analyzed.
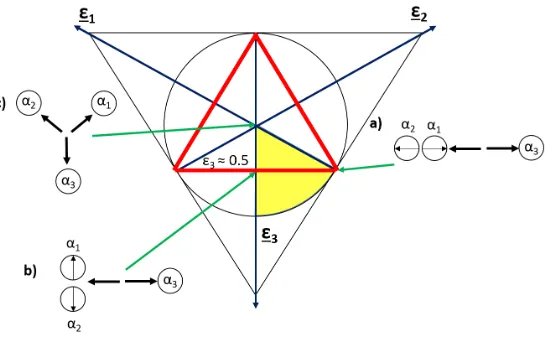
Dalitz plots
To differentiate the sequential decay mechanism from the direct break-up mechanism, the Dalitz technique was used [22]. This relies on plotting the normalized center-of-mass energies of the 3 break-upα-particles in a “tri-dimensional plot” which has been projected into 2D. This is shown inFIGURE 5. The co-ordinates, given byxandy, are obtained from the center-of-mass energiesEicmby:
i = Eicm
P
jEjcm ,
x = √1
3
(2−1) and
y = 1
3(2+1−23). (3)
Sequential decay events via the8Be(g.s) share their energy such that the initial decayα-particle takes around 50%
[image:7.612.175.450.435.606.2]of the total energy with the remainingα-particles sharing the remaining 50%. On the Dalitz plot, this corresponds to populating the red loci inFIGURE 5. In a direct 3α-particle decay, there is no such restriction on the energy sharing and any point within the circle constrained by the triangle can be populated. To understand the distribution of the population from this direct decay, three different decay models were used.
FIGURE 5.Dalitz plot demonstrating the energy sharing in a three-body decay in three scenarios. In a) the Hoyle state is decaying sequentially in a collinear fashion whereα1is left with a very small fraction of the total energy. b) also corresponds to sequential
decay however here the twoα-particles from the second decay stage share the energy equally by decaying orthogonally to the original decay direction. Scenario c) corresponds to a direct decay where theα-particles share their energy equally (DDE). The shaded yellow area corresponds to the sector into which all events can be “folded” using the symmetries afforded by the Dalitz plot by ensuring3> 2> 1.
Decay models
The first decay mechanism models the direct 3α-particle break-up by a constant population across the phase space which has a constant density across the Dalitz plot. This model is denoted by DDΦ. The second model assumes the threeα-particles decay where they have the same energy which is only smeared by the position-momentum uncertainty principle with the size of the Hoyle system. This model is denoted by DDE. The final model models a collinear decay of the 3α-particles. During this decay mode, oneα-particle is left with a small amount of energy with the otherα -particles sharing the remaining energy equally. This model is denoted by DDL. To understand the contribution of each of these three decay modes to the experimental data, a Monte Carlo simulation was performed using theresolution8.1
package which incorporated the aspect of the decay modes as well as detector efficiency effects [23] [24]. For the two different data sets (type I and type II), the efficiency across different parts of the Dalitz plot is different. Therefore, the expected signal is marginally different for the same decay mode between these two data sets.
As discussed elsewhere [25], the DDΦmodel is extremely simplistic. In particular, it excludes all aspects of three-body penetrabilities which one would expect to vary drastically across different regions of the Dalitz plot as the relative energies between the particles can vary by a large amount. To incorporate this effect, an improvement to the model was introduced by including this penetrability effect to produce the DDP2model.
To calculate this three-body penetrability, the system was converted to hyperspherical co-ordinates [26]. In this formulation, the hyper-radiusρincreases linearly in time for all initial condition orientations. The tunneling probabil-ity through a Coulomb barrier for a three-body system can therefore be formulated dependent only on scaling constants
si jwhich describe the relative distance between particlesiand j. Different positions in the Dalitz plot correspond to
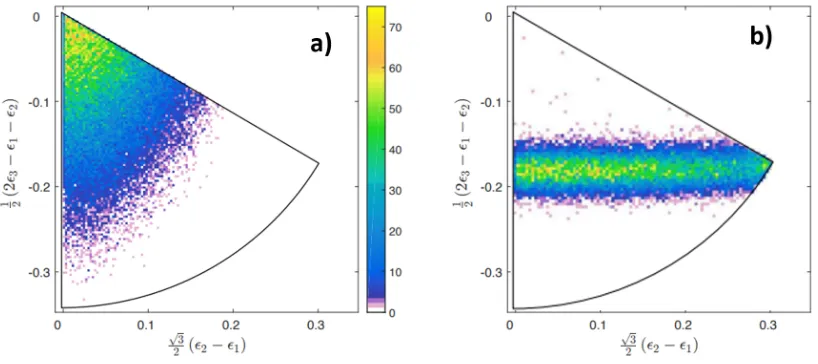
[image:8.612.92.501.354.536.2]different values for these scaling constants and therefore the penetrability can be calculated over the surface of the Dalitz plot. The DDP2is then the product of this penetrability and the DDΦmodel which can be seen inFIGURE 6.
FIGURE 6.a) Dalitz plot demonstrating the energy sharing in a three-body decay in the DDP2model showing the dominance of
the center of the Dalitz plot corresponding to equal energy sharing. b) Dalitz experimental data for the data of type I showing the sequential nature of the Hoyle decays with a small number of events which do not lie on the sequential loci.
Branching ratios
FIGURE 7.a) Projection of the Dalitz plot onto the y-axis for the subset type I (black points). The requirement for a direct component above that predicted from the Monte Carlo sequential decay with event-mixing (solid blue) can clearly be seen. b) Log-likelihood for different branching ratios for the two direct decays, DDE and DDΦ. The black lines denote the 95% confidence limit.
allow for the differentiation between sequential and direct decays. The projection for the DDE and DDP2 models
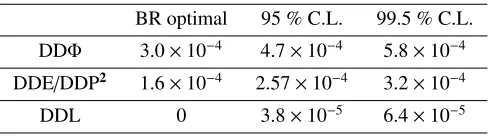
are almost identical and therefore can be treated as having the same behavior. The comparison of this model can be seen (FIGURE 6a) alongside the experimental data (FIGURE 6b) where a very small number of events are seen in excess of those predicted solely by sequential decay. To extract a direct decay branching ratio, the different direct decay mechanisms were included at different branching ratios and the change in the log-likelihood was plotted as a function of this added strength. The result from this is shown inFIGURE 7where the black lines signify the 95% confidence level (C.L.) for the DDE and DDL. This allows for a rejection of a branching ratio higher than 0.026% for the DDE/DDP2and 0.047% for the DDΦmode at the 95% C.L. (summarized inTABLE 1). The previous limit was that given by Itoh of<0.2% [19] for the DDΦmodel which has been improved by a factor of 4 in the current experiment with a record 93,000 Hoyle decay events. Additionally, the work developing the simplicities of this DDΦ model by incorporating three-body penetrabilities to create the DDP2model has demonstrated this direct component
can actually be further improved to be<0.026% constituting a factor of 8 improvement.
TABLE 1.Direct decay results for the different decay mechanisms
BR optimal 95 % C.L. 99.5 % C.L. DDΦ 3.0×10⁻⁴ 4.7×10⁻⁴ 5.8×10⁻⁴ DDE/DDP2 1.6×10⁻⁴ 2.57×10⁻⁴ 3.2×10⁻⁴
DDL 0 3.8×10⁻⁵ 6.4×10⁻⁵
These results can also be compared to those performed at the same time where a DDΦ branching ratio of
< 0.043% (95% C.L.) was achieved using a different population mechanism [27]. These results therefore signify either arriving at the true branching ratio (rather than an upper limit) or more likely reaching the limits afforded by traditional charged particle spectroscopy using silicon detectors. Instead, more sensitive probes may require either greatly enhanced statistics (by virtue of increased solid-angle coverage) or the use of time-projection chambers where the ambiguities of multiple interactions can be removed to a greater degree.
Given the ever decreasing value for the branching ratio of this direct decay component, the interpretation of the Hoyle state as anα-condensate is looking increasingly less likely. Since the original publication of these results however, there has been a renewed level of theoretical input which suggests a condensed Hoyle state will have a direct
[image:9.612.186.430.510.578.2]decay component of∼0.004% (95% C.L.) for DDE [28] [29] requiring a factor of 7 improvement from the current result.
ACKNOWLEDGMENTS
The assistance of the staffduring this experiment at the University of Birmingham MC40 Cyclotron is gratefully acknowledged. This work was funded by the United Kingdom Science and Technology Facilities Council (STFC) under Grant No. ST/L005751/1.
REFERENCES
[1] K. Ikeda, N. Takigawa, and H. Horiuchi,Prog. Theor. Phys. Supp.E68, 464–475 (1968). [2] H. Bondi and E. E. Salpeter,Nature169, 304 EP – (1952).
[3] E. E. Salpeter,Annu. Rev. Nucl. Sci.2, 41–62 (1953). [4] F. Hoyle,Astrophys. J. Suppl. S.1, p. 121 (1954).
[5] H. Kragh, When is a prediction anthropic? Fred Hoyle and the 7.65 MeV carbon resonance, May 2010. [6] D. N. F. Dunbar, R. E. Pixley, W. A. Wenzel, and W. Whaling,Phys. Rev.92, 649–650 (1953).
[7] R. Guardiola, I. Moliner, and M. Nagarajan,Nuclear Physics A679, 393 – 409 (2001). [8] S. Ishikawa,Phys. Rev. C87, p. 055804 (2013).
[9] M. Freer, S. Almaraz-Calderon, A. Aprahamian, N. I. Ashwood, M. Barr, B. Bucher, P. Copp, M. Couder, N. Curtis, X. Fang, F. Jung, S. Lesher, W. Lu, J. D. Malcolm, A. Roberts, W. P. Tan, C. Wheldon, and V. A. Ziman,Phys. Rev. C83, p. 034314 (2011).
[10] E. Epelbaum, H. Krebs, D. Lee, and U.-G. Meißner,Phys. Rev. Lett.106, p. 192501 (2011).
[11] D. J. Mar´ın-L´ambarri, R. Bijker, M. Freer, M. Gai, Tz. Kokalova, D. J. Parker, and C. Wheldon,Phys. Rev. Lett.113, p. 012502 (2014).
[12] A. Tohsaki, H. Horiuchi, P. Schuck, and G. R¨opke,Phys. Rev. Lett.87, p. 192501 (2001). [13] T. Yamada and P. Schuck,Phys. Rev. C69, p. 024309 (2004).
[14] G. R¨opke, A. Schnell, P. Schuck, and P. Nozi`eres,Phys. Rev. Lett.80, 3177–3180Apr (1998). [15] T. Sogo, R. Lazauskas, G. R¨opke, and P. Schuck,Phys. Rev. C79, p. 051301 (2009).
[16] T. Sogo, G. R¨opke, and P. Schuck,Phys. Rev. C82, p. 034322 (2010). [17] P. Schuck,J. Phys. Conf. Ser.436, p. 012065 (2013).
[18] Tz. Kokalova, N. Itagaki, W. von Oertzen, and C. Wheldon,Phys. Rev. Lett.96, p. 192502 (2006).
[19] M. Itoh, S. Ando, T. Aoki, H. Arikawa, S. Ezure, K. Harada, T. Hayamizu, T. Inoue, T. Ishikawa, K. Kato, H. Kawamura, Y. Sakemi, and A. Uchiyama,Phys. Rev. Lett.113, p. 102501 (2014).
[20] R. Smith, Tz. Kokalova, C. Wheldon, J. E. Bishop, M. Freer, N. Curtis, and D. J. Parker,Phys. Rev. Lett. 119, p. 132502 (2017).
[21] R. Smith, “Experimental measurements of break-up reactions to study alpha clustering in carbon-12 and beryllium-9,” December (2017), Birmingham e-thesis repository.
[22] R. H. Dalitz,Phil. Mag. Ser.744, 1068–1080 (1953). [23] N. Curtiset al.,Phys. Rev. C51, 1554–1557 (1995). [24] N. Curtiset al.,Phys. Rev. C53, 1804–1810 (1996).
[25] J. Refsgaard, H. Fynbo, O. Kirsebom, and K. Riisager,Phys. Lett. B779, 414 – 419 (2018). [26] E. Nielsen, D. Fedorov, A. Jensen, and E. Garrido,Phys. Rep.347, 373 – 459 (2001). [27] D. Dell’Aquilaet al.,Phys. Rev. Lett.119, p. 132501 (2017).
[28] S. Ishikawa,Phys. Rev. C90, p. 061604 (2014).


![FIGURE 3. Experimental set-up for the 12C(4He,4 He)12C⋆ reaction. Figure taken from [21].](https://thumb-us.123doks.com/thumbv2/123dok_us/679962.570768/5.612.223.381.436.667/figure-experimental-set-c-he-reaction-figure-taken.webp)