Using business intelligence to predict student behaviour.
WILSON, Richard S.
Available from Sheffield Hallam University Research Archive (SHURA) at:
http://shura.shu.ac.uk/20551/
This document is the author deposited version. You are advised to consult the
publisher's version if you wish to cite from it.
Published version
WILSON, Richard S. (2013). Using business intelligence to predict student
behaviour. Doctoral, Sheffield Hallam University (United Kingdom)..
Copyright and re-use policy
See
http://shura.shu.ac.uk/information.html
Adsetts Centre, City Campus Sheffield S1 1WD
1 0 2 1 0 0 3 3 9 5
Sheffield Hallam University Learning and Information Services
Adsetts Centre, City Campus Sheffield S1 1WD
ProQuest Number: 10701198
All rights reserved
INFORMATION TO ALL USERS
The quality of this reproduction is dependent upon the quality of the copy submitted.
In the unlikely event that the author did not send a com plete manuscript and there are missing pages, these will be noted. Also, if material had to be removed,
a note will indicate the deletion.
uest
ProQuest 10701198
Published by ProQuest LLC(2017). Copyright of the Dissertation is held by the Author.
All rights reserved.
This work is protected against unauthorized copying under Title 17, United States Code Microform Edition © ProQuest LLC.
ProQuest LLC.
789 East Eisenhower Parkway P.O. Box 1346
Using Business Intelligence to
Predict Student Behaviour
Richard Scott Wilson
A thesis submitted in partial fulfilment of the requirements of Sheffield Hallam University
for the degree of Doctor of Philosophy
Ab s tr a c t
In light of reduced Higher Education funding, increased student contributions
and competition between institutions, finding ways to understand student progression and improve the student experience are integral to the student, institution and state (York and Longden 2008).
This research uses Business Intelligence, specifically Data Warehousing and Data Mining, to build models that can be used to predict student behaviour. These models relate to final award classification, progression onto postgraduate studies at Sheffield Hallam University and employment type post undergraduate degree completion. This work builds upon the recommendations of Burley (2007) where the Department of Computing, at Sheffield Hallam University, was used to prove the applicability of such techniques.
It is fair to state that the field of student progression has been well documented over the years. Numerous authors (Tinto 1993, Yorke 1999, McGivney 2003) have all developed strategies and intervention techniques to help aid student progression. The evolving field of Educational Data Mining has focused, in the main, upon student interactions with web-based learning environments (Romero and Ventura 2006). Few studies have tackled the subject of using Business
Intelligence as a method of understanding student progression (Dekker et al
2009, Herzog 2006).
The data was collected from the universities information systems and through the process of Data Warehousing and Data Mining a number of predictive models were constructed. This resulted in the identification of some interesting rules and variables, such as course and ethnicity, which are also fundamental in the more traditional student progression literature, such as Yoke and Longden (2008).
Co n t e n t s
ABSTRACT... I CONTENTS... N PREFACE...V ACKNOWLEDGEMENTS...VI GLOSSARY...VII
1 INTRODUCTION...1
2 RESEARCH AIMS AND OBJECTIVES...3
2.1 Research Question and Aim...3
2.2 Objectivesofthe Re s e a r c h...3
2.3 Research Ra t io n a l e...4
2.3.1 The Importance of the Research...4
2.3.2 Educational Importance...5
2.3.3 Financial Im portance...7
2.3.4 Interested Parties...8
2.3.5 Informing Institutional Policies...8
2.4 Su m m a r y... 9
3 PREVIOUS RESEARCH... 10
3.1 DataMining Techniques in Higher Education Re s e a r c h... 10
3.2 Locatingthe Re s e a r c h...12
3.2.1 Widening Participation...17
3.2.2 Improving Student Progression...19
3.2.3 Stakeholder Influences on Progression...20
3.2.3.1 The Institution Dimension...21
3.2.3.2 The Student Dimension...26
3.2.3.3 The State Dimension...29
3.2.4 Development of M odels...31
3.2.5 Main Influences on Progression...35
3.3 Educational Data Miningand Student Pr o g r essio n... 37
3.3.1 Educational Data Mining...37
3.3.2 Student Progression Focused Educational Data M ining...39
3.3.3 Main Points on EDM and Progression...44
3.4 Su m m a r y...46
4 DATA WAREHOUSING AND DATA MINING... 47
4.1 Backgroundto Business In tellig ence...47
4.2 Data War eh o u sin g... 47
4.2.1 Top-Down Data W arehousing...49
4.2.2 Bottom-Up Data Warehousing...49
4.2.3 Data Warehousing Methodologies...49
4.2.3.1 The NCR Data Warehousing Method...51
4.2.3.2 Business Dimensional Lifecycle Diagram...53
4.2.3.3 SAS Rapid Data Warehousing Methodology...54
4.3 Data Mining... 56
4.3.1 Data Mining Techniques...56
4.3.2 Supervised V’s Unsupervised Learning...57
4.3.2.1 Clustering... 57
4.3.2.2 Rule Induction... 57
4.3.2.3 Decision Tree Analysis...58
4.3.2.4 Neural Network...58
4.3.2.5 Market Basket Analysis...59
4.3.2.6 Genetic Algorithm s...59
4.4 Data Mining Me th o d o lo g ie s...60
4.4.1 SEMMA...60
4.5 Whatis Newinthis Re s e a r c h...62
4.5.1 Building Data Mining Marts...62
4.5.2 Student Profiling...62
4.5.3 Using Quantitative Methods to Predict Student Behaviour...63
4.6 Su m m a r y... 64
5 RESEARCH APPROACH...65
5.1 Research St r a t e g y... 65
5.2 Research Desig n... 70
5.3 Research Me t h o d... 70
5.3.1 Organising the Research...71
5.3.2 Building the Data Mining Marts...72
5.3.3 Undertaking the Data Mining...73
5.4 Research Seq u en c e... 73
5.5 Research Et h ic s... 74
5.6 Su m m a r y...77
6 BUILDING AND UNDERSTANDING THE DATA SET... 78
6.1 Buildingthe Data Mining Ma r t s... 78
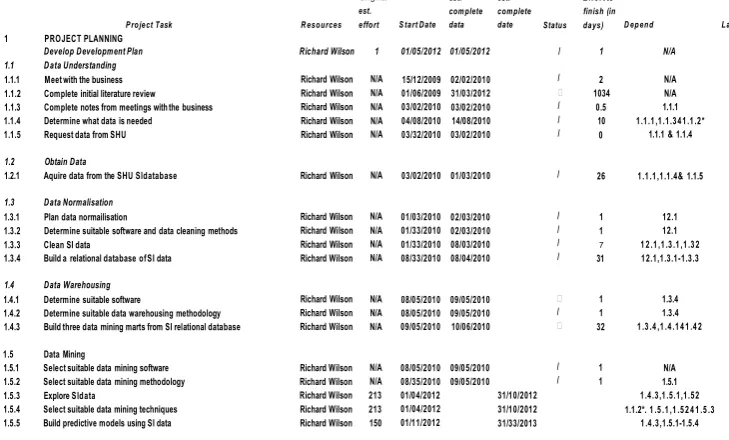
6.1.1 Project Planning and Management...78
6.1.2 Business Requirements Definition...79
6.1.3 Data Modelling...79
6.1.3.1 Background of the Data...80
6.1.3.2 Data Staging and Development...82
6.1.3.2.1 Select and Clean Data...83
6.1.3.2.2 Construct and Integrate Data...91
6.1.3.2.3 Format Data...95
6.1.3.2.4 Understand Data...95
6.1.3.2.5 Number of Observations and Event Rates...142
6.2 Su m m a r y... 143
7 DATA MINING...144
7.1 Miningthe Da t a...144
7.1.1 Building the Award Classification Model (ACM)...144
7.1.1.1 ACM Sample...144
7.1.1.2 ACM Explore...145
7.1.1.3 ACM Modify...145
7.1.1.4 ACM Model...150
7.1.1.5 ACM Assess...150
7.1.1.6 The Final ACM...153
7.1.2 Building the Postgraduate Studies Model (PSM)...160
7.1.2.1 PSM Sample...160
7.1.2.2 PSM Explore...161
7.1.2.3 PSM Modify....161
7.1.2.4 PSM Model...164
7.1.2.5 PSM Assess...165
7.1.2.6 The Final PSM...168
7.1.3 Building the Employment Model (EM)...173
7.1.3.1 EM Sample...173
7.1.3.2 EM Explore...173
7.1.3.3 EM Modify...173
7.1.3.4 EM Model...176
7.1.3.5 EM Assess...177
7.1.3.6 The Final E M...181
7.2 Su m m a r y...187
8 FINDINGS... 188
8.1 Aw ard Cla s s ific a tio n... 188
8.2 Postgraduate St u d ie s...190
8.3 Student Em ployment Ty p e...192
8.4 Su m m a r y...195
9.1 Data Ca p t u r e...196
9.2 Useof Data Min in g... 197
9.3 Required Skills Le v e l...197
9.4 Further Work Involving Data Miningat S H U ... 198
9.4.1 Further Exploration of the Collected D a ta...198
9.4.2 Capturing Additional Data from SFIU...199
9.4.3 Considering Current Changes to the FIE Landscape...199
9.5 Data Miningother Available HE Da t a... 200
9.5.1 Extending the Study to other Post 1992 Universities...200
9.5.2 Extending the Study to Pre 1992 Universities...200
9.5.3 National Student Assessment Data...200
9.5.4 HESA Data...201
9.6 Possible New Studies Involving Data Min in g... 201
9.6.1 Data Mining Further Education D ata...201
9.7 Su m m a r y... 202
10 REFLECTIVE SUMMARY... 204
10.1 F ocus ofthe Re s e a r c h...205
10.2 Previous Rese a r c h... 206
10.3 Uniqueness ofthe Re s e a r c h... 207
10.4 Research Ap p r o a c h...208
10.5 Buildingand Understandingthe Data Se t...209
10.6 Data Min in g... 210
10.7 Fin d in g s... 211
10.8 Su m m a r y...212
11 CONCLUSIONS... 213
11.1 Summary of Student Aw ard Classification Resu lts... 213
11.2 Sum mary of Progressiononto Postgraduate Studiesat SHU Re s u lts...214
11.3 Summary of Student Employment Type Re s u l t s... 215
11.4 Summary of Reco m m e n d a tio n s...216
11.4.1 Data Capture...216
11.4.2 Further Exploration o f the Collected D ata...216
11.4.3 Capturing Additional Data from SFIU...217
11.4.4 Considering Current Changes to the FIE Landscape...217
11.4.5 Extending the Study to other Post 1992 Universities...277
11.4.6 Extending the Study to Pre 1992 Universities...277
11.4.7 Mining Nationwide FIE Data... 277
11.4.8 Possible New Studies Involving Data M ining...218
11.5 Post Sc r ip t... 218
12 REFERENCES... 219
13 BIBLIOGRAPHY... 224
14 APPENDICES...225
APPENDIX I - FACULTY DEPARTMENTS...1
APPENDIX II - JACS GROUPED SUBJECT LIST... 2
Pr efa c e
This thesis is submitted in partial fulfilment of the requirements of Sheffield Hallam University for the degree of Doctor of Philosophy and outlines the process followed and the results obtained from carrying out research into using Business Intelligence to predict student behaviour.
The first three chapters outline the area under investigation and previous research that has been conducted into understanding student progression in Higher Education, from both a traditional and Educational Data Mining perspective. Chapter 4 provides an overview of Business Intelligence, Data Warehousing and Data Mining. The approach that was followed when carrying out the research is discussed in Chapter 5. Chapters 6 and 7 explore the process of understanding and mining the student data. The findings of the research are then presented in Chapter 8 and recommendations for future research are made in Chapter 9. The whole process is then reviewed in the reflective summary in Chapter 10. Finally, Chapter 11 reiterates the main findings and recommendations of the research.
Part of this work has been presented in the following conference paper:
BURLEY, Keith M and WILSON, Richard S (2012), Understanding Student
Progression for Data Mining Analysis, HEIR, Presented at the Fifth Annual Conference of the Higher Education Institutional Research Network for the United Kingdom and Ireland.
Ac k n ow le d g e m e n t s
I would like to dedicate this work to my wife Vanessa Grace Wilson, whose
tireless patience, endurance and encouragement over the last few years has allowed me to continue when at times completion seemed so far away. I would also like to thank my little boy, Reuben John Harry Wilson, who has sat, so patiently, at the bottom of the stairs waiting for his daddy to come and play with him.
A special thank you also needs to be made to my parents, Ronald and Linda Wilson, and my grandparents, Harry and Mable Ingham, for continuing to support me on my journey through Higher Education. Without their constant love, support and encouragement I would not be where I am today.
My supervisors Dr Keith M Burley and Dr Paul Crowther who have been an inspiration to me. Without their encouragement, knowledge and research experience I doubt that I would have completed this work. Additionally, I would also like to thank Dr Teresa Brunsdon for her guidance through the Data Mining phase of this research.
I would also like to acknowledge the staff, at Sheffield Hallam University, who have enriched my understanding of the university and its processes. In particularly, I would like to thank Dr Helen Kay and Caroline Heaton as without their help I would not have been able to obtain the data for this research.
I would also like to thank SAS® for allowing me to use their software and providing financial support to help pay for materials, tuition fees and conferences.
Glo s s a r y
Added Value
Or value-added relates to “Student achievement, which is inextricably
connected to institutional success, must be measured by institutions on a ‘value-added’ basis that takes into account students academic baseline when assessing their results.” (Spellings 2006, p04).
Adults with Higher Education Qualifications by Postcode (QAHE)
Is a measure, on a scale of 1 to 5, which forms part of the HEFCE work into POLAR2. It is used to rate the number of adults, in a region of the United Kingdom, who have obtained Higher Education qualifications (where 1 is low and 5 is high) (HEFCE 2012).
Business
Is concerned with any particular employment or occupation that is engaged in for gain, livelihood or a profession; can also refer to financial dealings such as the buying or selling of an item(s) (Richardson and Richardson 1992).
Business Dimensional Lifecycle Diagram (BDLD)
“A methodology for planning, designing, implementing, and maintaining data warehouses [...].” (Kimball and Ross 2002, p393).
Business Intelligence (Bl)
“A generic term to describe leveraging the organization’s internal and external information assets for making better business decisions.” (Kimball and Ross 2002, p393).
Categorical Variable Consolidation
Using a decision tree to group the levels of a categorical exploratory variable based on its associations with target variable to create a new model input.
(Georges et al. 2010).
Categorical Variables
“A variable whose values are not numerical. Examples include gender (male,
female), paint colour (red, white, blue), (Upton and Cook 2002).
Classification
The process “[...] assigning a newly presented object to one of a set of predefined classes.” (Berry and Linoff 2011, p86).
Continuous Variables
“A variable whose set of possible values is a continuous interval of real
numbers x, such that a < x > b, in which a can be —[infin] and b can be [infin].”
(Upton and Cook 2002).
Cube
“Name for a dimensional structure on a multidimensional or online analytical processing [...] database platform, originally referring to the simple three- dimension case of product, market and time.” (Kimball and Ross 2002, p395).
Data Cleansing
Is the act of detecting and removing/correcting data in a database that is deemed to be dirty (English 1999).
Data Mart
In top-down Data Warehousing:
In bottom-up Data Warehousing:
A Data Mart is “a flexible set of data, ideally based on the most atomic (granular)
data possible to extract from an operational source, and presented in a symmetric (dimensional) model.” In bottom-up Data Warehousing the Data Marts are independent of the Data Warehouse, the Data Marts are consolidated to form the Data Warehouse (Kimball and Ross 2002, p396).
Data Mining (DM)
“[. J]s the automated analysis of large data sets to identify previously unknown patterns or trends of information in the data that may be used to make valid predictions. It uses standard statistical analysis and modelling techniques to discover patterns that typically would go undetected using ordinary statistical
methods”. (Samli etal. 2002, p219)
Data Sparcity
A poorly designed multidimensional database (cube) can have a larger physical size then the information it retains, it is sparse. This results in a cube that is larger than necessary and can lead to problems with usability and performance (Kimball and Ross, 2002).
Data Warehouse
“The conglomeration of an organizations data warehouse staging and presentation areas, where operational data is specifically structured for query and analysis performance and ease-of use.” (Kimball and Ross 2002, p397).
Data Warehousing (DW)
“[...] what you need to do in order to create a data warehouse, and what you do with it. It is the process of creating, populating, and then querying a data warehouse and can involve a number of discrete technologies [...].’’(Reed no date).
Educational Data Mining (EDM)
“Educational Data Mining is an emerging discipline, concerned with developing methods for exploring the unique types of data that come from educational settings, and using these methods to better understand students, and the settings which they learn in.” (Baker and Yacef no date, p02).
Enterprise Data Model
Defines all the data that is common to a business, from a high-level business view to a generic logical data design, including links to the physical data designs of individual applications (Singh 1998).
Enterprise Data Warehouse (EDW)
Is a centralised, normalised and atomic data store that is used to populate a number of dependent Data Marts. An Enterprise Data Warehouse is arranged around the enterprise subject areas found in the enterprise data model (Inmon 2002).
Entity-Relationship (ER) Modelling
“[...l]s a way of graphically representing the logical relationships of entities (or objects) in order to create a database. The ER model was first proposed by Peter Pin-Shan Chen of Massachusetts Institute of Technology (MIT) in the 1970s.” (Rouse 2005).
Epistemology
“[Wlhat is (or should be) regarded as acceptable knowledge in a discipline.” (Bryman 2012, p27)
Estimation
Ethnomethodology
“[l]s a family of related approaches concerned with describing and portraying
how people construct their own definitions of social situations or, more broadly, with the social construction of knowledge.” (Schwandt 1997, p44).
Explanatory Variable(s)
Otherwise known as the predictor variable(s) or independent variable(s) and refers to the inputs or predictors of a model that is used to derive an equation or rules to predict an output variable - target variable (Two Crows no date)
Higher Education Funding Council for England (HEFCE)
“HEFCE distributes public money for higher education to universities and colleges in England, and ensures that this money is used to deliver the greatest benefit to students and the wider public.” (HEFCE 2012a)
Higher Education Statistics Agency (HESA)
“[...l]s the official agency for the collection, analysis and dissemination of quantitative information about higher education.” (HESA no datea)
Higher Education (HE)
“[... Is] a diverse range of courses and qualifications, such as first degrees, higher national diplomas and foundation degrees. Many courses take place in universities, but plenty are also taught at higher education colleges, specialist art institutions and agricultural colleges.” (UCAS no date).
Joint Academic Coding System (JACS)
"[...] is owned and maintained by the Universities and Colleges Admissions Service (UCAS) and the Higher Education Statistics Agency (HESA) and is used for subject coding of provision across higher education in the UK. [...] JACS is currently used to code the subjects of both higher education courses and the individual modules within them across the full range of higher education provision." (HESA no date)
Key Information Set (KIS)
“[...A]re comparable sets of information about full or part time undergraduate courses and are designed to meet the information needs of prospective students.” (HEFCE 2012b).
Layer
“Nodes in a [Neural Network] are usually grouped into layers, with each layer described as input, output or hidden. There are as many input nodes as there are input (independent) variables and as many output nodes as there are output (dependent) variables. Typically, there are one or two hidden layers.” (Two Crows no date).
Lift
“The most common way to compare the performance of classification models is to use a ratio called lift. [...] What lift actually measures is the change in concentration of a particular class when the model is used to select a group from the general population” (Berry and Linoff 2004, p81).
Node
“A decision point in a [... Neural Network] that combines input from other nodes and produces an output through application of an activation function.” (Two Crows no date).
Nominal Variable
A variable that has no numerical values, such as gender or marital status (Hand etal. 2001)
On-Line Analytical Processing (OLAP) System(s)
On-Line Transactional Processing (OLTP) System(s)
Is concerned with loading an organisations day-to-day transactional data into a
relational database, in this sense an On-Line Transactional Processing System(s) can be thought of as a front-end to a relational database (Kimball and Ross 2002).
Ontology
Research ontology is concerned with investigating the nature or essence of social phenomena (Bryman 2012).
Operational Data Store (ODS)
“A physical set of tables sitting between the operational systems and the data warehouse [...]. The main reason for the ODS is to provide immediate reporting of operational results if neither the operational system nor the regular data warehouse can provide satisfactory access. Because an ODS is necessarily an extract of the operational data, it also may play a role of source for the data warehouse” (Kimball and Ross 2002, p408).
Optimisation
“The minimization or maximization of some function, usually subject to restrictions (which are often on the values of the variables over which the optimization takes place).” (Upton and Cook 2002).
Ordinal Variable
A variable that has values that have a natural order, such as months of the year
or education status (Hand et al. 2001).
Organisation
“ [Is a group] of people who co-ordinate their activities in pursuit of a common purpose.” (Richardson and Richardson 1992, p03)
Oversampling
Is the increasing of the classification of a rare event, so that a higher proportion of the rare event exists in the population. (SAS 2013)
Participation of Young People in Higher Education by Postcode (QYPR)
Is a measure, on a scale of 1 to 5, which forms part of the HEFCE work into POLAR2. It is used to look at the number of young people who entered into Higher Education based on where they live in the UK (where 1 is low and 5 is high). (HEFCE 2012)
Phenomenology
“A philosophy that is concerned with the question of how individuals make sense of the world around them and how in particular the philosopher should bracket out preconceptions concerning his or her grasp of that world.” (Bryman 2012, p714).
Participation of Local Areas (POLAR2)
Is a classification of areas in the United Kingdom used to analyse the participation of young people in Higher Education based on where they live. (HEFCE 2012)
Prediction
“[...l]s the same as classification or estimation, except that the records are classified according to some predicted future behaviour or estimated future value.” (Berry and Linoff 2004, p10).
Quality Assurance Agency (QAA)
Regression
Is a data analysis technique that is used to build predictive models. Regression
is used to determine the expected value of the target variable from the actual values of related explanatory variables that tend towards a straight line (Wetherill 1986).
Relational Model
Is a way of storing and processing data in a Data Warehouse, in this model the data is stored in the form of a Relational Database Management system, this model is therefore similar to a transactional system (Schwatz 1996).
Research Territory Map
A high level conceptual map of the area under investigation, which helps to identify links between related topics and provides a way to classify and sort the research material obtained (Dawson 2000).
Sheffield Hallam University (SHU)
Is "[o]ne of the UK's most progressive and innovative universities, Sheffield Hallam is a multicultural institution with a vibrant and diverse student population [...]" (Sheffield Hallam University no date). Located in Sheffield, South Yorkshire, SHU is a former polytechnic that was given university status by the government in 1992 - all of the establishments granted this status are today collectively known as 'post 1992' universities.
Star Schema
“The generic representation of a dimensional model in a relational database in which a fact table with a composite key is joined to a number of dimension tables, each with a single primary key.” (Kimball and Ross 2002, p414).
Structured Query Language (SQL)
"First developed in the early 1970s at IBM by Raymond Boyce and Donald Chamberlin, SQL was commercially released by Relational Software Inc. (now known as Oracle Corporation) in 1979. [... SQL] is a standard computer language for relational database management and data manipulation. SQL is used to query, insert, update and modify data." (Janalta Interactive Inc. 2013).
Symbolic Interactionism
“A theoretical perspective in sociology and social psychology that views social interaction as taking place in terms of the meanings actors attach to action and things.” (Bryman 2012, p716).
Target Variable
Otherwise referred to as the outcome variable, dependent variable or response variable, is determined through the rules or equations of a model from a number of explanatory variable(s) (Two Crows no date).
Topology
1 In t r o d u c t io n
“The importance of student success in higher education is incontestable, whether one’s standpoint is that of a student, a programme team, a department, an institution, or a higher education system” (Yorke and Longden 2008, p04)
This thesis seeks to introduce Business Intelligence (Bl) tools and techniques to the problem of student progression in Higher Education (HE). It will attempt to create a number of intelligent user profiles of Sheffield Hallam University (SHU)
undergraduate students, to answer the following research question: How can
Business Intelligence be used to predict student behaviour as an aid to improving student progression? The research also builds upon the recommendations of Burley (2006). It is perhaps important to state that this research was conducted in the climate of reduced HEFCE (Higher Education Funding Council for England) funding and the consequential increase in student fees. However, it pre-dates the withdrawal of HEFCE funding since the data is taken from 2006.
The word 'student progression' will be used throughout this document to refer to
the maintenance of students on their original course and final completion. The
word progression implies a more optimistic approach to tackling the problem. This is in sharp contrast to the word retention, which has a more managerial feel. Indeed, Yorke and Longden (2004) suggest that retention implies the measurement of efficiency and effectiveness of a system or institution. They go on to suggest that the rationale for retention and completion as an indicator of success is weak. It is perhaps important to define the word progression in the context of this study. Student progression is associated with much more than dealing with the academic issues. Indeed, it is about helping the student to overcome the issues associated with entering HE and dealing with the personal
The student experience is fundamental to improving student progression as it helps the student to overcome the personal issues that they face as part of the HE process. The importance of this is visible, at SHU, in the appointment of an Assistant Dean for Student Experience in the faculty of ACES (Art, Computing, Engineering and Sciences). The quality of the student experience is something that institutions in the UK (United Kingdom) have had a high reputation for delivering. However, a reduction in funding has led to unhappiness in the sector over worries of the decline in the student experience (Yorke and Longden 2008). Therefore, the term student experience will be associated throughout this research with quality and understanding how the institution has managed the expectations of its students.
Yorke and Longden (2008) suggest that student progression needs to be
considered from three perspectives - the state, the institution and the student.
Therefore, where possible this research will consider the interests of these three stakeholders in relation to student progression in HE. Through carrying out a comparative analysis of HE systems (in England, Australia, South Africa and the United States of America), they found that widening participation, increasing access and student funding were common reoccurring themes across all countries. In addition to this, they also found that within each of the countries there were differing rates of student progression and success in different groups and different institutions in HE.
In 2007, the National Audit Office found that 21,504 first year full time degree students, who enrolled in 2004-05, failed to progress into their second year. Whilst this is a slight improvement to 1999-2000, this still represents a significant financial loss to all of the HE stakeholders, introduced above. Indeed, Yorke and Longden (2008) estimate that cost of non-progression is £110 million per annum. All stakeholders have an active part to play in improving student progression and there is an assumption that the student wishes to progress
(Burley 2006). However, Peelo et al. (2002) suggests that failure to progress
2 Re s e a r c h Aim s a n d Ob je c tiv e s
“General aims must then lead to a statement of specific aims, and these should be turned into operationalized aims; that is, a specified set of practical issues or hypotheses to be investigated.”(Oppenheim 1992, p07)
The intention of this chapter is to outline the research question, aim and objectives and provide a rationale as to the importance of the work.
2.1 Res ea r c h Qu e s tio n an d Aim
Burley (2006) carried out research into exploring the issues that affected the progression of computing students at SHU through the use of DM techniques. The main focus of the research was to test the value of DM in understanding student progression. The results of his research highlighted a number of recommendations, one of which was to extend the research to include all faculties at SHU. Therefore, the question that this research intends to answer is:
How can Business Intelligence be used to predict student behaviour as an aid to improving student progression?
With this in mind the aim of the research is to:
Explore, through the application of Bl tools, the issues that affect the progression of all undergraduate students at SHU. It is intended that a number of predictive models will also be constructed to predict student behaviour.
2.2 Ob je c tiv e s o f th e Resea r c h
No. Objective Measure
1.
Review, compare and contrast existing knowledge to develop a theoretical
framework on which to base the rest of the study.
Completed literature review.
2.
Develop knowledge of the relevant SHU information systems and DM software to form an understanding of the underlying data structures and mining software.
Understanding of the student data and SAS® software through speaking to experts.
3.
Explore existing data sets, inductively, to build inferences and determine patterns in the data.
Reduced variables in the data set and the introduction of new variables through the iterative use of DM.
4. Apply suitable DM techniques to build a number of predictive models. assessed.Final models built and
5. Validate the findings of study by comparing the results of the quantitative analysis to the current body of knowledge.
Completed findings.
6. Compile a list of recommendations for the future uses of DM in this area based on the findings of the study.
Completed list of recommendations.
Figure 2.1 - Research Objectives and Measures.
2.3 Res ea r c h Ra tio n a le
There has been increased pressure placed upon institutions to widen participation and increase access to HE (Yorke and Longden 2008). It is perhaps important to point out that this landscape is now changing with the reduced number of university places post 2011. However, the widening participation agenda (defined in section 3.2.1) is pertinent to the time (2006) from which the data used in this research was taken. In the current economic climate the number of university places available, financing and employability are major concerns for the institution, student and government. Arguably, in providing a rationale for the research it is necessary to discuss the importance of the research, who will be interested in the work, how the research will inform institutional policies and the tools used for data collection and analysis.
2.3.1 Th e Im po rtance of the Research
This research is important for a number of reasons, the principle ones being educational and financial. Indeed, Yorke (1999, p01) attests that:
Over the last ten to fifteen years, there have been a number of significant changes in the way that HE has been funded in England. Indeed, the burden of financing education has moved from the local education authorities to the student. Prior to the mid-1990s, HE was funded by local education authorities. However, during the mid-1990s student loans were introduced, which paved the way for the introduction of a student contribution to tuition fees in 1998. A further top-up fee was later introduced in 2006 but this was at the discretion of the individual institution. Today the top-up fee has now become mandatory across HE institutions, which has reduced the dependency on the local authority but increased the burden on the student - the average student debt is expected to rise to over £20,000 (Garner 2008). The student contribution is collected after the student graduates and is earning past a certain threshold. This has provided non-traditional students with access to a university education. However, if the student fails to obtain a graduate salary, through non-progression or poor employment opportunities, then they will find it harder to repay the debt.
2.3.2 Educational Im po rtance
It is well documented that there is a high risk of first year undergraduate students failing to progress, the reasons for this can be grouped into educational and behavioural issues (Yorke 1999).
One of the biggest educational issues is that the student is moving from a relatively protected environment of school or college, where they are encouraged, monitored and guided to complete their work, to the much more relaxed environment of academia (Burley 2006). Furthermore, some students will also be moving away from the protected environment of home to study. However, the number of students moving away to study appears to have decreased in recent years. Indeed, faced with increasing debts, it is believed that more students are electing to attend local universities and stay at home
(Coughlan 2009). Moxley et al. (2001) suggest that the majority of problems
affecting the student are outside the educational process.
However, there are few mechanisms in place for identifying those students who fail to engage with the university. Indeed, such students are rarely detected until several weeks into the first semester, by this time the student has developed certain behavioural issues that are very difficult to change. From an educational perspective it would be beneficial to both the student and the institution if these students could be identified through predictive modelling. This could help the institution to facilitate the student’s progression into academia, through for example offering help in terms of bridging courses, group events and the like. This has the potential to improve both student progression and the student experience.
In 1997 the Labour government committed itself to increasing student participation to 50% by 2010 (Slack and Casey 2002). The number of applicants accepted, through UCAS (Universities and Colleges Admissions Service), in the UK rose from 332,000 in 2002-03 to 346,000 in 2006-07, this shows an increase in accepted places of 4.1%. During this time, there have been changes in the subjects that students have applied to study. Indeed, applications for subjects allied to medicine increased whilst there were large reductions in applications for computer science, mathematics and engineering courses. The government has also incentivised institutions to widen participation. This has resulted in an increase in the proportion of students entering HE from black and minority ethnic groups, disabled students, and students with non-traditional HE backgrounds (National Audit Office 2007).
2.3.3 Financial Im portance
At this stage, it is perhaps prudent to discuss the assertion that, given the level
of student contribution, some may argue that the student is a customer of an institution. However, students are not merely purchasing a degree, they are purchasing access to a product that they have to successfully interface with to achieve their aim - the opportunity to participate. As a result the student will still incur debts from student loans and bank overdrafts, regardless of whether the student progresses to subsequent years of study or completion, which will need to be repaid. Arguably, students attaining a graduate level salary are much more likely to pay off these debts quicker as non-graduate earning potential is significantly lower - on average graduates earn over £100,000 more than non graduates over there lifetime (National Audit Office 2007).
Progression is also important for the institution as they only receive funding from the HEFCE and\or the student for the number of completed years. This has a detrimental effect upon university rankings and the amount of future funding received, as the HEFCE will reduce its funding for the proceeding years. The university budget will also be impacted upon as there is a large effort, in terms of cost, associated with marketing and recruitment of students (Yorke and Longden 2008).
It is perhaps important to clarify that at the time that the data, used in this research, was recorded the institution received around £5,000 per student per year from HEFCE. On top of this the institution also received £3,500 from the student. However if the student failed to progress or failed to engage with the course (fails to submit any work for any module) then the institution was fined the following year (HEFCE 2009). In 2011, the HEFCE withdraw funding for undergraduate courses and most institutions now charge £9,000 per student per annum.
In turn, poor progression rates also reflect badly upon the government as the rates are often published in the media. Yorke (1999, p02) highlights that:
Indeed, Yorke and Longden (2008) estimate that non-completion costs the state around £110 million per annum.
2.3.4 In terested Parties
The management of SHU will be interested in the results of this research. It is also expected that the models developed, as part of this research, will generate interest and debate, from institutions and subject matter experts, regarding the use of modelling to predict student behaviour. Vendors of Bl applications may also be interested in the results of this research, as HE is a relatively untapped market (Luan 2002). The models generated as part of the research could also be of use to university admissions and marketing staff, tutors and student support staff. Indeed, an understanding of student behaviour is fundamental in
helping those who have direct contact with the students (Moxley et al. 2001).
2.3.5 Info rm ing Institutional Policies
Given that the outcomes of this research will help to foster an improved understanding of student opinion and behaviour, admissions and marketing staff, tutors and student support staff may find the results interesting so that selection of students and intervention can be improved. This will also be useful to students as identifying that they may require intervention, may provide them with the skills to complete their degree and earn a graduate salary. Furthermore, every effort will be made to try to attract SHU staff into using the models.
Whilst the models will be built at SHU, it is expected that they could be of use to other post 1992 universities. The research will also add a further dimension to the HE knowledge domain and has the potential to cause a debate as to the future use of modelling of student behaviour.
2.4 Su m m a r y
3 Pr e v io u s Res ea r c h
“Around 28,000 full-time and 87,000 part-time students who started a first-degree course in 2004-05 were no longer in higher education a year later. ” (Parliamentary 2008).
The subject of student progression in HE is a high profile issue, this is reflected by the fact that there has been a significant amount of research carried out within this area (Yorke and Longden 2008). Since 2005, the subject of the application of Bl in HE has grown substantially. Indeed, the growth of interest in the area of Educational Data Mining (EDM) can be seen by the recent creation of the International Conference for EDM and the increased publications of
journals and books in this area (Romero et al. 2011).
This review will initially focus upon the findings of Burley (2007) which will then be expanded to include, in the first instance, research carried out by Yorke
(1999), Moxley et al. (2001), McGivney (2003), and Yorke and Longden (2008).
This will then be extended to include literature from the evolving field of EDM and its application in the problem of student progression.
3.1 Da ta Min in g Te c h n iq u e s in Hig h e r Ed u c a tio n Res ea r c h
In this section the findings of Burley (2007), titled “Data Mining Techniques in
Higher Education Research - The Example of Student Retention”, will be reviewed. The section will provide a brief overview of the study, including any relevant recommendations, and highlight the main strengths and weaknesses of the work.
Burley's research seeks:
“[...] to explore interrelationships between factors that contribute to student attrition and hence establish the demographics of at risk students” (Burley 2007, p01)
his research focuses upon students belonging to the Department of Computing at SHU. Through an extensive review of the literature, Burley identifies three key themes (Casual Problems, Modelling and Intervention). These are drawn
from the work of McGiveny (1996), Yorke (1999) and Moxley et al. (2001).
These are then considered from both the institutional and individual (student) perspective.
DM is then introduced to the problem of student progression, with an extensive discussion around supervised and unsupervised DM techniques. The research takes a mixed methods approach to help understand the issues. Having gained an understanding of the problems, Burley carries out a number of exploratory face-to-face interviews to gain further insights into problems pertinent to SHU computing students. These insights are then used to develop an online questionnaire that is targeted, in the main, at students within the Department of Computing at SHU (15.5% of respondents were from other similar universities).
In his evaluation of the process, Burley notes that there were two problems with the design of his questionnaire. These related to pigeon holing students into predefined age groups and rating responses on a five point likert scale, all of which hindered the analysis process. Burley collects his data over a nine month period, which is then categorised as student demographics and response to attitude issue. Given the period of data collection, it is questionable whether there were enough responses (587) to provide a representative sample of the population as DM is more effective with larger data sets. According to Berry and Linoff (2011, p167)
“Data Mining is most useful when sheer volume of data obscures patterns that might be detectable in smaller databases [...] We generally start with tens of thousands if not millions of pre-classified records so that the model set contains many thousands of records. ”
After preparing the data, the results are then mined using a combination of both unsupervised (Clustering and Rule Association) and supervised (Decision Tree Analysis) DM techniques - see section 4.3. These techniques identify five key problems that effect student progression. These are: Course, Stress, Distraction, Examinations and Leave. All of these problems are related and whilst the findings agree with previous research, the transferability of the results to other departments and universities is questionable. Indeed, McGivney (2003, p102) points out that “[t]he evidence indicates that the reasons for withdrawal vary according to student group, the nature of the institution, the support available and the subject studied.”
Through considering a number of key demographic features, Burley constructs two profiles that can be used to identify vulnerable and less vulnerable groups of students. These findings are then used to inform a focus group meeting, at SHU. From this thirteen recommendations are developed, which take into consideration such things as student service intervention and the quality of teaching received. In his reflective summary, Burley discusses some of the issues associated with his research, such as the sample size of the students interviewed. The research concludes with a number of recommendations for future research. The one that is pertinent to this study is:
The analysis of historical student data to build a DM model that can be used to predict student classifications.
It is this recommendation that the current research seeks to take forward.
3.2 L o catin g th e R esearch
“The field of student progression has been well documented over the years. ”
(Burley 2007, p01).
“[s]ince the beginning of the 1990s, changes in economic patterns have combined with changes in education policy and structure to create a new landscape for adult learners. ” (McGivney 2003, p03)
There have been a number of notable changes that have affected the current situation. These include:
• the introduction of student loans during the 1990s;
• students contributions to tuition fees (in 1998 and in 2006); • attempts to increase and widen HE participation; and
• the recent HE funding reforms and the consequent reduction in student numbers.
Therefore, this review will, in the main, consider research taken from the mid- 1990s onwards. As stated previously, Burley (2006) identifies three texts that are useful in understanding the subject area of student progression. These are:
1. Staying or Leaving the Course by Veronica McGivney (2003);
2. Keeping Students in Higher Education by David Moxley et al. (2001); and
3. Leaving Early by Mantz Yorke (1999).
Since Burley’s research, the following study was also identified:
4. Retention and Student Success in Higher Education by Mantz Yorke and Bernard Longden (2008).
Yorke and Longden (2008) provide some useful background information of four different HE systems - Australia, South Africa, the UK and the United States of America. From here they go on to dissect the HE systems of Australia, South Africa and the UK - all of which prove to be useful in the proceeding sections. They then go on to discuss how best to interpret institutional data in relation to the numerous performance indicators. They introduce some of the key theoretical ideas that have been formed over the years and consider them from three perspectives: psychological, sociological and other. They argue that current theory isn’t extensive enough to understand the problems associated with student progression.
Through looking at the result of two large scale qualitative surveys, conducted into full-time and sandwich students, Yorke and Longden highlight some of the more important reasons behind why students fail to progress. They argue that quantitative results do not go far enough to understanding the problems and that a better understanding is gained through considering quantitative data in conjunction with qualitative results - a mixed methods approach. It identifies four general categories as to how HE stakeholders can aid progression. These are: facilitating the student’s decision-making about courses; improving the student’s experience of the course and institution; helping students to cope with the demands of the course; and understanding that events impact on students’ lives outside the institution. Their research has a large qualitative element that is aimed at students who already withdrew. In their concluding chapter, Yorke and Longden look at ways in which institutions, students and the HE systems can improve student progression.
1995), consultations with institutional representatives, Access Validating Agencies and subject matter experts.
McGivney highlights that before the mid-1990s very little data was collected, regarding student progression and attrition patterns, due to data collection problems and reluctance on the institutions part to do so. She examines non completion rates from an institutional perspective and notes that national figures provide inadequate measures. She highlights that comparisons between institutions are difficult due to differences in how institutions measure progression and collect data. She then goes on to examine the variables that affect completion rates and highlights the issues associated with measuring these. She suggests that results from such studies are only meaningful within the context of each individual institution or subject area. Indeed, McGivney suggests that progression will vary depending upon the institution, student cohort, subject area, type of course and the mode of learning.
According to McGivney, there are six ways in which students can exit from a course, these are:
1. Non-starter;
2. Informal withdrawal;
3. Transfer to other programmes; 4. Academic Failure;
5. Formal withdrawal; and 6. Non continuer.
She goes on to examine some of the more common variations and findings associated with progression. From these she concludes that both the institution and the individual have a responsibility for ensuring student progression. McGivney suggests that institutions can make improvements by improving the information that students receive. The research concludes with a look at the various support mechanisms available to students.
Moxley et al. (2001) adopt a qualitative approach to understanding the problems
associated with student progression. They are strong advocates of the previous national drive to widen participation. Indeed, they attest that:
The authors recognise that there is no individual panacea to improving student progression, as retention methods should be individualised to each institution. They argue that student progression is the responsibility of both the institution and individual and they observe that student progression is about more than achieving academic standards - the student experience.
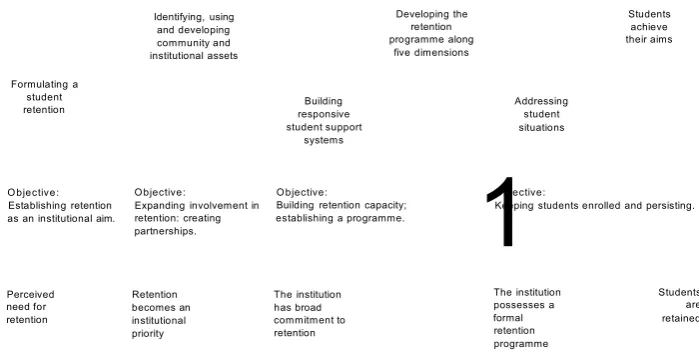
From their findings Moxley et al. (2001) develop a ‘Pathway to Retention Model’,
which provides a number of objectives and supportive practices to help to facilitate student progression within institutions, see below:
Objectives
Objective 1: The institution perceives a need for retention
Objective 2: The institution establishes retention as an institutional aim
The institution expands involvement in retention and creates
Objective 3: partnerships that support and contribute to the success of
students
Objective 4: The institution builds a retention capacity and establishes a
formal programme for keeping students in higher education
Objective 5: The institution keeps students enrolled and persisting towards
the fulfilment of their educational aspirations and aims
Support Practices
Support Practice 1: Emotional support and sustenance Support Practice 2: Informational Support
Support Practice 3: Instrumental Support Support Practice 4: Material Support Support Practice 5: Identity Support
These will be discussed in further detail in section 3.2.4. According to Moxley et
al. (2001) student progression can be improved through what they call proactive
retention. This is the art of informing and teaching students how to become students. They suggest that institutions can facilitate this through providing relevant student support systems and they highlight that academics and student support services are vital to achieving this.
courses in 1994-95, at six institutions situated in the North West of England. Yorke identifies some potential areas of where bias could be introduced to his research and he attempts to reduce this through a telephone survey. Yorke suggests this type of research is important for political reasons, as governments are holding HE institutions to account for their expenditure. From his research Yorke (1999, p39) identifies six factors as to why students fail to progress, these are:
Six Factor Solution
Factor 1: Poor quality of the student experience
Factor 2: Inability to cope with the demands of the programme
Factor 3: Unhappiness with the social environment
Factor 4: Wrong choice of programme
Factor 5: Matters related to financial need
Factor 6: Dissatisfaction with aspects of institutional provision
Yorke also reviews a number of models that have been developed to help facilitate an understanding of the student progression problem - see section 3.2.4. Arguably, the most famous of which is Tintos (1993) model of departure. Yorke appears to be critical of this model citing that it is too general in its approach and that the HE in the UK is funded differently. Overall, Yorke appears to advocate the widening of participation but attests that this cannot be achieved without a risk to student progression.
3.2.1 Widening Partic ipatio n
“[...] participation in higher education had widened considerably over the preceding two decades, but there was still under-representation of young people from poor backgrounds and from some specific ethnic minority groups. ” (Yorke and Longden 2008, p50).
Widening participation is about much more than increasing the numbers of students entering HE (Kennedy 1997). Indeed, widening participation is ultimately concerned with allowing non-traditional students access to a HE qualification, particularly those from poorer backgrounds and ethnic minorities (Yorke and Longden 2008). Archer (2002) notes that these types of non- traditional students are being catered for by the post 1992 universities. SHU is one of the post 1992 universities, which has managed to increase participation whilst also improving student progression from 91.2% in 2001-02 to 92.3% in 2004-05 (National Audit Office 2007). However, numerous studies warn that increasing access to HE cannot be achieved without the risk of non-completion (Yorke 1999, Peelo and Wareham 2002).
Indeed, numerous other studies have noted that the opening up of HE in this way, to non-traditional students, has the potential to increase inequalities as opposed to tackling them (Yorke 1999, Peelo and Wareham 2002). Archer (2002) points out for example that students from poor backgrounds are likely to take on increased work, during term time, to reduce the financial burden. These students are also more than likely to graduate from university with larger debts due to a lack financial support from parents (Callender 2001).
In addition to the financial considerations, the drive to widen participation has also resulted in an increase in the number of local students (Archer 2002). In 2006-07 around 20% of students were local to the institution, this is an increase of around 12% since 1984 (Coughlan 2009). Slack and Casey (2002) warn that home students (who traditionally are catered for by the post 1992 universities) are likely to develop different relationships, to that of non-local students, with the institution and their colleagues. They go on to state that local students may have other pressures and commitments outside of university that inhibits them from taking part in the extra-curricular activities of a conventional student. This suggests that the potential lack of local student integration into the institutional society could increase the risks of non-student progression.
called the ‘widening participation element’ (National Audit Office 2007). In 2003- 04 the Funding Council added a retention element to this, the reasons for this were “[...] to remove a disincentive to recruit students who may be more likely to leave early.” (National Audit Office 2007, p30). In 2006-07, the total expenditure allocated through this funding stream was £345 million. However, due to recent changes in the funding of HE, the widening participation programme has been discontinued and student bursaries are the responsibility of the institution (Crown 2011).
3.2.2 Im proving Stud ent Pr ogression
“In 2000 the UK government indicated that its commitment to expanding and widening participation in higher education should not be accompanied by lower levels of programme completion.” (Yorke and Longden 2008, p50)
It would be fair to say that the problem of student progression came to light during the mid-1990s. Indeed, during the 1990s there was considerable growth in the number of students entering full and part-time education, which placed significant pressure upon public finances to fund the extra places. Pressure was placed upon institutions to widen participation, particularly those from poorer backgrounds and minority groups, and to ensure that students already within the system progressed (Yorke and Longden 2008). The current economic climate could have a positive impact on student progression. Indeed, according to a 2009 BBC News article, it is estimated that the government will only fund an extra 10,000 new places. Arguably, as institutions tighten their admission processes, this will have a negative impact on the effort to increase student access to HE whilst potentially improving student progression (Geoghegan 2009). However, the dynamics of HE are set to change again, post 2011, due to increase in fees and government control over student numbers (Crown 2011).
progression indicators were developed (along with measures for monitoring access) to measure institutional performances, these included:
• “Rates of non-completion following the first year of full-time undergraduate study;
• Projected completion rates for full-time undergraduates;
• Demographic data relating to participation (such as the proportion of entrants from ‘working class’ backgrounds, and of ‘mature’ entrants) and;
• Employment following graduation. ” (Yorke and Longden, 2008:64).
Further indicators include institutional league tables and rankings (published in both the Guardian and Times newspapers), and data published by the HEFCE. Yorke and Longden (2008) warn that indicators don’t provide a full enough picture to understand the problems of student progression. They suggest that a differentiation needs to be made between those who fail to progress for institutional reasons and those for personal reasons (outside the institutions control), Tinto (1975) refers to this as academic dismissal and voluntary withdrawal.
Through undertaking an extensive review of the literature in this area, a number
of reoccurring themes were identified. Burley (2006) refers to these as Casual
Problems, Modelling and Intervention. Arguably, these problems are stakeholder specific thus it is suggested that these reoccurring themes can be grouped into the following three categories:
a. Stakeholder Influences; b. Theoretical Perspectives; and c. Methods for Intervention.
The proceeding sections will consider each of these categories separately.
3.2.3 Stakeholder Influences on Pr ogression
“The negative aspects of withdrawal, however, represent a waste of resources and of opportunity for students and universities alike, and for the broader society."(Pitkethly and Prosser 2001, p186)
stakeholders have a responsibility for student progression and the student experience. In their 2008 book, Yorke and Longden compiled a comprehensive list of suggestions as to how institutions, students and the state can help facilitate progression. They suggest that progression could be improved through focusing stakeholder efforts in four areas:
• Facilitating the students decision-making about courses;
• Improving the students experience of the course and institution; • Helping students to cope with the demands of the course; and
• Understanding that events impact on students lives outside the institution.
Therefore, what follows is an in depth review of these areas in relation to each stakeholder.
3.2.3.1 The Institution Dimension
“It is important to understand that universities and colleges do not simply react to student expectations. They shape them as we//.” (Ramsden no date, p03)
The institutional dimension is dominated by a number of reoccurring themes. Since the mid-1990's institutions have been placed under significant pressure to widen participation and improve student progression along with the student experience (McGivney 2003). This has resulted in: institutions having to make improvements in the way that they record and measure student progression, increases in financial pressures and the adopting of more flexible approaches to
studying and part-time employment (Yorke 1999, Moxley et al. 2001, McGivney
2003, Yorke and Longden 2008). With the advent of capped student numbers and increased tuition fees it is becoming questionable whether the goal of widening participation is still being pursued with as much importance. This section will mainly focus on the four areas introduced above, and given the quantitative nature of this research, consider potential difficulties that may be faced in measuring progression.
that students who feel well informed, about their programme, are more likely to progress. He points out that the evidence indicates that students fail to progress due to:
"insufficient understanding [...] of the demands of their course (eg the balance of practical and classroom work, assessment requirements and the balance of different components of the course)" Martinez (2001, p04).
This is also highlighted by Yorke and Longden (2008) and McGivney (2003) who suggest that student expectations could be better managed by providing additional information on:
• "course content;
• methods of assessment; • work placements;
• expected time-commitment; • ancillary costs;
• success rates of past students; [...] • employment; [... and]
• the quality of the student experience." (Yorke and Longden 2008, p134).
However, institutions are trying to address this with the introduction of Key Information Set (KIS) Statements (see glossary page viii) for every course as from 2013. In addition to this, students should also be able to:
• attend organised open days;
• access specific programme information;
• be given an opportunity to visit individual departments; and
• obtain answers to question such as "what can the course offer me?" and "Is this course right for me?".
Further to this, institutional literature tends to be compiled in a manner that can alienate students on the basis of their age, gender, disability and ethnicity (Yorke and Longden 2008). Furthermore, Institutions could improve student progression by thoroughly assessing the students suitability, to the institution, and making students aware of the practices and expectations of HE (Yorke and Longden 2008, Thomas 2002). It is also recognised that accepting students on programmes without the key entry qualifications, to complete the course, has a
negative impact on progression rates (Yorke and Longden 2008, Moxley et al.
2001).
It is fair to say that there has been quite a large burden placed upon the institution to improve the student experience (Thomas 2002). The literature, in this area, tends to focus on the institution engaging with students, at two levels General (social interactions) and Academic, before and after they have entered into HE.
“There is no one way to address readiness. In the United States, undergraduate courses are increasingly using the first two terms as periods in which to socialize students into a culture of post-secondary or higher education. "(Moxley etal. 2001, p114).
Yorke and Longden (2008), McGivney (2003), Thomas, (2002), Martinez (2001) and Ramsden (no date) all note the importance of providing opportunities to encourage