A conceptual approach to gene expression analysis
enhanced by visual analytics
MELO, Cassio, ORPHANIDES, Constantinos, MCLEOD, Kenneth, AUFAIRE,
Marie-Aude, ANDREWS, Simon <http://orcid.org/0000-0003-2094-7456> and
BURGER, Albert
Available from Sheffield Hallam University Research Archive (SHURA) at:
http://shura.shu.ac.uk/7158/
This document is the author deposited version. You are advised to consult the
publisher's version if you wish to cite from it.
Published version
MELO, Cassio, ORPHANIDES, Constantinos, MCLEOD, Kenneth, AUFAIRE,
Marie-Aude, ANDREWS, Simon and BURGER, Albert (2013). A conceptual approach to
gene expression analysis enhanced by visual analytics. In: Proceedings of the 28th
Annual ACM Symposium on Applied Computing. New York, NY, USA, ACM New
York, 1314-1319.
Copyright and re-use policy
See
http://shura.shu.ac.uk/information.html
Sheffield Hallam University Research Archive
A Conceptual Approach to Gene Expression Analysis
Enhanced by Visual Analytics
Cassio Melo
École Centrale Paris Châtenay-Malabry, France
Constantinos Orphanides
Sheffield Hallam University Sheffield, United Kingdom
[email protected]
Kenneth McLeod
Heriot-Watt University Edinburgh, Scotland
Marie-Aude Aufaure
École Centrale Paris Châtenay-Malabry, France
Simon Andrews
Sheffield Hallam University Sheffield, United Kingdom
Albert Burger
Heriot-Watt University Edinburgh, Scotland
[email protected]
ABSTRACT
The analysis of gene expression data is a complex task for biologists wishing to understand the role of genes in the for-mation of diseases such as cancer. Biologists need greater support when trying to discover, and comprehend, new re-lationships within their data. In this paper, we describe an approach to the analysis of gene expression data where over-lapping groupings are generated by Formal Concept Analy-sis and interactively analyzed in a tool called CUBIST. The CUBIST workflow involves querying a semantic database and converting the result into a formal context, which can be simplified to make it manageable, before it is visualized as a concept lattice and associated charts.
Categories and Subject Descriptors
H.4 [Information Systems Applications]: Miscellaneous; J.3 [Life and Medical Sciences]: Medical information sys-tems
General Terms
Algorithms, Experimentation.
Keywords
Formal Concept Analysis, Bioinformatics, Visual Analytics, Association Rules
1.
INTRODUCTION
Biology is increasingly an information-centric discipline. This amplifies the biologist’s need for greater support when trying to discover, and comprehend, new relationships within the data [4]. In particular, the analysis of gene expression is of vital importance to the understanding of the phenomena
Permission to make digital or hard copies of all or part of this work for personal or classroom use is granted without fee provided that copies are not made or distributed for profit or commercial advantage and that copies bear this notice and the full citation on the first page. To copy otherwise, to republish, to post on servers or to redistribute to lists, requires prior specific permission and/or a fee.
SAC’13March 18-22, 2013, Coimbra, Portugal.
Copyright 2013 ACM 978-1-4503-1656-9/13/03 ...$10.00.
leading to diseases such as cancer, alzheimer’s disease and multiple sclerosis.
A gene is a unit of instructions that directs the body how to do one essential task, i.e. create a protein. Gene expres-sion information describes whether or not a gene is expressed (active) in a location. There are many types of gene expres-sion experiment. This work focuses on a technology called
in situhybridisation (ISH) gene expression. Completed ISH experiments are published online. For the mouse, one of the main resources in this field is EMAGE1
.
A number of computational methods have been proposed to help biologists discover unexpected patterns and formu-late interesting hypotheses. Popular techniques employ un-supervised classification methods such as clustering, to group and visualise co-expressed genes (see [15] for a survey). The main limitation of most clustering algorithms is that they do not allow clusters to overlap, a counter-intuitive idea in this domain as genes are not restricted to a specific function and usually take part in several biological processes when interacting with other genes.
Other methods use Formal Concept Analysis (FCA) to mine frequent patterns of gene expression data. FCA emerged in the early 80’s as a mathematical framework to reveal co-occurrence patterns between sets of objects and attributes, usually depicted in a hierarchy of partially-ordered concepts in a structure known as concept lattice.
One of the main motivations for the use of FCA in life sciences comes from the idea that FCA provides an intuitive understanding of generalisation and specialisation relation-ships among objects and their attributes. In [10] for exam-ple, FCA was used to extract groups of genes with similar expressions profiles from data of the fungusLaccaria bicolor. In [5] authors developed a tool to query a set of extracted formal concepts in a human gene expression data set accord-ing to various criteria (e.g. presence of a keyword in a gene description) and then to cluster concepts according to sim-ilarity, in terms of the attributes (samples) and the objects (genes above a threshold of expression) constituting the con-cepts. They called these clustersquasi-synexpression-groups
(QSGs).
In common with previous works is the traditional Hasse diagram, used to represent concept lattices. In particular, they suffer from considerable edge crossings when number of
1
concepts exceed a few dozen, as is the case of gene expression data, leading to reduced graph readability and aesthetics [12]. Visual analytics can be seen as an integral approach combining visualization, human factors and data analysis [11] and can greatly enhance the visualisation and explo-ration of concept lattices [1]. The use of Visual Analytics in the biology domain is a promising alternative to the large cluster analysis as demonstrated by Akandet al. in [1]. In [1] an algorithm is proposed that generates a browse-able concept lattice, allowing incremental exploitation of large concept lattices on a biological data set.
In this work we propose a combined approach using FCA, Association Rules and Visual Analytics to address the chal-lenges of gene expression analysis, through filtering and clus-tering of large amounts of data, interactive exploration of the data, display of relevant statistics and in particular, iden-tification of inconsistencies. We developed a tool, called CUBIST, that implements the approach, addressing those challenges.
This work is part of a three-year project which aims to unite Semantic Technologies and Business Intelligence in or-der to facilitate analysis of large volumes of structured and unstructured data.
The remainder of the paper is organized as follows. Sec-tion 2 briefly introduces the EMAGE data set. In SecSec-tion 3 the CUBIST user interface and its functionalities are intro-duced, after a short introduction to Formal Concept Anal-ysis. Finally, the conclusion and future work are presented in Section 4.
2.
EMAGE DATA SET
Ageneis a unit of instructions that provides directions for one essential task. Gene expression information describes whether or not a gene is expressed (active) in a location, e.g., the gene helps create the heart.
In situ hybridization (ISH) gene expression information is given in relation to a tissue in an organism. Here the organism is the developmental mouse. This is the mouse from the moment it is conceived until it is born - this period is split into 26 distinct stages called Theiler Stages (TS). Each stage has its own anatomy (ontology) called EMAP2
. The result of an ISH experiment is analyzed under a mi-croscope by a human expert. That expert provides a series of triples (gene - level of expression - tissue) to describe the result., e.g., bmp4 is weakly expressed in the heart TS17. “Level” is a textual description of how active (important) the gene is in the development of the tissue - strongly ex-pressed genes are very active,weaklyexpressed genes less so, and genes that arenot expressed are inactive.
The triples are published online in a resource such as EMAGE3
. In this paper tissues may be referred to by EMAP IDs rather than their full name. Therefore the “heart TS17” becomes “EMAP:2411”.
A subset of the EMAGE data set, covering the textual annotations, has been provided to the CUBIST project and federated into a semantic repository.
ISH information enables biologists to discover relation-ships between genes, for example, when genes are active in the same location. Such information provides insights into the ways in which relationships between genes affect the
de-2
http://www.emouseatlas.org/emap/ema/home.html 3
http://www.emouseatlas.org/emage/
velopment of a tissue. Comparisons between healthy and abnormal tissues lead to a better understanding of diseases (e.g. cancer) and birth defects (e.g. a cleft lip).
Regrettably, the tools for analyzing this information are still in an early stage of development. Accordingly, sophis-ticated analysis of the data is beyond the average biologist. There is a need to enable every biologist to perform complex investigations of their data. Yet, it is important to remem-ber that biologists are not computer scientists, i.e. the tools should be powerful, yet easy to understand and use.
3.
BACKGROUND ON FCA
Before proceeding, we would like to recall the FCA termi-nology. In mathematical terms, a formal context is defined as a tripleK= (G, M, I), withG being a set of objects,M
a set of attributes andI a relation defined betweenG and
M. The relationI is understood to be a subset of the cross product between the sets it relates, so I ⊆G×M. If an object g has an attribute m, then g ∈ G relates to m by
I, so we write (g, m)∈ I, orgIm. For a subset of objects
A⊆G, a derivation operator′ is defined to obtain the set
of attributes, common to the objects inA, as follows:
A′={m ∈ M | ∀g ∈ A:gIm}
In a similar manner, for a subset of attributesB⊆M, the derivation operator′ is defined to obtain the set of objects,
common to the attributes inB, as follows:
B′={g ∈ G| ∀m ∈ B:gIm}
A pair(A, B)is aformal concept in a given formal con-text (G, M, I) only ifA ⊆G,B⊆M,A′=B andB′=A.
The set A is the extent of the concept and the set B is the intent of the concept. A formal concept is, therefore, a closed set of object/attribute relations, in that its extension contains all objects that have the attributes in its inten-sion, and the intension contains all attributes shared by the objects in its extension. The table below shows an exam-ple of a formal context of genes and EMAP identifiers in which they were detected. Genes U pk2, Itpr3 and iden-tifiers EMAP:7847, EMAP:7364, EMAP:7363 constitute a formal concept because objects U pk2 and Itpr3 share all attributes EMAP:7847, EMAP:7364, EMAP:7363 and at-tributes EMAP:7847, EMAP:7364, EMAP:7363 are featured by both objects U pk2 andItpr3 (thus making the relation closed). Expression E M A P :7 8 4 7 E M A P :7 3 6 4 E M A P :7 3 6 3 E M A P :7 3 7 1 E M A P :8 3 8 5 E M A P :7 2 0 4
Upk2 × × ×
Itpr3 × × × × ×
Cops7b × ×
Tgfbi × ×
However, density and ‘noise’ of a formal context are fac-tors that can dramatically increase the number of formal concepts, which can result in unmanageable concept lattices. In this case, relevance measures such as stability and sup-port can minimise input data needed for the computation of concept lattices [9]. In the subsequent sections we will describe the techniques we used to deal with noise in data and reduce the number of concepts generated.
4.
A CONCEPTUAL APPROACH TO GENE
EXPRESSION ANALYSIS ENHANCED BY
VISUAL ANALYTICS
In [3] authors presented an approach to use FCA to anal-yse large clusters of gene co-expressions. The approach makes use of the formal context creator FcaBedrock4
and the formal concept miner In-Close5
(the aforementioned tools are being redeveloped in CUBIST) to convert and simplify formal contexts. The workflow is explained as follows. The user supplies metadata for conversion in FcaBedrock, such as the names of the genes or tissues and their values, and with decisions as to what to convert and how to convert it. These metadata are used to create a formal context. User-defined constraints, such as object exclusion, attribute exclusion and attribute restriction, applied to the data, al-low different analyses to be carried out and the creation of sub-contexts which only focus on particular portions of the data. Next, In-Close is applied to the context file gener-ated in the previous step. Using a trial and error approach, the user has to find an appropriate minimum size to mine a small number of large concepts, i.e., find the largest co-expressions of genes within the data. Finally, a third tool, Concept Explorer6
was used to visually display the corre-sponding concept lattice.
Whilst the above workflow required three standalone tools and FCA expertise, the same workflow has now been in-corporated in CUBIST. Most of the complexity has been hidden, empowering the biologists to run the entire work-flow themselves. Additionally, whilst FCA could only be visualised via a static lattice, CUBIST provides a series of analytical features and is able to deal with the implicit re-lationships and inconsistencies in the EMAGE data.
To illustrate, gene expression information should propa-gate through the mouse because the anatomy is organized as a series of part-of relationships, e.g. the paw is part-of the limb. If a gene is expressed in the paw, it is also found in the limb. Likewise, if a gene is not expressed in the limb it cannot be found in the paw. So when one experiment suggests a gene is expressed in the paw, and a second ex-periment shows that the same gene is not expressed in the limb, there is an inconsistency to be handled.
In the following sections we describe the methods to scale and convert the formal context from a semantic database; Visually explore clusters of expressed genes; Identify and treat cases of noise and inconsistencies in the data and; High-light patterns of co-occurrence with association rules.
4.1
Querying and Converting the Gene
Expres-sion Ontology Data to Formal Contexts
In contrast with traditional FCA, which takes as input a binary table of objects and attributes, our approach is based on the querying of ontology data which is then converted to a formal context in a process transparent to the user. The conceptual analysis of ontologies provides unique informa-tion of gene expression data, by grouping entities belonging to particular properties in a hierarchical fashion and high-lighting patterns of co-occurrence for those groups. Because biologists have little or no knowledge of SPARQL, the lan-guage we use to query ontologies, a set of pre-defined queries 4
http://sourceforge.net/projects/fcabedrock 5
http://sourceforge.net/projects/inclose 6
http://sourceforge.net/projects/conexp
are available.
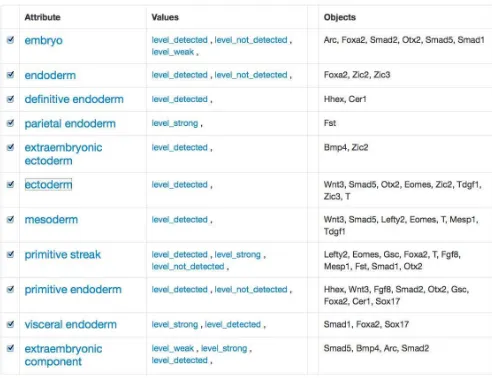
[image:4.612.319.565.221.410.2]The procedure consists of translating each object o, at-tribute a and their incidence relation I in the result table such as o ∈ G and a ∈ M, to create the formal context K = (G, M, I). As the number of variables in a query can be arbitrary, CUBIST has an option that allows users to select whether a given column in the result table is an ob-ject column, attribute or none. Contrarily to traditional FCA tools, in CUBIST the formal context is transparent to the user. The data is displayed in a table where its rows contain attributes, followed by attribute values and objects, in the columns (Figure 1). We found that this structure is more accessible to non-FCA experts. Filtering, sub-selection and conversion operations are possible through functionali-ties that came from the aforementioned tool FcaBedrock.
Figure 1: Genes, tissues and level of expression in Theiler Stage 9.
After the creation of the formal context, it is passed to the concept miner, which returns the number of formal concepts to the user. If the number of formal concepts is too high, the user can exclude from the computation concepts with fewer than a user-specified number of attributes and objects (so-called minimum support), to simplify the context further. Apart from the user being able to manually define minimum-support criteria, in CUBIST, the minimum-minimum-support feature is being reconfigured to be automatically calculated and ap-plied to the formal context without user intervention.
4.2
Visual Analysis of Expression Clusters
Traditional software in FCA makes little use of visuali-sation techniques, producing poorly readable lattice graphs when the number of concepts exceeds a few dozen [5, 7]. To reduce the complexity of lattices, simplified diagrams can be produced by condensing or clustering concepts accord-ing to their intent frequency [8]. Visualisations can also be restricted to portions of the data [7], and concept size reduction is possible by incorporating conditions into the data mining process [17]. Finally, conceptual measures can be applied to identify the most relevant concepts and filter outliers [13].
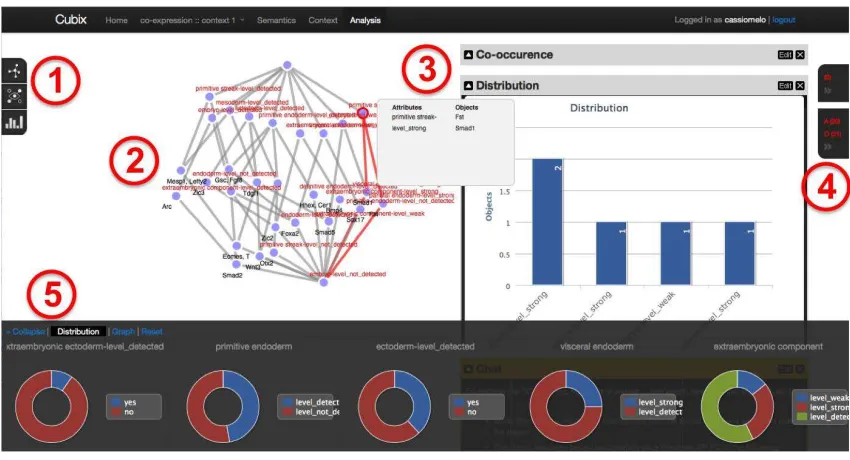
Figure 2: CUBIST user interface displaying the concept lattice for genes, tissues and level of expression in Theiler Stage 9 . Its main components: 1) Toolbar; 2) Visualisation canvas; 3) Dashboard; 4) Selection & entities bar and; 5) Filter bar.
selecting, transforming and clustering concepts. Figure 2 - 2 displays the selected visualisation for the concept lat-tice. Other visualisation options are: Hasse diagram (lay-ered graph), matrix (objects×attributes), sunburst (nodes as concentric arcs), and tree (no edges crossings). A filter bar (Figure 2 - 5) has two functions: first it allows the fil-tering of concepts through the visual selection of attributes; second, it displays the current conceptual distribution for each attribute. It is possible to perform textual search on the genes or tissues names for instance, with an auto-completion feature to help users easily locate the entity they are look-ing for. The results are dynamically highlighted as the user searches in the different concept nodes.
In addition to the main concept lattice visualisation, sev-eral charts display different aspects of the underlying concep-tual structure such as co-occurrence of attributes, concepts distribution, stability vs. support, etc. (Figure 2 - 3). Some charts are updated when the user points the mouse over a concept, highlighting details of the concept. Similarly, a selection of a point/series in the chart will highlight the concerned concepts in the lattice. This technique is called
Linking and Brushing.
Clustering of concepts (as opposed to clustering of objects or attributes) can be useful to facilitate the browsing of con-cepts and to identify zones of interest in the gene expression data. In our experiment (Figure 3), we used a K-means clus-tering algorithm to identify clusters of gene expression infor-mation. Some similarity measures are based on the concept lattice topology (e.g. counting the number of links between two concepts); Intent/extent similarity (e.g. Jaccard for the extent); or confidence between two pairs of concepts. In this case, we used similarity measures proposed by Boutariet al.
[6].
Concept similarity (Jaccard). It is a coefficient for calculating the ratio of shared attributes between concepts. We define concept similarity as:
Figure 3: A radial-filling “Sunburst” visualisation of the gene expression data with colours depicting clusters.
CSim(A, B) = |ma∩mb|
|ma|+|mb|
+ |ga∩gb|
|ga|+|gb|
(1)
Proximity. Conceptual proximity is the topological dis-tance between conceptsAandB in the concept lattice.
prox(A, B) = 1−shortestDistance(A, B)
diameter(Lattice) (2)
Strength. It is the average concept similarity value (CSim) along the shortest path between a pair of concepts.
Figure 3 visualises the concept lattice from the context shown in Figure 1. Each concept is an arc and the hierarchy is represented from the innermost to the outermost layer. Colours shows how concepts are distributed in the clusters, which facilitates the identification of zones of interest (e.g. concepts related to genes expressed in tissues of the same organ).
4.3
Dealing with Noise and Inconsistencies
Biological data are naturally inconsistent and incomplete. This is due to the sheer complexity of the subject matter; something as simple as a 1◦ degree change in temperature
can cause otherwise identical experiments to provide differ-ent outcomes. Often experimdiffer-ents are repeated in order to confirm the original conclusion, yet this creates the potential for conflicting results, e.g.
bmp4 - strong - epiblast TS8
bmp4 - not detected - epliblast TS8
These two annotations (from two different experiments) deal with the same gene and the same structure (at the same point in time). Ideally, they would have the same level of expression too. Yet, this is not the case: the first anno-tation suggests the gene is expressed, whilst the second says it is not. To address inconsistencies of this type, CUBIST emphasizes the conflict by utilizing distinct colours accord-ing to the inconsistency type: binary (expressed versus not expressed) and analogue (e.g. strong expression is distinct from weak expression despite both levels suggesting a gene is expressed).
Another cause of inconsistency is the propagation of gene expression information. The mouse anatomy is a partonomy, with each tissue being part-of another, .e.g., the brain is part-of the head. If a gene is expressed in the brain, it must be expressed in the head, i.e., positive expression is propagated up the anatomy. In contrast, if a gene is not expressed in the head, then it cannot be expressed in any sub-component of the head. Accordingly, the gene is not expressed in the brain, i.e., negative expression is propagated down the anatomy. In CUBIST, this information is used to resolve propagation at run time whenever a user queries the EMAGE data. Once again, detected inconsistencies are brought to the user’s attention.
CUBIST also looks for flip-flops. This occurs when a gene is expressed in stagestandt+ 2 but not int+ 1. For exam-ple, a gene is shown to be expressed in the dorsal mesentery in stages 16 and 18, but is not expressed in TS17. This flip-flop may be a sign that the annotation for TS17 is ei-ther missing or incorrect. To tackle this, we created a back-ground process that is triggered whenever the ontology data is updated, checking for flip-flops and fixing (adding) miss-ing annotations. The added instances are marked with an “autofix” label and stored back in the repository.
Another technique for approximating concepts in CUBIST, apart from the aforementioned minimum-support, is fault tolerance [14]. By applying fault tolerance to a formal con-text, missing data can be inferred, i.e., missing crosses in the formal context can be assumed to exist. If, for example, all missing crosses in a formal context are filled, the formal context can be approximated to a single formal concept. A
practical application of minimum-support and fault toler-ance is evidenced in [2], where a large co-expression of genes in the skull bones of a mouse embryo was discovered. This was possible by mining the EMAGE data for large formal concepts. Disjoint groups of large concepts were then inden-tified and fault tolerance applied to each disjoint group to produce a single very large co-expression from each group.
4.4
Using Association Rules to Highlight Gene
Expression Occurrence Patterns
Association Rules (AR) are under the form premise =⇒
conclusion: m1AN Dm2AN D...mn =⇒ n1AN Dn2AN D...nn form, n∈M and can be used to extract biological knowl-edge [16]. However, ARs carry very little information about how they can be visualized. They are typically displayed as a list of logical sentences, unpractical to analyse when the number of rules is large.
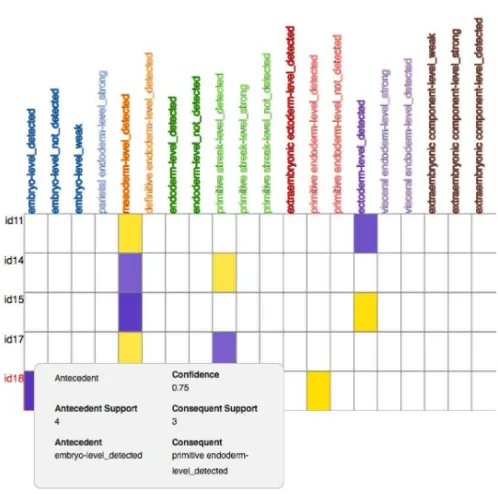
CUBIST currently provides two visualisations for associ-ation rules, combined with statistics and charts to enable progressive exploration of the ruleset: A matrix view, where each rule is displayed in a row and the concerned pairs of attribute-value in columns, with purple cells representing the premise and yellow ones the conclusion. The second visualisation is a radial graph showing how pairs attribute-value implies to each other in a radial graph layout. A scat-terplot matrix in the dashboard shows the distribution of confidence, support and lift for the association rules, allow-ing users to graphically select portions of the distribution they are interested in.
To illustrate, after filtering the rules generated for the context in Figure 1 by confidence down to a manageable size, results revealed a few interesting facts. A significant amount (75%) of the genes detected in the embryo were also detected in the primitive endoderm (Figure 4) in TS9. This is not surprising, since the later tissue is part of the former in the anatomy hierarchy. On the other hand, another rule showed that 71% of the genes detected in the mesoderm were detected also in the ectoderm (against 62% the other way around) in TS9. This follows an intuitive reasoning since both tissues are part of the same organ.
5.
CONCLUSIONS AND FUTURE WORK
In this paper, we described an approach to the analysis of gene expression data where overlapping groupings are gener-ated by Formal Concept Analysis and interactively analysed in an analytical tool called CUBIST. CUBIST workflow al-lows users to carry out an analysis starting from querying a semantic database, converting it into a formal context, simplifying the context to make it manageable, and visual-ising the result as a concept lattice and associated relevant statistics.
Existing tools for genes expression analysis, such as Cy-toscape7
and Orange8
have specific advantages, e.g. Cy-toscape can run efficient analysis in network data and Or-ange is a machine learning tool with some predictive fea-tures. In contrast, CUBIST operates at a conceptual level and it is less data-mining centric and more analytics ori-ented (i.e, dashboards, drill-down, selection and filtering, etc). Besides, those tools are designed to run locally whereas CUBIST is being designed to run on a cluster of
comput-7
http://www.cytoscape.org 8
Figure 4: Genes, tissues and level of expression in Theiler Stage 9.
ers eventually in the cloud. This will allow scalable analysis of data of orders of magnitude higher than the mentioned tools.
Although most of the functionalities in CUBIST can be used with other data than EMAGE (with the corresponding scaling of data), as future work we will extend our exper-iments to other genes expression data sets like cancer and brain development. We also intend to provide a public web service API to allow interoperability with other platforms.
Acknowledgments
Funding was provided by the EU project CUBIST (FP7-ICT-2010-257403).
References
[1] E. Akand, M. Bain, and M. Temple. A Visual Analytics Approach to Augmenting Formal Concepts with Rela-tional Background Knowledge in a Biological Domain. Dec. 2010.
[2] S. Andrews. In-close2, a high performance formal concept miner. In Proceedings of the 19th interna-tional conference on Conceptual structures for discov-ering knowledge, ICCS’11, pages 50–62, Berlin, Heidel-berg, 2011. Springer-Verlag.
[3] S. Andrews and K. Mc
Leod. Gene co-expression in mouse embryo tissues. InProceedings of the 1st Com-bining and Uniting Business Intelligence with Semantic Technologies workshop, volume 753, 2011.
[4] E. Z. Antezana San Roman, M. Kuiper, and V. Mironov. Biological knowledge management: the emerging role of the semantic web technologies. Brief-ings in Bioinformatics, 10(4):392–407, 2009.
[5] S. Blachon, R. Pensa, J. Besson, C. Robardet, and J.-F. Boulicaut. Clustering formal concepts to discover bio-logically relevant knowledge from gene expression data.
In Silico Biology, 7(0033), July 2007.
[6] A. M. Boutari, C. Carpineto, and R. Nicolussi. Evalu-ating term concept association measures for short text expansion: two case studies of classification and cluster-ing. 7th International Conference on Concept Lattices and their Applications (CLA 2010), 2010.
[7] Ducrou, P. J., Eklund, and T. Wilson. An intelligent user interface for browsing and searching mpeg-7 im-ages using concept lattices. InCLA 2006, volume 4923, pages 1–21. Springer-Verlag Berlin Heidelberg, 2008.
[8] S. Gerd, R. Taouil, Y. Bastide, N. Pasquier, and L. Lakhal. Computing iceberg concept lattices with titanic. Data & Knowledge Engineering, 42:189–222, August 2002.
[9] R. Godin, R. Missaoui, and A. April. Experimental comparison of navigation in a galois lattice with con-ventional information retrieval methods. International Journal of Man-machine Studies, 38:747–767, 1998.
[10] M. Kaytoue-Uberall, S. Duplessis, and A. Napoli. Using formal concept analysis for the extraction of groups of co-expressed genes. InMCO’08, pages 439–449, 2008.
[11] D. A. Keim, F. Mansmann, J. Schneidewind, H. Ziegler, and J. Thomas. Visual analytics: Scope and challenges. December 2008. Visual Data Mining: Theory, Tech-niques and Tools for Visual Analytics, Springer, Lec-ture Notes In Computer Science (lncs).
[12] C. Melo, B. Le-Grand, M. Aufaure, and A. Bezerianos. Extracting and visualising tree-like structures from con-cept lattices. In15th International Conference on In-formation Visualisation, pages 261 –266, july 2011.
[13] M.-A. A. Michel Soto, Benedicte Le Grand. Spatial visualisation of conceptual data. International Confer-ence Information Visualisation, pages 57–61, 2009.
[14] R. Pensa and J.-F. Boulicaut. Towards fault-tolerant formal concept analysis. In Proc. 9th Congress of the Italian Association for Artificial Intelligence AI*IA’05, LNAI, pages 212–223. Springer, Sept. 2005.
[15] A. Preli´c, S. Bleuler, P. Zimmermann, A. Wille, P. B¨uhlmann, W. Gruissem, L. Hennig, L. Thiele, and E. Zitzler. A systematic comparison and evaluation of biclustering methods for gene expression data. Bioin-formatics, 22(9):1122–1129, May 2006.
[16] P. C. Saez, M. Chagoyen, A. Rodriguez, O. Trelles, J. Carazo, and A. P. Montano. Integrated analysis of gene expression by association rules discovery. BMC Bioinformatics, 7(1):54+, 2006.
[17] M. Zaki and C.-J. Hsiao. Efficient algorithms for min-ing closed itemsets and their lattice structure. In
IEEE Transactions on Knowledge and Data Mining, volume 17. IEE Computer Soc., 2005.