A Repeated Sampling and Clustering Method for Intrusion
Detection
MWITONDI, Kassim and ZARGARI, Shahrzad
<http://orcid.org/0000-0001-6511-7646>
Available from Sheffield Hallam University Research Archive (SHURA) at:
http://shura.shu.ac.uk/16537/
This document is the author deposited version. You are advised to consult the
publisher's version if you wish to cite from it.
Published version
MWITONDI, Kassim and ZARGARI, Shahrzad (2017). A Repeated Sampling and
Clustering Method for Intrusion Detection. In: STAHLBOCK, Robert, ABOU-NASR,
Mahmoud and WEISS, Gary M., (eds.) Proceedings of the 13th International
Conference on Data Mining (DMIN '17). CSREA Press, 91-96.
Copyright and re-use policy
See http://shura.shu.ac.uk/information.html
A Repeated Sampling and Clustering Method for Intrusion Detection
Mwitondi1, K. and Zargari2, S.
Sheffield Hallam University, Department of Computing1,2, Sheffield, United Kingdom [email protected]@shu.ac.uk
Abstract
Various tools, methods and techniques have been developed in recent years to deal with intrusion detection and ensure network security. However, despite all these efforts, gaps remain, apparently due to insufficient data sources on attacks on which to train and test intrusion detection algorithms. We propose a data-flow adaptive method for intrusion detection based on searching through high-dimensional dataset for naturally arising structures. The algorithm is trained on a subset of 82332 observations on 25 numeric variables and one cyber-attack label and tested on another large subset of similar structure. Its novelty derives from iterative estimation of cluster centroids, variability and proportions based on repeated sampling. Data visualisation and numerical results provide a clear separation of a set of variables associated with two types of attacks. We highlight the algorithm’s potential extensions – its allurement to predictive modelling and adaptation to other dimensional-reduction techniques.
Keywords: Clustering, Cross-Validation, Cyber-Security,
Data Mining, Intrusion Detection
1 Introduction
Anomaly intrusion detection deals with detecting of unknown attacks in the network traffic therefore, they are difficult to identify without human intervention. Network administrators struggle to keep up with Intrusion Detection System (IDS) alerts, and often manually examine system logs to discover potential attacks. While various tools, methods and techniques have been developed to deal with intrusion detection and ensure network security, gaps remain, apparently due to insufficient data sources on attacks on which to train and test intrusion detection algorithms. In recent years, data mining and machine learning techniques have widely been adopted within the network security community [1] [2] as the Big Data era entails a greater understanding of the underlying rules for intrusion detection. But, as described below, these developments have brought about both opportunities and challenges.
We propose a data-flow adaptive approach to intrusion detection based on high-dimensional cyber-attacks data described in Section 3.1. Our
approach derives from the original ideas in [3] and [4] who laid down the general framework for data mining-driven intrusion detection. The former applied association rules and frequent episodes from audit data for feature selection processes and the latter combined association mining with classification. Both were driven by "the degree of confidence" associated with intrusion detection -the main challenge in knowledge extraction from data as noted in [5]. This paper seeks to uncover the general intrusion behaviour and its allurement to predictive modelling. Its main objectives are
1) To perform dimensional reduction of the data attributes through repeated sampling
2) To comparatively assess the emerging naturally arising groupings and
3) To propose a framework for intrusion detection via unsupervised and supervised modelling
The paper is organised as follows. Section 2 examines previous work relating to the overall behaviour of intrusion and normal activities. It is followed, in Section 3, by the methods–outlining the data sources and the adopted methods. Data analyses, results and discussions are in Section 4 and concluding remarks and recommended future directions are in Section 5.
2 Background
as artificial neural networks, fuzzy systems and swarm intelligence have also been applied in modelling fault tolerance and error resilience [9]. Similar studies were motivated by the need for developing flexible and adaptive security oriented approaches on different platforms [10].
It is imperative to note that identifying the most relevant features in intrusion detection is not confined to algorithmic computing – it depends much on existing expert domain knowledge skills and the way they are combined with automated tools [11]. This dependency is generally attributed to the overall objective of data mining –extraction knowledge from data. Typically, frameworks for fulfilling that relationship are based on pre-defined ontologies with inherently highly dynamic parameters. The dynamics of these parameters are encapsulated within the domains of unsupervised and supervised modelling for which many applications have been developed in recent years [12]. In the next exposition, we outline an integrated strategy to harmonising inherent dynamics in modelling cyber-attacks via multiple samples.
3 Methods
A high-dimensional dataset is used to explore the general behaviours of cyber-attacks. The dataset comprises of potentially highly correlated variables. The methodology fulfils the following key functions - data understanding, cleansing, clustering and interpretation.
3.1 Data Sources
Data came from thousands of raw network packets of the UNSW-NB 1 15 created by the IXIA PerfectStorm tool in the Cyber Range Lab of the Australian Centre for Cyber Security (ACCS). The dataset, created using twelve algorithms [13] [2], through the process at the top of Figure 1 represent a high-dimensional data which we denote by
1
https://www.unsw.adfa.edu.au/australian-centre-for-cyber-security/cybersecurity/ADFA-NB15-Datasets/
[image:3.612.335.539.44.381.2]ȳ ൌ ൣߦ൧ǡ ݅ ൌ ͳǡʹǡ͵ǡ ǥ ǡ ݆݊ܽ݊݀ ൌ ͳǡʹǡ͵ǡ ǥ ǡ (1)
Figure 1: Data cyber-attack data generation (top) and “normal” and “attack”traffic
where ݊is the number of observations and is the number of variables. The bottom panel exhibits one of the two class labels of the data with ten levels –
9 different levels as attacks and one as “normal”.
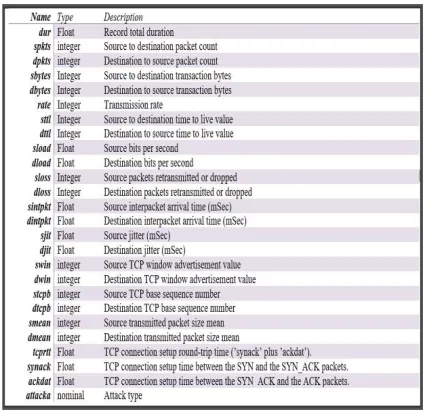
We select 82,332 observations on 27 variables –
two derived from others as shown in Table 1.
[image:3.612.331.544.484.690.2]The multivariate dataset forms a good source of training and testing data
ؿ ȳȁ ൌ ሾݔఛሿǡ ݅ ൌ ͳǡʹǡ͵ǡ ǥ ǡ ݊ܽ݊݀߬ ൌ ͳǡʹǡ͵ǡ ǥ ǡ (2)
The foregoing objectives require searching through the entire sub-space ؿ ȳfor natural groupings of data ܥఎǤIf we let ܭ א ܺbe the number of groups, each with a notional probability ߨ where σୀଵɎ୩=1, the p-dimensional probability function ሺܺǡ ߱ሻis fully described by the parameters in ߱ǡmaking it possible to merge or split clusters in accordance with adopted measures of similarity. Our strategy seeks to determine group proportions formed by ܿఎ א ܺand their membership which we treat as missing data and by repeatedly sampling from ܺ we create and validate clusters that characterise the overall behaviour of cyber intrusion.
3.2 Modelling Strategy
Determining the optimal number of clusters in high-dimensional data remains a major challenge in many applications – particularly because data attributes may be highly correlated. A common starting point is usually Exploratory Data Analysis (EDA) which serves to describe the overall data behaviour. Subsequently, dimensional reduction techniques may be applied to reduce the number of variables by combining them. Two popular approaches to dimensional reduction are data clustering – in all its variants and principal component analysis (PCA) [14]. Both methods rely on inherent parameters – typically referred to as “bandwidth” - to determine the underlying structures in data. We conceptualise dimensional reduction via kernel density estimation (KDE) of the probability density function [15] to highlight the bandwidth selection issues and associated smoothing techniques [16]. The KDE is defined as
݂መሺݔఛሻ ൌ ଵ
σ ܭሺݔ െ ݔఛሻ ൌ
ୀଵ
ଵ
σ ܭ ቀ
௫ି௫ഓ
ቁ
ୀଵ (3)
where ܭሺݔ െ ݔఛሻ݀ݔ ൌ ͳand it is centred at 0 and ݄ Ͳ is a smoothing parameter that determines the exact shape of the kernel.
The choice of ݄, typically, determines the number of modes in the random variable. Its optimal value is therefore proportional to the expected value of the difference between the fitted and actual functions ܧ ቀ݂መሺݔሻ െ ݂ሺݔሻቁ
ଶ ൨Ǥ
The KDE is a special case of clustering with the multivariate case, where ܿఎݏ combine to form natural groupings in ܺand can be compared to the class variable i.e., ܿఎ ן ݔఛ א ܺ. Thus, if we let ݔఛ א ܥ ൌ ሼͳǡ ʹǡ ǥ ǡ ܭሽdenote group membership, then this membership is associated with an unobservable indicator variable ݖdefined as
ݖ ൌ ሼͲǡ ͳሽൌ ሺݖଵǡ ݖଶǡ ǥ ǡ ݖሻsuch that ݖൌ
൜ͳ݂݅ܥ ൌ ݇ Ͳ݂݅ܥ ് ݇ (4)
Since the unobserved variable associates each ݔఛ with a data cluster ܥఎ, our strategy will be seeking to optimise the expected value of ݄ via repeated sampling. Each sample generates a correlation matrix that is re-ordered based on the angular order of the eigenvectors
ܽ ൌ ൝
൫݁ଶ ݁ଵ
ൗ ൯ ݂݅݁ଵ Ͳ
൫݁ଶ ݁ଵ
ൗ ൯ ߨ (5)
where ݁ଵ and ݁ଶ are the largest eigenvalues from the matrix. For each sample we estimate cluster proportions, centres and variability as follows
ߨො ൌ σಿసభ௭ೖ
כ ǢߤƸ ൌ
σಿసభ௭ೖ௫ഓ σಿసభ௭ೖ
Ǣߪොଶൌ
σಿసభ௭ೖሺ௫ഓିఓෝೖሻమ σಿసభ௭ೖ
(6)
The updated parameters are then used for intermediate cross-validation of the emerging structures which are subsequently interpreted and labelled. Final validation is done via comparison with known structures of attack types as outlined below.
4 EDA, Dimensional Reduction and Visualisation
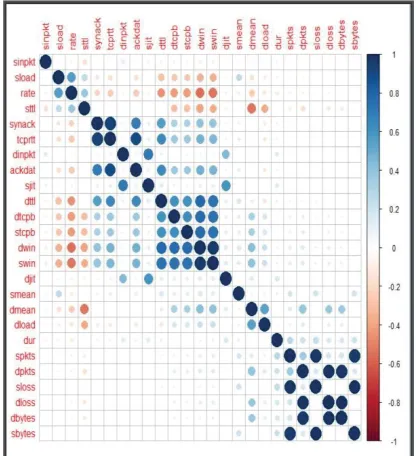
matrix re-ordered on its angular order of its eigenvectors which exhibits the separation of the variation. These patterns are averaged over repeated runs and the emerging structures are validated via comparison with attack labels.
Figure 2: Original correlation matrix (LHS) and its re-ordered version on the RHS
The emerging structures in Figure 2 provide insights into how different transmission parameters interact based on which we adjust the adopted cut-off point – in our case, the “tol” parameter in the
prcomp()in R – for extracting dominant patterns
within ܺ ؿ ȳǤ As PCA deals with
multicollinearity through its orthogonal properties, repeated sampling is only concerned about variability and so the tuning parameter “tol”, in this case, which is a function of the standard deviation and the first component is crucial. Our repeated samples utilised a range of levels each projecting testing data onto the PCA coordinate basis.
Figure 3: Plot of the variable loadings - rotations
The most challenging part of PCA is interpreting the extracted components. Among the crucial outputs of the prcomp()function in R is the matrix of variable loadings – called rotations whose columns are eigenvectors of the linear transformation with a direction that is invariant to the transformation. Figure 3 presents a visual pattern of the rotations - the higher the absolute values the more important a variable is –with the combinations of positive and negative values being
[image:5.612.330.545.302.507.2]interpreted as “mixed”. These rotations help in interpreting the extracted components with their different proportions of loaded variables. Since the rotations occur in a subspace of the retained components, the rotation results are affected by the choice of the subspace. Hence, to attain a robust interpretation of the rotation, it is strongly recommended to try several sizes for the subspace. It therefore reasonable to consider averages over multiple random runs.
Figure 4: Attack type projections of the highest two components selected from multiple samples Figure 4 provides a summary of the results from multiple sampling and clustering. These projections of components one and two were selected from repeated random samples. It was generally evident from the repeated samples that there is a great separation of attributes that describe
Generic and Exploitsattack types. Each group is associated with a probability and so our repeated sampling experimented with a wide range of probabilities - in line with the strategy proposed above for estimating cluster centroids, variability and proportions.
5 Concluding Remarks
[image:5.612.60.278.546.730.2]dataset. Repeated sampling from a high-dimensional on-line traffic data produced adaptable centroid, variability and proportion parameters. These parameters are generally used to fine-tune potential structures in each sample which are then aggregated over many runs to come up with recognisable components which allure to predictive modelling. Its novelty derives from iterative estimation of cluster centroids, variability and proportions based on repeated sampling from a large cyber-attack data source. Our results show that out of 25 on-line traffic variables, only a handful could be good predictors of attacks. More importantly, of the nine different attack types only two stood out distinctively in relation to the predictors. Without being influenced by the provided levels of attack types, this finding is particularly intriguing for two reasons – it may mean either masking or swamping of attack types.
It is imperative to highlight two important aspects of this study – the mechanics of the algorithm and the data attributes. If we knew the relevant density functions and classes of attack, we would simply observe data flows and make predictions. But in
practice we have to estimate these parameters from
“random” data and test our algorithms on another random dataset. Our contribution focused on three key parameters – data centroids, variability and proportions. For continuous attributes, these parameters typically derive from the mean and covariance matrices of the normal mixtures while for categorical data they are group proportions. Our choice of the angular order of the eigenvectors was justified by the adopted dimensional-reduction methods used as it would make multiple comparisons to be made using other eigenvalues. There are other ways of re-ordering the correlation matrix to help visualisation of the inherent patterns. This random nature of analytical studies implies that research be a function of sharing data, design, experimental setups and research findings. One way of achieving that goals is to go the way of open source repositories. We expect that this paper will contribute towards that aspiration, attain data enrichment, methods enhancements and open new paths to future studies.
References
[1] Zargari, S. & Voorhis, D., “Feature Selection in the Corrected KDD-dataset,” in Third International Conference on Emerging Intelligent Data and Web Technologies, Bucharest, 2012.
[2] Moustafa, N. & Slay, J., “UNSW-NB15: A comprehensive data set for network intrusion detection systems (UNSW-NB15 network data set),” 2015.
[3] Lee, W.; Stolfo, S. & Mok, K., “Adaptive Intrusion Detection: A Data Mining Approach,” Artificial Intelligence Review, vol. 14, no. 6, pp. 533 - 567, 2000.
[4] Noel, S.; Wijesekera, D. and Youman, C., “Modern Intrusion Detection, Data Mining, and Degrees of Attack Guilt,” in Applications of Data Mining in Computer Security: Advances in Information
Security, vol. 6, D. a. J. S. Barbara, Ed., Springer, 2002, pp. 1-31.
[5] Mwitondi, K., Moustafa, R. & Hadi, A., “MwitondA Data-Driven Method for Selecting Optimal Models Based on Graphical Visualisation of Differences in Sequentially Fitted ROC Model
Parameters,” Data Science, vol. 12, pp. WDS247-WDS253, 2013.
[6] Lee, W., Stolfo, S. J. & Mok, K. W., “A data mining framework for building intrusion detection models.,” in Lee, W., Stolfo, S. J. and Mok, K. W. (1999). A data mining framework forProceedings of the 1999 IEEE Symposium on Security and Privacy, 1999.
Applications and Probability, vol. 3, no. 2, pp. 293-305, 2013.
[8] Tsaia, C-F., Hsub, Y-F., Linc, C-Y. & Lind, W-Y., “Intrusion detection by machine learning: A review,” Expert Systems with Applications, vol. 36, no. 10, p. 11994– 12000, 2009.
[9] Wu, S. X. & Banzhaf, W., “The use of computational intelligence in intrusion detection systems: A review,” Applied Soft Computing, vol. 10, no. 1, pp. 1-35, 2010.
[10] García-Teodoro, P., Díaz-Verdejo, J., Maciá-Fernández, G. & Vázquez, E., “García-Teodoroa, P., Díaz-Verdejoa, J., Maciá-FernándeAnomaly-based network intrusion detection: Techniques,
systems and challenges.,” Computers & Security, vol. 28, no. 6-7, p. 18–28., 2009.
[11] Davis, J. J. and Clark, A. J., “Data preprocessing for anomaly based network intrusion detection: A review,” Computers & Security, vol. 30, no. 6-7, p. 353–375, 2011.
[12] Sommer, R. & Paxson, V., “Outside the Closed World: On Using Machine
Learning for Network Intrusion
Detection,” in 2010 IEEE Symposium on Security and Privacy, Berkeley, 2010.
[13] Moustafa, N. & Slay, J., “The evaluation of Network Anomaly Detection Systems: Statistical analysis of the UNSW-NB15 data set and the comparison with the KDD99 data set,” Moustafa, Nour, and Jill Slay. "The evaluation of Network Anomaly Detection Systems:
StatistiInformation Security Journal: A Global Perspective, pp. 1-14, 2016.
[14] Pearson, Karl, “On Lines and Planes of Closest Fit to Systems of Points in Space,” Philosophical Magazine, vol. II, no. 6, p. 559–572, 1901.
[15] Jones, M. C., Marron, J. S. & Sheather, S. J., “A Brief Survey of Bandwidth
Selection for Density Estimation,” Journal of the American Statistical Association, vol. 91, no. 433, pp. 401-407, 1996.