2016 SEMI-ANNUAL REPORT (UNAUDITED)
iShares, Inc.
쑺
iShares MSCI Brazil Capped ETF | EWZ | NYSE Arca
쑺
iShares MSCI Chile Capped ETF | ECH | NYSE Arca
쑺
iShares MSCI Colombia Capped ETF | ICOL | NYSE Arca
쑺
iShares MSCI Israel Capped ETF | EIS | NYSE Arca
쑺
iShares MSCI Russia Capped ETF | ERUS | NYSE Arca
쑺
iShares MSCI South Africa ETF | EZA | NYSE Arca
쑺
iShares MSCI Turkey ETF | TUR | NYSE Arca
Fund Performance Overviews . . . 5
About Fund Performance . . . 13
Shareholder Expenses . . . 13
Schedules of Investments . . . 14
iShares MSCI Brazil Capped ETF . . . 14
iShares MSCI Chile Capped ETF . . . 17
iShares MSCI Colombia Capped ETF . . . 19
iShares MSCI Israel Capped ETF . . . 21
iShares MSCI Russia Capped ETF . . . 23
iShares MSCI South Africa ETF . . . 24
iShares MSCI Turkey ETF . . . 26
iShares MSCI USA Equal Weighted ETF . . . 29
Financial Statements . . . 39
Financial Highlights . . . 49
Notes to Financial Statements . . . 57
iSHARES
®MSCI BRAZIL CAPPED ETF
Performance as of February 29, 2016
TheiShares MSCI Brazil Capped ETF (the “Fund”) seeks to track the investment results of an index composed of Brazilian equities, as represented by the MSCI Brazil 25/50 Index (the “Index”). The Fund invests in a representative sample of securities included in the Index that collectively has an investment profile similar to the Index. Due to the use of representative sampling, the Fund may or may not hold all of the securities that are included in the Index. For the six-month reporting period ended February 29, 2016, the total return for the Fund was -15.52%, net of fees, while the total return for the Index was -15.32%.
Average Annual Total Returns Cumulative Total Returns NAV MARKET INDEX NAV MARKET INDEX
1 Year (39.66)% (40.37)% (39.35)% (39.66)% (40.37)% (39.35)%
5 Years (20.21)% (20.42)% (19.83)% (67.66)% (68.09)% (66.89)%
10 Years (3.92)% (3.81)% (3.34)% (32.95)% (32.20)% (28.83)%
Index performance through February 11, 2013 reflects the performance of the MSCI Brazil Index. Index performance beginning on February 12, 2013 reflects the performance of the MSCI Brazil 25/50 Index.
Past performance is no guarantee of future results. Performance results do not reflect the deduction of taxes that a shareholder would pay on fund distributions or on the redemption or sale of fund shares. See “About Fund Performance” on page 13 for more information.
Shareholder Expenses
Actual Hypothetical 5% Return
Beginning Account Value (9/1/15) Ending Account Value (2/29/16) Expenses Paid During Perioda Beginning Account Value (9/1/15) Ending Account Value (2/29/16) Expenses Paid During Perioda Annualized Expense Ratio $ 1,000.00 $ 844.80 $ 2.94 $ 1,000.00 $ 1,021.70 $ 3.22 0.64% aExpenses are calculated using the Fund’s annualized expense ratio (as disclosed in the table), multiplied by the average account value for the period, multiplied
by the number of days in the period (182 days) and divided by the number of days in the year (366 days). See “Shareholder Expenses” on page 13 for more information. ALLOCATION BY SECTOR As of 2/29/16 Sector Percentage of Total Investments* Financials 33.48% Consumer Staples 21.40 Materials 9.79 Energy 9.05 Consumer Discretionary 6.28 Utilities 6.14 Industrials 6.13 Information Technology 4.30 Telecommunication Services 2.74 Health Care 0.69 TOTAL 100.00%
TEN LARGEST FUND HOLDINGS As of 2/29/16
Security
Percentage of Total Investments*
Ambev SA 10.96%
Itau Unibanco Holding SA (Preferred) 10.16
Banco Bradesco SA (Preferred) 7.20
BRF SA 4.31
Cielo SA 3.66
Ultrapar Participacoes SA 3.17
Itausa–Investimentos Itau SA (Preferred) 2.94 BM&FBovespa SA-Bolsa de Valores
Mercadorias e Futuros 2.91
Embraer SA 2.86
Petroleo Brasileiro SA 2.70
TOTAL 50.87%
iSHARES
®MSCI CHILE CAPPED ETF
Performance as of February 29, 2016
TheiShares MSCI Chile Capped ETF(the “Fund”) seeks to track the investment results of a broad-based index composed of Chilean equities, as represented by the MSCI Chile Investable Market Index 25/50 (the “Index”). The Fund invests in a representative sample of securities included in the Index that collectively has an investment profile similar to the Index. Due to the use of representative sampling, the Fund may or may not hold all of the securities that are included in the Index. For the six-month reporting period ended February 29, 2016, the total return for the Fund was -3.75%, net of fees, while the total return for the Index was -3.48%.
Average Annual Total Returns Cumulative Total Returns NAV MARKET INDEX NAV MARKET INDEX
1 Year (17.48)% (18.21)% (17.36)% (17.48)% (18.21)% (17.36)%
5 Years (12.35)% (12.45)% (11.72)% (48.28)% (48.56)% (46.39)%
Since Inception (3.18)% (3.23)% (2.61)% (23.50)% (23.84)% (19.71)% The inception date of the Fund was 11/12/07. The first day of secondary market trading was 11/16/07.
Index performance through February 11, 2013 reflects the performance of the MSCI Chile Investable Market Index. Index performance beginning on February 12, 2013 reflects the performance of the MSCI Chile Investable Market Index 25/50.
Past performance is no guarantee of future results. Performance results do not reflect the deduction of taxes that a shareholder would pay on fund distributions or on the redemption or sale of fund shares. See “About Fund Performance” on page 13 for more information.
Shareholder Expenses
Actual Hypothetical 5% Return
Beginning Account Value (9/1/15) Ending Account Value (2/29/16) Expenses Paid During Perioda Beginning Account Value (9/1/15) Ending Account Value (2/29/16) Expenses Paid During Perioda Annualized Expense Ratio $ 1,000.00 $ 962.50 $ 3.12 $ 1,000.00 $ 1,021.70 $ 3.22 0.64% aExpenses are calculated using the Fund’s annualized expense ratio (as disclosed in the table), multiplied by the average account value for the period, multiplied
by the number of days in the period (182 days) and divided by the number of days in the year (366 days). See “Shareholder Expenses” on page 13 for more information. ALLOCATION BY SECTOR As of 2/29/16 Sector Percentage of Total Investments* Utilities 33.08% Financials 19.34 Consumer Staples 12.49 Materials 9.96 Consumer Discretionary 8.07 Energy 7.90 Industrials 4.79 Telecommunication Services 2.38 Information Technology 1.99 TOTAL 100.00%
TEN LARGEST FUND HOLDINGS As of 2/29/16
Security
Percentage of Total Investments*
Enersis Americas SA 10.31%
Empresa Nacional de Electricidad SA/Chile 8.98
Empresas COPEC SA 7.90
SACI Falabella 6.48
Banco Santander Chile 5.85
Empresas CMPC SA 5.50
Colbun SA 4.59
Cencosud SA 4.58
Banco de Chile 4.19
Sociedad Quimica y Minera de Chile SA
Series B (Preferred) 3.88
TOTAL 62.26%
iSHARES
®MSCI COLOMBIA CAPPED ETF
Performance as of February 29, 2016
TheiShares MSCI Colombia Capped ETF(the “Fund”) seeks to track the investment results of a broad-based index composed of Colombian equities, as represented by the MSCI All Colombia Capped Index (the “Index”). The Fund invests in a representative sample of securities included in the Index that collectively has an investment profile similar to the Index. Due to the use of representative sampling, the Fund may or may not hold all of the securities that are included in the Index. For the six-month reporting period ended February 29, 2016, the total return for the Fund was -6.83%, net of fees, while the total return for the Index was -6.60%.
Average Annual Total Returns Cumulative Total Returns NAV MARKET INDEX NAV MARKET INDEX
1 Year (29.54)% (29.16)% (29.31)% (29.54)% (29.16)% (29.31)%
Since Inception (24.88)% (24.46)% (24.41)% (53.83)% (53.13)% (53.02)% The inception date of the Fund was 6/18/13. The first day of secondary market trading was 6/20/13.
Past performance is no guarantee of future results. Performance results do not reflect the deduction of taxes that a shareholder would pay on fund distributions or on the redemption or sale of fund shares. See “About Fund Performance” on page 13 for more information.
Shareholder Expenses
Actual Hypothetical 5% Return
Beginning Account Value (9/1/15) Ending Account Value (2/29/16) Expenses Paid During Perioda Beginning Account Value (9/1/15) Ending Account Value (2/29/16) Expenses Paid During Perioda Annualized Expense Ratio $ 1,000.00 $ 931.70 $ 2.93 $ 1,000.00 $ 1,021.80 $ 3.07 0.61% aExpenses are calculated using the Fund’s annualized expense ratio (as disclosed in the table), multiplied by the average account value for the period, multiplied
by the number of days in the period (182 days) and divided by the number of days in the year (366 days). See “Shareholder Expenses” on page 13 for more information. ALLOCATION BY SECTOR As of 2/29/16 Sector Percentage of Total Investments* Financials 36.31% Utilities 18.74 Materials 14.81 Energy 13.78 Consumer Staples 9.75 Industrials 4.55 Telecommunication Services 2.06 TOTAL 100.00%
TEN LARGEST FUND HOLDINGS As of 2/29/16
Security
Percentage of Total Investments*
Bancolombia SA (Preferred) 10.20%
Grupo de Inversiones Suramericana SA 8.43
Isagen SA ESP 5.80
Grupo Nutresa SA 5.21
Ecopetrol SA 5.17
Pacific Exploration and Production Corp. 5.05
Almacenes Exito SA 4.54
Interconexion Electrica SA ESP 4.52
Banco Davivienda SA (Preferred) 4.49 Empresa de Energia de Bogota SA ESP 4.36
TOTAL 57.77%
iSHARES
®MSCI ISRAEL CAPPED ETF
Performance as of February 29, 2016
TheiShares MSCI Israel Capped ETF(the “Fund”) seeks to track the investment results of a broad-based index composed of Israeli equities, as represented by the MSCI Israel Capped Investable Market Index (the “Index”). The Fund invests in a representative sample of securities included in the Index that collectively has an investment profile similar to the Index. Due to the use of representative sampling, the Fund may or may not hold all of the securities that are included in the Index. For the six-month reporting period ended February 29, 2016, the total return for the Fund was -7.97%, net of fees, while the total return for the Index was -7.53%.
Average Annual Total Returns Cumulative Total Returns NAV MARKET INDEX NAV MARKET INDEX
1 Year (1.10)% (1.89)% (0.34)% (1.10)% (1.89)% (0.34)%
5 Years (1.79)% (1.91)% (1.54)% (8.65)% (9.18)% (7.46)%
Since Inception 1.32% 1.28% 1.81% 10.93% 10.61% 15.33%
The inception date of the Fund was 3/26/08. The first day of secondary market trading was 3/28/08.
Past performance is no guarantee of future results. Performance results do not reflect the deduction of taxes that a shareholder would pay on fund distributions or on the redemption or sale of fund shares. See “About Fund Performance” on page 13 for more information.
Shareholder Expenses
Actual Hypothetical 5% Return
Beginning Account Value (9/1/15) Ending Account Value (2/29/16) Expenses Paid During Perioda Beginning Account Value (9/1/15) Ending Account Value (2/29/16) Expenses Paid During Perioda Annualized Expense Ratio $ 1,000.00 $ 920.30 $ 3.06 $ 1,000.00 $ 1,021.70 $ 3.22 0.64% aExpenses are calculated using the Fund’s annualized expense ratio (as disclosed in the table), multiplied by the average account value for the period, multiplied
by the number of days in the period (182 days) and divided by the number of days in the year (366 days). See “Shareholder Expenses” on page 13 for more information. ALLOCATION BY SECTOR As of 2/29/16 Sector Percentage of Total Investments* Financials 28.48% Health Care 23.87 Information Technology 18.94 Telecommunication Services 7.00 Industrials 6.08 Materials 5.52 Energy 4.53 Consumer Staples 3.59 Consumer Discretionary 1.45 Utilities 0.54 TOTAL 100.00%
TEN LARGEST FUND HOLDINGS As of 2/29/16
Security
Percentage of Total Investments* Teva Pharmaceutical Industries Ltd. 21.89% Check Point Software Technologies Ltd. 5.86
Bank Hapoalim BM 5.44
Bank Leumi le-Israel BM 4.93
Bezeq The Israeli Telecommunication Corp. Ltd. 4.63
NICE-Systems Ltd. 3.77 Mobileye NV 2.97 Frutarom Industries Ltd. 2.37 Elbit Systems Ltd. 2.30 Israel Chemicals Ltd. 2.28 TOTAL 56.44%
iSHARES
®MSCI RUSSIA CAPPED ETF
Performance as of February 29, 2016
TheiShares MSCI Russia Capped ETF (the “Fund”) seeks to track the investment results of an index composed of Russian equities, as represented by the MSCI Russia 25/50 Index (the “Index”). The Fund invests in a representative sample of securities included in the Index that collectively has an investment profile similar to the Index. Due to the use of representative sampling, the Fund may or may not hold all of the securities that are included in the Index. For the six-month reporting period ended February 29, 2016, the total return for the Fund was -7.07%, net of fees, while the total return for the Index was -6.43%.
Average Annual Total Returns Cumulative Total Returns NAV MARKET INDEX NAV MARKET INDEX
1 Year (13.54)% (14.25)% (12.73)% (13.54)% (14.25)% (12.73)%
5 Years (14.57)% (14.75)% (14.05)% (54.49)% (54.98)% (53.09)%
Since Inception (11.25)% (11.31)% (10.71)% (46.93)% (47.11)% (45.19)% The inception date of the Fund was 11/9/10. The first day of secondary market trading was 11/10/10.
Past performance is no guarantee of future results. Performance results do not reflect the deduction of taxes that a shareholder would pay on fund distributions or on the redemption or sale of fund shares. See “About Fund Performance” on page 13 for more information.
Shareholder Expenses
Actual Hypothetical 5% Return
Beginning Account Value (9/1/15) Ending Account Value (2/29/16) Expenses Paid During Perioda Beginning Account Value (9/1/15) Ending Account Value (2/29/16) Expenses Paid During Perioda Annualized Expense Ratio $ 1,000.00 $ 929.30 $ 3.07 $ 1,000.00 $ 1,021.70 $ 3.22 0.64% aExpenses are calculated using the Fund’s annualized expense ratio (as disclosed in the table), multiplied by the average account value for the period, multiplied
by the number of days in the period (182 days) and divided by the number of days in the year (366 days). See “Shareholder Expenses” on page 13 for more information. ALLOCATION BY SECTOR As of 2/29/16 Sector Percentage of Total Investments* Energy 51.68% Financials 18.72 Materials 11.60 Telecommunication Services 9.80 Consumer Staples 5.24 Utilities 2.96 TOTAL 100.00%
TEN LARGEST FUND HOLDINGS As of 2/29/16 Security Percentage of Total Investments* Gazprom PAO 9.54% Lukoil PJSC 7.61 Sberbank of Russia PJSC 7.61
Gazprom PAO ADR 7.08
Lukoil PJSC ADR 5.56
Magnit PJSC GDR 5.24
MMC Norilsk Nickel PJSC 4.67
Tatneft PAO Class S 4.47
Novatek OAO GDR 4.44
AK Transneft OAO (Preferred) 3.98
TOTAL 60.20%
iSHARES
®MSCI SOUTH AFRICA ETF
Performance as of February 29, 2016
TheiShares MSCI South Africa ETF(the “Fund”) seeks to track the investment results of an index composed of South African equities, as represented by the MSCI South Africa Index (the “Index”). The Fund invests in a representative sample of securities included in the Index that collectively has an investment profile similar to the Index. Due to the use of representative sampling, the Fund may or may not hold all of the securities that are included in the Index. For the six-month reporting period ended February 29, 2016, the total return for the Fund was -19.65%, net of fees, while the total return for the Index was -19.41%.
Average Annual Total Returns Cumulative Total Returns NAV MARKET INDEX NAV MARKET INDEX
1 Year (32.05)% (32.77)% (31.61)% (32.05)% (32.77)% (31.61)%
5 Years (5.61)% (5.81)% (5.02)% (25.09)% (25.85)% (22.71)%
10 Years 1.33% 1.20% 2.13% 14.13% 12.72% 23.47%
Past performance is no guarantee of future results. Performance results do not reflect the deduction of taxes that a shareholder would pay on fund distributions or on the redemption or sale of fund shares. See “About Fund Performance” on page 13 for more information.
Shareholder Expenses
Actual Hypothetical 5% Return
Beginning Account Value (9/1/15) Ending Account Value (2/29/16) Expenses Paid During Perioda Beginning Account Value (9/1/15) Ending Account Value (2/29/16) Expenses Paid During Perioda Annualized Expense Ratio $ 1,000.00 $ 803.50 $ 2.87 $ 1,000.00 $ 1,021.70 $ 3.22 0.64% aExpenses are calculated using the Fund’s annualized expense ratio (as disclosed in the table), multiplied by the average account value for the period, multiplied
by the number of days in the period (182 days) and divided by the number of days in the year (366 days). See “Shareholder Expenses” on page 13 for more information. ALLOCATION BY SECTOR As of 2/29/16 Sector Percentage of Total Investments* Consumer Discretionary 33.60% Financials 30.23 Telecommunication Services 8.12 Materials 7.81 Energy 6.89 Consumer Staples 5.30 Health Care 4.48 Industrials 3.57 TOTAL 100.00%
TEN LARGEST FUND HOLDINGS As of 2/29/16
Security
Percentage of Total Investments*
Naspers Ltd. Class N 20.98%
Steinhoff International Holdings NV Class H 6.74
Sasol Ltd. 6.60
MTN Group Ltd. 6.20
FirstRand Ltd. 4.16
Standard Bank Group Ltd. 3.70
Remgro Ltd. 3.24
Bidvest Group Ltd. (The) 3.18
Aspen Pharmacare Holdings Ltd. 2.69
Sanlam Ltd. 2.59
TOTAL 60.08%
iSHARES
®MSCI TURKEY ETF
Performance as of February 29, 2016
TheiShares MSCI Turkey ETF(the “Fund”) seeks to track the investment results of a broad-based index composed of Turkish equities, as represented by the MSCI Turkey Investable Market Index (the “Index”). The Fund invests in a representative sample of securities included in the Index that collectively has an investment profile similar to the Index. Due to the use of representative sampling, the Fund may or may not hold all of the securities that are included in the Index. For the six-month reporting period ended February 29, 2016, the total return for the Fund was -0.60%, net of fees, while the total return for the Index was -0.58%.
Average Annual Total Returns Cumulative Total Returns NAV MARKET INDEX NAV MARKET INDEX
1 Year (21.46)% (22.52)% (21.41)% (21.46)% (22.52)% (21.41)%
5 Years (6.44)% (6.75)% (6.05)% (28.32)% (29.50)% (26.81)%
Since Inception (1.53)% (1.71)% (1.16)% (11.55)% (12.76)% (8.85)% The inception date of the Fund was 3/26/08. The first day of secondary market trading was 3/28/08.
Past performance is no guarantee of future results. Performance results do not reflect the deduction of taxes that a shareholder would pay on fund distributions or on the redemption or sale of fund shares. See “About Fund Performance” on page 13 for more information.
Shareholder Expenses
Actual Hypothetical 5% Return
Beginning Account Value (9/1/15) Ending Account Value (2/29/16) Expenses Paid During Perioda Beginning Account Value (9/1/15) Ending Account Value (2/29/16) Expenses Paid During Perioda Annualized Expense Ratio $ 1,000.00 $ 994.00 $ 3.17 $ 1,000.00 $ 1,021.70 $ 3.22 0.64% aExpenses are calculated using the Fund’s annualized expense ratio (as disclosed in the table), multiplied by the average account value for the period, multiplied
by the number of days in the period (182 days) and divided by the number of days in the year (366 days). See “Shareholder Expenses” on page 13 for more information. ALLOCATION BY SECTOR As of 2/29/16 Sector Percentage of Total Investments* Financials 42.83% Industrials 14.38 Consumer Staples 13.38 Consumer Discretionary 7.71 Telecommunication Services 7.51 Materials 7.22 Energy 5.77 Utilities 1.02 Health Care 0.18 TOTAL 100.00%
TEN LARGEST FUND HOLDINGS As of 2/29/16
Security
Percentage of Total Investments*
Turkiye Garanti Bankasi AS 10.32%
Akbank TAS 9.87
BIM Birlesik Magazalar AS 7.06
Turkcell Iletisim Hizmetleri AS 5.92 Tupras Turkiye Petrol Rafinerileri AS 5.77
KOC Holding AS 4.98
Haci Omer Sabanci Holding AS 4.86
Turkiye Is Bankasi Class C 4.32
Turkiye Halk Bankasi AS 3.79
Emlak Konut Gayrimenkul Yatirim Ortakligi AS 2.97
TOTAL 59.86%
iSHARES
®MSCI USA EQUAL WEIGHTED ETF
Performance as of February 29, 2016
TheiShares MSCI USA Equal Weighted ETF(the “Fund”) seeks to track the investment results of an index composed of equal weighted U.S. equities, as represented by the MSCI USA Equal Weighted Index (the “Index”). The Fund invests in a representative sample of securities included in the Index that collectively has an investment profile similar to the Index. Due to the use of representative sampling, the Fund may or may not hold all of the securities that are included in the Index. For the six-month reporting period ended February 29, 2016, the total return for the Fund was -5.23%, net of fees, while the total return for the Index was -5.18%.
Average Annual Total Returns Cumulative Total Returns NAV MARKET INDEX NAV MARKET INDEX
1 Year (10.21)% (10.25)% (10.18)% (10.21)% (10.25)% (10.18)%
5 Years 9.08% 9.06% 9.22% 54.41% 54.27% 55.45%
Since Inception 10.52% 10.51% 10.69% 79.02% 78.93% 80.59%
The inception date of the Fund was 5/5/10. The first day of secondary market trading was 5/7/10.
Index performance through August 31, 2015 reflects the performance of the MSCI USA Index. Index performance beginning on September 1, 2015 reflects the performance of the MSCI USA Equal Weighted Index.
Past performance is no guarantee of future results. Performance results do not reflect the deduction of taxes that a shareholder would pay on fund distributions or on the redemption or sale of fund shares. See “About Fund Performance” on page 13 for more information.
Shareholder Expenses
Actual Hypothetical 5% Return
Beginning Account Value (9/1/15) Ending Account Value (2/29/16) Expenses Paid During Perioda Beginning Account Value (9/1/15) Ending Account Value (2/29/16) Expenses Paid During Perioda Annualized Expense Ratio $ 1,000.00 $ 947.70 $ 0.73 $ 1,000.00 $ 1,024.10 $ 0.75 0.15% aExpenses are calculated using the Fund’s annualized expense ratio (as disclosed in the table), multiplied by the average account value for the period, multiplied
by the number of days in the period (182 days) and divided by the number of days in the year (366 days). See “Shareholder Expenses” on page 13 for more information. ALLOCATION BY SECTOR As of 2/29/16 Sector Percentage of Total Investments* Financials 19.24% Consumer Discretionary 16.71 Information Technology 14.89 Industrials 12.12 Health Care 11.33 Energy 7.04 Consumer Staples 6.64 Materials 5.55 Utilities 5.16 Telecommunication Services 1.32 TOTAL 100.00%
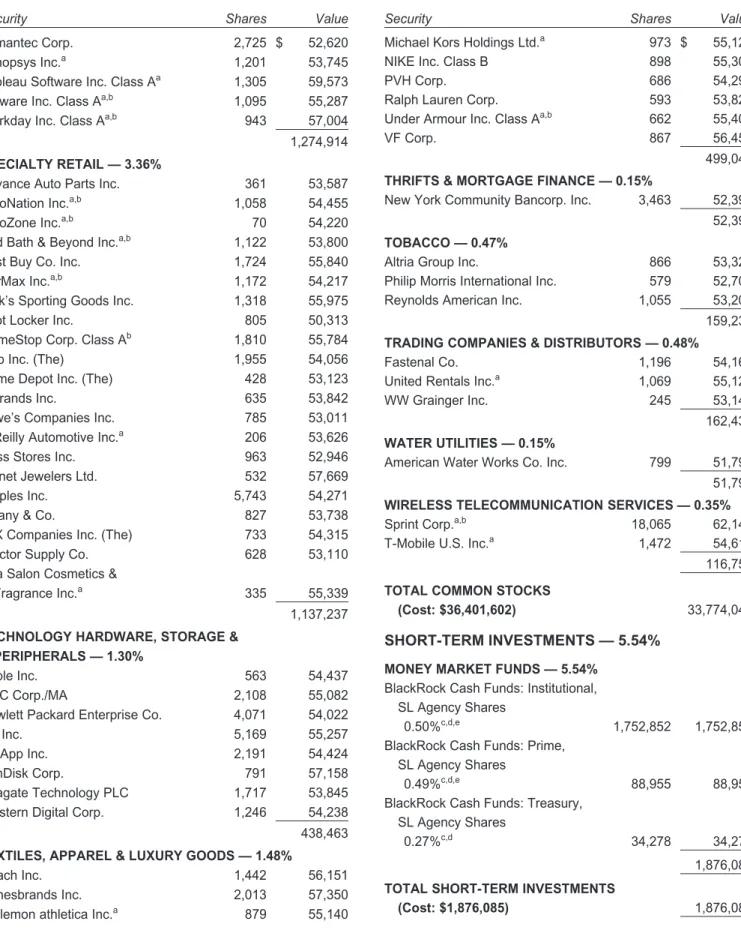
TEN LARGEST FUND HOLDINGS As of 2/29/16
Security
Percentage of Total Investments*
DENTSPLY International Inc. 0.29%
Continental Resources Inc./OK 0.20
Splunk Inc. 0.20
Cheniere Energy Inc. 0.19
Marathon Oil Corp. 0.18
Sprint Corp. 0.18
Medivation Inc. 0.18
Palo Alto Networks Inc. 0.18
CF Industries Holdings Inc. 0.18
ONEOK Inc. 0.18
TOTAL 1.96%
Past performance is no guarantee of future results. Current performance may be lower or higher than the performance data quoted. Performance data current to the most recent month-end is available at www.ishares.com. Performance results assume reinvestment of all dividends and capital gain distributions and do not reflect the deduction of taxes that a shareholder would pay on fund distributions or on the redemption or sale of fund shares. The investment return and principal value of shares will vary with changes in market conditions. Shares may be worth more or less than their original cost when they are redeemed or sold in the market. Performance for certain funds may reflect a waiver of a portion of investment advisory fees. Without such a waiver, performance would have been lower.
Net asset value or “NAV” is the value of one share of a fund as calculated in accordance with the standard formula for valuing mutual fund shares. The price used to calculate market return (“Market Price”) is determined by using the midpoint between the highest bid and the lowest offer on the primary stock exchange on which shares of a fund are listed for trading, as of the time that such fund’s NAV is calculated. Certain funds may have a NAV which is determined prior to the opening of regular trading on its listed exchange and their market returns are calculated using the midpoint of the bid/ask spread as of the opening of regular trading on the exchange. Market and NAV returns assume that dividends and capital gain distributions have been reinvested at Market Price and NAV, respectively.
An index is a statistical composite that tracks a specified financial market or sector. Unlike a fund, an index does not actually hold a portfolio of securities and therefore does not incur the expenses incurred by a fund. These expenses negatively impact fund performance. Also, market returns do not include brokerage commissions that may be payable on secondary market transactions. If brokerage commissions were included, market returns would be lower.
Shareholder Expenses
As a shareholder of a Fund, you incur two types of costs: (1) transaction costs, including brokerage commissions on purchases and sales of fund shares and (2) ongoing costs, including management fees and other fund expenses. The expense example, which is based on an investment of $1,000 invested on September 1, 2015 and held through February 29, 2016, is intended to help you understand your ongoing costs (in dollars and cents) of investing in a Fund and to compare these costs with the ongoing costs of investing in other funds.
Actual Expenses — The table provides information about actual account values and actual expenses. Annualized expense ratios reflect contractual and voluntary fee waivers, if any. To estimate the expenses that you paid on your account over the period, simply divide your account value by $1,000 (for example, an $8,600 account value divided by $1,000 = 8.6), then multiply the result by the number corresponding to your Fund under the heading entitled “Expenses Paid During Period.”
Hypothetical Example for Comparison Purposes— The table also provides information about hypothetical account values and hypothetical expenses based on each Fund’s actual expense ratio and an assumed rate of return of 5% per year before expenses. You may use this information to compare the ongoing costs of investing in your Fund and other funds. To do so, compare this 5% hypothetical example with the 5% hypothetical examples that appear in the shareholder reports of the other funds.
Please note that the expenses shown in the table are meant to highlight your ongoing costs only and do not reflect any transactional costs, such as brokerage commissions paid on purchases and sales of fund shares. Therefore, the hypothetical examples are useful in comparing ongoing costs only and will not help you determine the relative total costs of owning different funds. In addition, if these transactional costs were included, your costs would have been higher.
iSHARES
®MSCI BRAZIL CAPPED ETF
February 29, 2016
Security Shares Value
COMMON STOCKS — 66.18%
AEROSPACE & DEFENSE — 2.83%
Embraer SA 6,812,232 $ 51,699,899
51,699,899
BANKS — 4.39%
Banco Bradesco SA 6,544,164 38,268,714
Banco do Brasil SA 7,628,097 25,955,428 Banco Santander Brasil SA Units 4,276,900 16,068,066 80,292,208 BEVERAGES — 10.83% Ambev SA 44,678,860 198,058,726 198,058,726 CAPITAL MARKETS — 1.22% CETIP SA – Mercados Organizados 2,332,203 22,212,573 22,212,573
CONTAINERS & PACKAGING — 1.52%
Klabin SA Units 5,129,020 27,711,892
27,711,892
DIVERSIFIED CONSUMER SERVICES — 2.45%
Estacio Participacoes SA 3,216,800 10,314,972 Kroton Educacional SA 13,737,964 34,419,999 44,734,971
DIVERSIFIED FINANCIAL SERVICES — 2.88%
BM&FBovespa SA-Bolsa de
Valores Mercadorias e Futuros 18,001,300 52,565,805 52,565,805
ELECTRIC UTILITIES — 2.11%
CPFL Energia SAa 2,795,531 11,732,055
EDP – Energias do Brasil SA 3,372,800 10,789,773 Equatorial Energia SA 1,000,900 9,630,955 Transmissora Alianca de Energia
Eletrica SA Units 1,358,200 6,437,226
38,590,009
FOOD & STAPLES RETAILING — 1.55%
Raia Drogasil SA 2,453,900 28,372,814 28,372,814 FOOD PRODUCTS — 5.88% BRF SA 6,025,050 77,824,635 JBS SA 7,954,222 22,787,458 M. Dias Branco SA 434,300 6,923,829 107,535,922
Security Shares Value
HEALTH CARE PROVIDERS & SERVICES — 0.68%
Odontoprev SA 1,995,100 $ 5,088,901
Qualicorp SA 2,291,400 7,416,690
12,505,591
INDEPENDENT POWER AND RENEWABLE ELECTRICITY PRODUCERS — 0.91% Tractebel Energia SA 1,881,400 16,689,724 16,689,724 INSURANCE — 3.04% BB Seguridade Participacoes SA 6,204,900 37,610,180 Porto Seguro SA 1,428,600 8,483,356 Sul America SA 2,357,950 9,510,491 55,604,027
INTERNET & CATALOG RETAIL — 0.22%
B2W Cia. Digitala 1,394,200 4,046,694 4,046,694 IT SERVICES — 3.62% Cielo SA 8,488,196 66,147,050 66,147,050 MACHINERY — 1.10% WEG SA 6,092,160 20,193,398 20,193,398
METALS & MINING — 2.32%
Cia. Siderurgica Nacional SA 8,279,254 10,819,018
Vale SA 10,659,400 31,635,593 42,454,611 MULTILINE RETAIL — 2.06% Lojas Americanas SA 2,305,950 6,959,631 Lojas Renner SA 6,793,100 30,727,967 37,687,598
OIL, GAS & CONSUMABLE FUELS — 6.37%
Cosan SA Industria e Comercio 1,512,390 10,166,721 Petroleo Brasileiro SAa 26,458,544 48,870,479
Ultrapar Participacoes SA 3,630,900 57,347,289 116,384,489
PAPER & FOREST PRODUCTS — 1.82%
Duratex SA 2,312,311 3,532,996 Fibria Celulose SA 2,682,226 29,657,966 33,190,962 PERSONAL PRODUCTS — 2.07% Hypermarcas SAa 3,914,800 24,791,536 Natura Cosmeticos SA 1,962,200 13,106,646
iSHARES
®MSCI BRAZIL CAPPED ETF
February 29, 2016
Security Shares Value
REAL ESTATE MANAGEMENT & DEVELOPMENT — 1.50%
BR Malls Participacoes SA 4,735,900 $ 16,019,203 Multiplan Empreendimentos
Imobiliarios SA 969,600 11,454,501
27,473,704
ROAD & RAIL — 0.55%
Localiza Rent A Car SA 1,731,940 10,006,107 10,006,107 SOFTWARE — 0.64% TOTVS SA 1,473,400 11,663,383 11,663,383 TRANSPORTATION INFRASTRUCTURE — 1.58% CCR SA 9,124,100 28,959,210 28,959,210 WATER UTILITIES — 1.18%
Cia. de Saneamento Basico do
Estado de Sao Paulo 3,809,400 21,644,645 21,644,645
WIRELESS TELECOMMUNICATION SERVICES — 0.86%
TIM Participacoes SA 8,952,490 15,635,867 15,635,867
TOTAL COMMON STOCKS
(Cost: $1,209,269,299) 1,209,960,061
PREFERRED STOCKS — 32.69%
BANKS — 20.07%
Banco Bradesco SA 24,275,523 130,183,615 Itau Unibanco Holding SA 28,776,062 183,678,530 Itausa-Investimentos Itau SA 31,029,752 53,180,939 367,043,084
CHEMICALS — 0.71%
Braskem SA Class A 2,026,536 12,986,371 12,986,371
DIVERSIFIED TELECOMMUNICATION SERVICES — 1.86%
Telefonica Brasil SA 3,537,374 33,957,653 33,957,653
ELECTRIC UTILITIES — 1.46%
Centrais Eletricas Brasileiras SA
Class B 3,044,651 7,475,244
Cia. Energetica de Minas Gerais 7,913,090 11,672,867 Cia. Paranaense de Energia
Class B 1,293,400 7,517,991
26,666,102
Security Shares Value
FOOD & STAPLES RETAILING — 0.82%
Cia. Brasileira de Distribuicao 1,431,064 $ 14,953,294 14,953,294
INDEPENDENT POWER AND RENEWABLE ELECTRICITY PRODUCERS — 0.40%
Cia. Energetica de Sao Paulo
Class B 2,139,670 7,312,721
7,312,721
METALS & MINING — 2.39%
Gerdau SA 9,274,046 8,226,920 Vale SA 16,526,300 35,550,255 43,777,175 MULTILINE RETAIL — 1.48% Lojas Americanas SA 5,406,106 27,021,699 27,021,699
OIL, GAS & CONSUMABLE FUELS — 2.58%
Petroleo Brasileiro SA 36,540,878 47,199,285 47,199,285
PAPER & FOREST PRODUCTS — 0.92%
Suzano Papel e Celulose SA
Class A 4,048,900 16,788,593
16,788,593
TOTAL PREFERRED STOCKS
(Cost: $761,241,178) 597,705,977
RIGHTS — 0.00%
PAPER & FOREST PRODUCTS — 0.00%
Duratex SAa 91,431 60,428
60,428
TOTAL RIGHTS
(Cost: $0) 60,428
SHORT-TERM INVESTMENTS — 0.00%
MONEY MARKET FUNDS — 0.00%
BlackRock Cash Funds: Treasury, SL Agency Shares
0.27%b,c 34,520 34,520
34,520
TOTAL SHORT-TERM INVESTMENTS
iSHARES
®MSCI BRAZIL CAPPED ETF
February 29, 2016 Value TOTAL INVESTMENTS IN SECURITIES — 98.87% (Cost: $1,970,544,997) $1,807,760,986Other Assets, Less Liabilities — 1.13% 20,667,448
NET ASSETS — 100.00% $1,828,428,434
aNon-income earning security. bAffiliated issuer. See Note 2.
c The rate quoted is the annualized seven-day yield of the fund at period end.
iSHARES
®MSCI CHILE CAPPED ETF
February 29, 2016
Security Shares Value
COMMON STOCKS — 93.14%
AIRLINES — 3.83%
LATAM Airlines Group SAa 1,646,154 $ 9,380,128
9,380,128
BANKS — 16.00%
Banco de Chile 100,065,504 10,253,528
Banco de Credito e Inversiones 187,629 7,550,795 Banco Santander Chile 329,853,201 14,312,548
CorpBanca SA 859,159,975 7,075,071
39,191,942
BEVERAGES — 5.15%
Cia. Cervecerias Unidas SA 824,642 8,115,754 Vina Concha y Toro SA 2,681,703 4,493,112 12,608,866
CONSTRUCTION & ENGINEERING — 0.58%
SalfaCorp SA 2,645,417 1,415,128
1,415,128
DIVERSIFIED FINANCIAL SERVICES — 1.08%
Inversiones La Construccion SA 236,753 2,647,470 2,647,470 ELECTRIC UTILITIES — 12.21% E.CL SA 3,112,147 4,721,631 Enersis Americas SA 99,492,906 25,192,174 29,913,805
FOOD & STAPLES RETAILING — 4.57%
Cencosud SA 5,132,914 11,197,339
11,197,339
INDEPENDENT POWER AND RENEWABLE ELECTRICITY PRODUCERS — 16.18% AES Gener SA 14,329,498 6,447,604 Colbun SA 43,212,501 11,226,481 Empresa Nacional de Electricidad SA/Chile 16,570,440 21,954,015 39,628,100 IT SERVICES — 1.99% SONDA SA 2,826,503 4,878,092 4,878,092 MARINE — 0.38%
Cia. Sud Americana de
Vapores SAa 46,796,362 925,354
925,354
Security Shares Value
METALS & MINING — 0.58%
CAP SA 587,301 $ 1,423,097 1,423,097 MULTILINE RETAIL — 7.36% Ripley Corp. SA 5,359,172 2,197,580 SACI Falabella 2,437,078 15,831,099 18,028,679
OIL, GAS & CONSUMABLE FUELS — 7.88%
Empresas COPEC SA 2,282,102 19,299,912
19,299,912
PAPER & FOREST PRODUCTS — 5.48%
Empresas CMPC SA 5,844,004 13,439,065
13,439,065
REAL ESTATE MANAGEMENT & DEVELOPMENT — 2.19%
Parque Arauco SA 3,267,037 5,369,441
5,369,441
TEXTILES, APPAREL & LUXURY GOODS — 0.69%
Forus SA 690,993 1,690,564
1,690,564
WATER UTILITIES — 4.61%
Aguas Andinas SA Series A 14,738,112 7,680,108 Inversiones Aguas
Metropolitanas SA 2,497,671 3,625,101
11,305,209
WIRELESS TELECOMMUNICATION SERVICES — 2.38%
Empresa Nacional de
Telecomunicaciones SA 683,028 5,825,471 5,825,471
TOTAL COMMON STOCKS
(Cost: $210,047,506) 228,167,662
PREFERRED STOCKS — 6.61%
BEVERAGES — 2.74% Coca-Cola Embonor SA 1,403,084 2,180,803 Embotelladora Andina SA Class B 1,520,566 4,531,827 6,712,630 CHEMICALS — 3.87%Sociedad Quimica y Minera de
Chile SA Series B 529,384 9,473,067
9,473,067
TOTAL PREFERRED STOCKS
iSHARES
®MSCI CHILE CAPPED ETF
February 29, 2016
Security Shares Value
RIGHTS — 0.02%
REAL ESTATE MANAGEMENT & DEVELOPMENT — 0.02%
Parque Arauco SAa 262,259 $ 52,840
52,840
TOTAL RIGHTS
(Cost: $0) 52,840
SHORT-TERM INVESTMENTS — 0.26%
MONEY MARKET FUNDS — 0.26%
BlackRock Cash Funds: Treasury, SL Agency Shares
0.27%b,c 627,776 627,776
627,776
TOTAL SHORT-TERM INVESTMENTS
(Cost: $627,776) 627,776
TOTAL INVESTMENTS IN SECURITIES — 100.03%
(Cost: $226,544,153) 245,033,975
Other Assets, Less Liabilities — (0.03)% (73,814)
NET ASSETS — 100.00% $244,960,161
aNon-income earning security. bAffiliated issuer. See Note 2.
c The rate quoted is the annualized seven-day yield of the fund at period end.
iSHARES
®MSCI COLOMBIA CAPPED ETF
February 29, 2016
Security Shares Value
COMMON STOCKS — 76.73%
BANKS — 4.87%
Banco de Bogota SA 5,256 $ 89,949
Bancolombia SA 95,790 686,889
Grupo Aval Acciones y Valores SA 162,487 54,586 831,424
CONSTRUCTION & ENGINEERING — 1.59%
Construcciones El Condor SA 223,882 73,188 Constructora Conconcreto SA 650,497 198,930 272,118
CONSTRUCTION MATERIALS — 11.47%
Cementos Argos SA 167,710 520,458
Cemex Latam Holdings SAa 222,425 718,402
Grupo Argos SA/Colombia 133,300 718,907 1,957,767
DIVERSIFIED FINANCIAL SERVICES — 12.16%
Bolsa de Valores de Colombia 61,903,125 339,448 Corp. Financiera Colombiana
SA Newa 186 2,059 Corp. Financiera Colombiana SA/CD 24,928 283,602 Grupo de Inversiones Suramericana SA 127,255 1,449,293 2,074,402
DIVERSIFIED TELECOMMUNICATION SERVICES — 2.08%
Empresa de Telecomunicaciones
de Bogota 2,030,345 354,191
354,191
ELECTRIC UTILITIES — 14.48%
Celsia SA ESP 629,393 697,845
Interconexion Electrica SA ESP 332,289 775,903
Isagen SA ESP 827,235 996,961
2,470,709
FOOD & STAPLES RETAILING — 4.57%
Almacenes Exito SA 182,466 780,656 780,656 FOOD PRODUCTS — 5.24% Grupo Nutresa SA 122,357 894,353 894,353 GAS UTILITIES — 4.39%
Empresa de Energia de Bogota
SA ESP 1,402,440 750,019
750,019
Security Shares Value
METALS & MINING — 2.00%
Mineros SA 488,591 $ 340,789
340,789
OIL, GAS & CONSUMABLE FUELS — 13.88%
Canacol Energy Ltd.a 253,393 611,690
Ecopetrol SA 2,585,524 888,061
Pacific Exploration and
Production Corp.a,b 884,430 868,369
2,368,120
TOTAL COMMON STOCKS
(Cost: $17,582,530) 13,094,548
PREFERRED STOCKS — 23.96%
AIRLINES — 2.99% Avianca Holdings SA 842,611 510,285 510,285 BANKS — 17.28% Banco Davivienda SA 102,021 770,915 Bancolombia SA 235,135 1,752,696Grupo Aval Acciones y Valores SA 1,258,693 424,744 2,948,355
CONSTRUCTION MATERIALS — 1.44%
Cementos Argos SA 37,076 108,915
Grupo Argos SA/Colombia 26,784 136,380
245,295
DIVERSIFIED FINANCIAL SERVICES — 2.25%
Grupo de Inversiones
Suramericana SA 34,038 384,578
384,578
TOTAL PREFERRED STOCKS
(Cost: $5,439,034) 4,088,513
SHORT-TERM INVESTMENTS — 1.98%
MONEY MARKET FUNDS — 1.98%
BlackRock Cash Funds: Institutional, SL Agency Shares
0.50%c,d,e 305,474 305,474
BlackRock Cash Funds: Prime, SL Agency Shares
iSHARES
®MSCI COLOMBIA CAPPED ETF
February 29, 2016
Security Shares Value
BlackRock Cash Funds: Treasury, SL Agency Shares
0.27%c,d 15,985 $ 15,985
336,962
TOTAL SHORT-TERM INVESTMENTS
(Cost: $336,962) 336,962
TOTAL INVESTMENTS IN SECURITIES — 102.67%
(Cost: $23,358,526) 17,520,023
Other Assets, Less Liabilities — (2.67)% (455,235)
NET ASSETS — 100.00% $17,064,788
aNon-income earning security.
bAll or a portion of this security represents a security on loan. See Note 1. c Affiliated issuer. See Note 2.
dThe rate quoted is the annualized seven-day yield of the fund at period end. eAll or a portion of this security represents an investment of securities lending
collateral. See Note 1.
iSHARES
®MSCI ISRAEL CAPPED ETF
February 29, 2016
Security Shares Value
COMMON STOCKS — 99.75%
AEROSPACE & DEFENSE — 2.29%
Elbit Systems Ltd. 32,286 $ 2,682,433
2,682,433
BANKS — 15.19%
Bank Hapoalim BM 1,295,561 6,348,153
Bank Leumi le-Israel BMa 1,719,655 5,751,134 First International Bank of
Israel Ltd. 95,000 1,096,051
Israel Discount Bank Ltd. Class Aa 1,466,573 2,360,287
Mizrahi Tefahot Bank Ltd. 200,234 2,214,730 17,770,355 BUILDING PRODUCTS — 0.88% Caesarstone Sdot-Yam Ltd.a 27,779 1,030,045 1,030,045 CHEMICALS — 5.51% Frutarom Industries Ltd. 53,499 2,766,741 Israel Chemicals Ltd. 688,228 2,663,244 Israel Corp. Ltd. (The) 7,115 1,014,162 6,444,147
COMMUNICATIONS EQUIPMENT — 1.31%
Ituran Location and Control Ltd.b 44,171 752,314
Radware Ltd.a 68,196 784,936
1,537,250
CONSTRUCTION & ENGINEERING — 1.93%
Electra Ltd./Israel 6,227 780,190
Shapir Engineering and
Industry Ltd. 407,868 644,712
Shikun & Binui Ltd.b 568,584 827,646 2,252,548
DIVERSIFIED TELECOMMUNICATION SERVICES — 5.35%
B Communications Ltd. 31,035 855,787
Bezeq The Israeli
Telecommunication Corp. Ltd. 2,408,275 5,406,445 6,262,232
ELECTRONIC EQUIPMENT, INSTRUMENTS & COMPONENTS — 0.91%
Orbotech Ltd.a 46,757 1,059,046
1,059,046
FOOD & STAPLES RETAILING — 1.41%
Rami Levy Chain Stores Hashikma
Marketing 2006 Ltd. 18,133 817,404
Security Shares Value
Shufersal Ltd.a 256,809 $ 837,800 1,655,204 FOOD PRODUCTS — 2.17% Osem Investments Ltd.b 66,766 1,379,088 Strauss Group Ltd.b 85,091 1,157,705 2,536,793
INDEPENDENT POWER AND RENEWABLE ELECTRICITY PRODUCERS — 0.54%
Kenon Holdings Ltd./Singaporea,b 78,017 630,798
630,798
INSURANCE — 3.96%
Clal Insurance Enterprises
Holdings Ltd.a 65,167 729,812
Harel Insurance Investments &
Financial Services Ltd.b 261,623 891,051
IDI Insurance Co. Ltd. 16,842 833,014
Menorah Mivtachim Holdings Ltd.a 89,602 731,815 Migdal Insurance & Financial
Holding Ltd.b 1,261,310 795,167
Phoenix Holdings Ltd. (The)a 285,932 651,940
4,632,799
INTERNET SOFTWARE & SERVICES — 0.67%
Wix.com Ltd.a 40,645 781,603 781,603 IT SERVICES — 0.64% Matrix IT Ltd.b 130,199 753,080 753,080 MACHINERY — 0.97% Kornit Digital Ltd.a 49,307 571,961 Plasson Industries Ltd. 23,640 562,269 1,134,230
OIL, GAS & CONSUMABLE FUELS — 4.52%
Delek Group Ltd. 8,383 1,345,285
Jerusalem Oil Explorationa 23,251 905,721
Naphtha Israel Petroleum
Corp. Ltd.a 147,597 704,678
Oil Refineries Ltd.a,b 2,533,733 964,248
Paz Oil Co. Ltd. 9,000 1,367,494
5,287,426
PHARMACEUTICALS — 23.80%
Neuroderm Ltd.a 46,257 563,410
Taro Pharmaceutical
iSHARES
®MSCI ISRAEL CAPPED ETF
February 29, 2016
Security Shares Value
Teva Pharmaceutical
Industries Ltd. 452,283 $ 25,546,033
27,847,833
REAL ESTATE INVESTMENT TRUSTS (REITS) — 0.83%
REIT 1 Ltd. 373,117 965,757
965,757
REAL ESTATE MANAGEMENT & DEVELOPMENT — 8.43%
Africa Israel Properties Ltd. 55,208 695,807 Airport City Ltd.a,b 126,005 1,185,420
Alony Hetz Properties &
Investments Ltd. 169,485 1,220,070
Amot Investments Ltd. 280,418 916,258
Azrieli Group Ltd. 54,350 1,975,047
Bayside Land Corp. 2,472 803,284
Gazit-Globe Ltd.b 167,532 1,316,350
Melisron Ltd. 32,599 1,063,481
Norstar Holdings Inc. 55,491 686,154
9,861,871
SEMICONDUCTORS & SEMICONDUCTOR EQUIPMENT — 1.31%
Tower Semiconductor Ltd.a,b 113,006 1,535,181 1,535,181
SOFTWARE — 14.05%
Check Point Software
Technologies Ltd.a,b 82,300 6,836,661
CyberArk Software Ltd.a,b 23,584 883,692
Mobileye NVa,b 106,591 3,459,944
NICE-Systems Ltd. 72,648 4,395,631
Sapiens International Corp. NV 73,198 857,269 16,433,197
SPECIALTY RETAIL — 0.79%
Delek Automotive Systems Ltd. 99,269 924,231 924,231
TEXTILES, APPAREL & LUXURY GOODS — 0.66%
Delta-Galil Industries Ltd.b 30,385 771,286
771,286
WIRELESS TELECOMMUNICATION SERVICES — 1.63%
Cellcom Israel Ltd.a 151,740 915,394
Partner Communications Co. Ltd.a 211,202 988,868 1,904,262
TOTAL COMMON STOCKS
(Cost: $136,776,284) 116,693,607
Security Shares Value
SHORT-TERM INVESTMENTS — 13.67%
MONEY MARKET FUNDS — 13.67%
BlackRock Cash Funds: Institutional, SL Agency Shares
0.50%c,d,e 15,166,772 $ 15,166,772
BlackRock Cash Funds: Prime, SL Agency Shares
0.49%c,d,e 769,696 769,696
BlackRock Cash Funds: Treasury, SL Agency Shares
0.27%c,d 51,165 51,165
15,987,633
TOTAL SHORT-TERM INVESTMENTS
(Cost: $15,987,633) 15,987,633
TOTAL INVESTMENTS IN SECURITIES — 113.42%
(Cost: $152,763,917) 132,681,240
Other Assets, Less Liabilities — (13.42)% (15,694,223)
NET ASSETS — 100.00% $116,987,017
aNon-income earning security.
bAll or a portion of this security represents a security on loan. See Note 1. c Affiliated issuer. See Note 2.
dThe rate quoted is the annualized seven-day yield of the fund at period end. eAll or a portion of this security represents an investment of securities lending
collateral. See Note 1.
iSHARES
®MSCI RUSSIA CAPPED ETF
February 29, 2016
Security Shares Value
COMMON STOCKS — 93.75%
BANKS — 15.34%
Sberbank of Russia PJSC 11,591,520 $ 16,532,360 Sberbank of Russia PJSC ADR 1,140,425 6,993,086
VTB Bank PJSC 7,767,195,000 7,586,774
VTB Bank PJSC GDRa 1,169,379 2,198,432 33,310,652
DIVERSIFIED FINANCIAL SERVICES — 3.39%
Moscow Exchange
MICEX-RTS PJSC 5,615,820 7,371,203
7,371,203
DIVERSIFIED TELECOMMUNICATION SERVICES — 2.77%
Rostelecom PJSC 5,122,650 6,007,803
6,007,803
ELECTRIC UTILITIES — 2.97%
RusHydro PJSC 721,834,000 6,444,676
6,444,676
FOOD & STAPLES RETAILING — 5.25%
Magnit PJSC GDRa 340,208 11,396,968
11,396,968
METALS & MINING — 11.61%
Alrosa PAO 8,553,300 7,920,360
MMC Norilsk Nickel PJSC 83,843 10,144,756
Severstal PAO 847,635 7,147,667
25,212,783
OIL, GAS & CONSUMABLE FUELS — 45.38%
Gazprom PAO ADR 4,175,191 15,379,316
Gazprom PAO 11,027,127 20,745,528 Lukoil PJSC 462,588 16,535,717 Lukoil PJSC ADR 340,726 12,095,773 Novatek OAO GDRa 111,652 9,657,898 Rosneft OAO 1,363,360 5,198,682 Rosneft OAO GDRa 1,240,554 4,673,167 Surgutneftegas OAO 4,816,100 2,522,186
Surgutneftegas OAO ADR 393,556 2,020,910 Tatneft PAO Class S 2,276,685 9,715,855 98,545,032
WIRELESS TELECOMMUNICATION SERVICES — 7.04%
MegaFon PJSC GDRa 503,248 5,913,164
Mobile TeleSystems PJSC ADR 1,021,067 7,147,469
Security Shares Value
Sistema JSFC GDRa 399,825 $ 2,223,027
15,283,660
TOTAL COMMON STOCKS
(Cost: $325,648,284) 203,572,777
PREFERRED STOCKS — 6.36%
OIL, GAS & CONSUMABLE FUELS — 6.36%
AK Transneft OAO 3,659 8,649,778
Surgutneftegas OAO 8,769,200 5,153,325
13,803,103
TOTAL PREFERRED STOCKS
(Cost: $14,638,667) 13,803,103
SHORT-TERM INVESTMENTS — 0.10%
MONEY MARKET FUNDS — 0.10%
BlackRock Cash Funds: Treasury, SL Agency Shares
0.27%b,c 215,365 215,365
215,365
TOTAL SHORT-TERM INVESTMENTS
(Cost: $215,365) 215,365
TOTAL INVESTMENTS IN SECURITIES — 100.21%
(Cost: $340,502,316) 217,591,245
Other Assets, Less Liabilities — (0.21)% (461,655)
NET ASSETS — 100.00% $217,129,590 ADR — American Depositary Receipts
GDR — Global Depositary Receipts
aThis security may be resold to qualified foreign investors and foreign institutional buyers under Regulation S of the Securities Act of 1933. bAffiliated issuer. See Note 2.
c The rate quoted is the annualized seven-day yield of the fund at period end.
iSHARES
®MSCI SOUTH AFRICA ETF
February 29, 2016
Security Shares Value
COMMON STOCKS — 99.78%
BANKS — 6.44%
African Bank Investments Ltd.a,b 2,626,522 $ 1,664
Barclays Africa Group Ltd. 439,472 3,786,416 Capitec Bank Holdings Ltd.b 44,952 1,349,850
Nedbank Group Ltd. 256,296 2,957,530
Standard Bank Group Ltd. 1,572,546 10,877,883 18,973,343
CAPITAL MARKETS — 2.56%
Brait SEa,b 438,560 4,284,496
Coronation Fund Managers Ltd. 294,670 1,178,314
Investec Ltd. 320,942 2,094,828
7,557,638
DISTRIBUTORS — 0.61%
Imperial Holdings Ltd. 236,545 1,801,260 1,801,260
DIVERSIFIED FINANCIAL SERVICES — 8.94%
FirstRand Ltd. 4,361,905 12,249,887
PSG Group Ltd. 114,964 1,265,013
Remgro Ltd. 623,498 9,522,970
RMB Holdings Ltd. 914,762 3,317,736
26,355,606
DIVERSIFIED TELECOMMUNICATION SERVICES — 0.36%
Telkom SA SOC Ltd. 307,306 1,050,902
1,050,902
FOOD & STAPLES RETAILING — 3.49%
Massmart Holdings Ltd. 140,710 952,395
Pick n Pay Stores Ltd. 316,471 1,129,559 Shoprite Holdings Ltd. 593,936 5,803,564 SPAR Group Ltd. (The) 213,299 2,414,206 10,299,724
FOOD PRODUCTS — 1.79%
Pioneer Foods Group Ltd. 165,929 1,366,755
Tiger Brands Ltd. 211,574 3,918,399
5,285,154
HEALTH CARE PROVIDERS & SERVICES — 1.79%
Life Healthcare Group Holdings Ltd. 1,243,962 2,763,764
Netcare Ltd. 1,227,465 2,514,045
5,277,809
HOTELS, RESTAURANTS & LEISURE — 0.22%
Tsogo Sun Holdings Ltd. 475,759 638,971 638,971
Security Shares Value
HOUSEHOLD DURABLES — 6.73%
Steinhoff International Holdings NV
Class H 3,695,950 $ 19,832,052
19,832,052
INDUSTRIAL CONGLOMERATES — 3.17%
Bidvest Group Ltd. (The) 412,933 9,346,707 9,346,707
INSURANCE — 5.56%
Discovery Ltd. 461,465 3,334,789
Liberty Holdings Ltd. 148,358 1,156,138 MMI Holdings Ltd./South Africa 1,426,053 2,109,506 Rand Merchant Investment
Holdings Ltd. 866,322 2,166,779 Sanlam Ltd. 2,246,202 7,613,086 16,380,298 MEDIA — 20.93% Naspers Ltd. Class N 516,663 61,692,277 61,692,277
METALS & MINING — 5.89%
Anglo American Platinum Ltd.a 69,905 1,449,879 AngloGold Ashanti Ltd.a 525,173 6,795,852
Gold Fields Ltd. 1,008,450 4,187,793
Impala Platinum Holdings Ltd.a 809,484 1,715,902
Sibanye Gold Ltd. 886,067 3,200,190 17,349,616 MULTILINE RETAIL — 2.23% Woolworths Holdings Ltd./ South Africa 1,283,363 6,568,486 6,568,486
OIL, GAS & CONSUMABLE FUELS — 6.87%
Exxaro Resources Ltd.b 185,665 849,230
Sasol Ltd. 717,524 19,416,227
20,265,457
PAPER & FOREST PRODUCTS — 1.91%
Mondi Ltd. 153,327 2,755,630
Sappi Ltd.a 701,686 2,872,552
5,628,182
PHARMACEUTICALS — 2.68%
Aspen Pharmacare Holdings Ltd. 443,572 7,901,730 7,901,730
REAL ESTATE INVESTMENT TRUSTS (REITS) — 5.56%
Fortress Income Fund Ltd. 891,604 1,855,520 Fortress Income Fund Ltd. Class A 1,234,343 1,173,748
iSHARES
®MSCI SOUTH AFRICA ETF
February 29, 2016
Security Shares Value
Growthpoint Properties Ltd. 3,008,608 $ 4,610,623 Hyprop Investments Ltd. 315,223 2,077,469 Redefine Properties Ltd. 5,751,183 3,749,132
Resilient REIT Ltd. 375,200 2,923,655
16,390,147
REAL ESTATE MANAGEMENT & DEVELOPMENT — 1.10%
New Europe Property
Investments PLC 290,203 3,250,441
3,250,441
SPECIALTY RETAIL — 2.81%
Foschini Group Ltd. (The) 269,648 1,994,742
Mr. Price Group Ltd. 312,335 3,261,878
Truworths International Ltd. 556,390 3,024,299 8,280,919
TRADING COMPANIES & DISTRIBUTORS — 0.39%
Barloworld Ltd. 275,674 1,137,108
1,137,108
WIRELESS TELECOMMUNICATION SERVICES — 7.75%
MTN Group Ltd. 2,152,586 18,246,299
Vodacom Group Ltd. 482,044 4,590,212
22,836,511
TOTAL COMMON STOCKS
(Cost: $470,701,525) 294,100,338
SHORT-TERM INVESTMENTS — 0.94%
MONEY MARKET FUNDS — 0.94%
BlackRock Cash Funds: Institutional, SL Agency Shares
0.50%c,d,e 2,555,644 2,555,644
BlackRock Cash Funds: Prime, SL Agency Shares
0.49%c,d,e 129,696 129,696
BlackRock Cash Funds: Treasury, SL Agency Shares
0.27%c,d 93,610 93,610
2,778,950
TOTAL SHORT-TERM INVESTMENTS
(Cost: $2,778,950) 2,778,950
TOTAL INVESTMENTS IN SECURITIES — 100.72%
(Cost: $473,480,475) 296,879,288
Other Assets, Less Liabilities — (0.72)% (2,123,208)
NET ASSETS — 100.00% $294,756,080
aNon-income earning security.
bAll or a portion of this security represents a security on loan. See Note 1. c Affiliated issuer. See Note 2.
dThe rate quoted is the annualized seven-day yield of the fund at period end. eAll or a portion of this security represents an investment of securities lending
collateral. See Note 1.
iSHARES
®MSCI TURKEY ETF
February 29, 2016
Security Shares Value
COMMON STOCKS — 99.86%
AIRLINES — 2.83%
Pegasus Hava Tasimaciligi ASa,b 180,156 $ 1,059,670
Turk Hava Yollari AOa 2,782,092 6,892,146 7,951,816
AUTO COMPONENTS — 0.35%
EGE Endustri VE Ticaret ASb 5,529 555,744 Goodyear Lastikleri TASb 17,908 436,367
992,111
AUTOMOBILES — 3.01%
Ford Otomotiv Sanayi AS 353,722 4,177,913 Tofas Turk Otomobil Fabrikasi AS 630,011 4,285,644 8,463,557
BANKS — 33.42%
Akbank TAS 11,088,013 27,731,290
Albaraka Turk Katilim Bankasi ASb 1,360,809 713,840
Sekerbank TASa,b 2,039,813 1,042,412
Turkiye Garanti Bankasi AS 11,642,412 28,999,645 Turkiye Halk Bankasi AS 3,150,012 10,660,661 Turkiye Is Bankasi Class Cb 7,937,958 12,142,808
Turkiye Sinai Kalkinma
Bankasi ASb 3,522,993 1,919,595
Turkiye Vakiflar Bankasi Tao
Class Db 3,780,008 5,283,414
Yapi ve Kredi Bankasi ASb 4,381,837 5,561,083 94,054,748
BEVERAGES — 3.69%
Anadolu Efes Biracilik ve Malt
Sanayii AS 1,044,477 6,079,939
Coca-Cola Icecek AS 384,619 4,303,339
10,383,278
BUILDING PRODUCTS — 0.34%
Trakya Cam Sanayii ASb 1,582,509 958,675 958,675
CHEMICALS — 1.55%
Gubre Fabrikalari TASb 420,255 776,565 Petkim Petrokimya Holding ASa 3,024,010 3,581,980
4,358,545
CONSTRUCTION & ENGINEERING — 0.33%
Tekfen Holding ASb 652,610 938,673
938,673
Security Shares Value
CONSTRUCTION MATERIALS — 1.31%
Adana Cimento Sanayii
TAS Class A 265,010 $ 582,075
Akcansa Cimento ASb 240,891 1,159,290
Cimsa Cimento Sanayi VE
Ticaret AS 271,954 1,431,192
Konya Cimento Sanayii ASb 4,914 501,744
3,674,301
CONTAINERS & PACKAGING — 0.12%
Anadolu Cam Sanayii ASa,b 563,921 330,169
330,169
DISTRIBUTORS — 0.38%
Dogus Otomotiv Servis ve
Ticaret ASb 276,811 1,056,731
1,056,731
DIVERSIFIED FINANCIAL SERVICES — 4.85%
Haci Omer Sabanci Holding AS 4,627,648 13,656,792 13,656,792
DIVERSIFIED TELECOMMUNICATION SERVICES — 1.59%
Turk Telekomunikasyon AS 2,293,209 4,478,075 4,478,075
FOOD & STAPLES RETAILING — 7.57%
BIM Birlesik Magazalar AS 1,071,103 19,846,653 Bizim Toptan Satis Magazalari ASb 110,778 535,744
Migros Ticaret ASa,b 179,214 924,940
21,307,337
FOOD PRODUCTS — 1.84%
Pinar SUT Mamulleri Sanayii AS 90,070 457,239 Ulker Biskuvi Sanayi ASb 775,670 4,735,714
5,192,953
GAS UTILITIES — 0.48%
Aygaz ASb 378,353 1,363,700
1,363,700
HEALTH CARE PROVIDERS & SERVICES — 0.18%
Selcuk Ecza Deposu Ticaret ve
Sanayi AS 625,892 508,373
508,373
HOTELS, RESTAURANTS & LEISURE — 0.36%
NET Holding ASa,b 920,394 1,012,346
1,012,346
HOUSEHOLD DURABLES — 3.00%
iSHARES
®MSCI TURKEY ETF
February 29, 2016
Security Shares Value
Vestel Elektronik Sanayi ve
Ticaret ASa,b 420,613 $ 737,369
8,446,509
INDEPENDENT POWER AND RENEWABLE ELECTRICITY PRODUCERS — 0.54%
Akenerji Elektrik Uretim ASa,b 1,100,991 327,898
Aksa Enerji Uretim ASa,b 775,684 656,291 Zorlu Enerji Elektrik Uretim ASa,b 945,002 530,900
1,515,089
INDUSTRIAL CONGLOMERATES — 8.65%
Alarko Holding ASb 340,696 367,815
Dogan Sirketler Grubu
Holding ASa,b 5,273,020 945,817
Enka Insaat ve Sanayi AS 2,620,802 4,239,689
KOC Holding ASb 3,195,237 13,992,951
Turkiye Sise ve Cam Fabrikalari AS 3,351,608 3,833,910
Yazicilar Holding ASb 241,581 964,754
24,344,936
INSURANCE — 0.76%
Anadolu Anonim Turk
Sigorta Sirketi 1,003,145 553,380
Anadolu Hayat Emeklilik ASb 414,260 771,094
AvivaSA Emeklilik ve Hayat AS 118,626 802,938 2,127,412
MACHINERY — 0.48%
Otokar Otomotiv Ve Savunma
Sanayi ASb 42,337 1,349,718
1,349,718
MEDIA — 0.17%
Fenerbahce Futbol ASa,b 31,228 485,731
485,731
METALS & MINING — 4.23%
Borusan Mannesmann Boru
Sanayi ve Ticaret ASb 212,924 488,569 Eregli Demir ve Celik
Fabrikalari TAS 7,056,008 8,238,537
Kardemir Karabuk Demir Celik
Sanayi ve Ticaret AS Class Ab 660,228 290,475 Kardemir Karabuk Demir Celik
Sanayi ve Ticaret AS Class Db 3,539,118 1,305,550 Koza Altin Isletmeleri AS 231,090 1,270,104 Koza Anadolu Metal Madencilik
Isletmeleri ASa,b 875,220 322,861
11,916,096
Security Shares Value
OIL, GAS & CONSUMABLE FUELS — 5.76%
Tupras Turkiye Petrol
Rafinerileri ASa 631,070 $ 16,210,306 16,210,306
PERSONAL PRODUCTS — 0.26%
EIS Eczacibasi Ilac ve Sinai ve Finansal Yatirimlar Sanayi ve
Ticaret ASb 689,792 726,023
726,023
REAL ESTATE INVESTMENT TRUSTS (REITS) — 3.74%
Dogus Gayrimenkul Yatirim
Ortakligi ASa,b 341,436 410,213
Emlak Konut Gayrimenkul Yatirim
Ortakligi AS 9,576,010 8,361,346
Is Gayrimenkul Yatirim Ortakligi ASb 1,691,936 1,002,061
Torunlar Gayrimenkul Yatirim
Ortakligi AS 627,820 745,786
10,519,406
TEXTILES, APPAREL & LUXURY GOODS — 0.43%
Aksa Akrilik Kimya Sanayii AS 372,436 1,215,068 1,215,068
TRANSPORTATION INFRASTRUCTURE — 1.73%
TAV Havalimanlari Holding AS 823,922 4,865,791 4,865,791
WIRELESS TELECOMMUNICATION SERVICES — 5.91%
Turkcell Iletisim Hizmetleri AS 4,435,208 16,631,279 16,631,279
TOTAL COMMON STOCKS
(Cost: $488,923,556) 281,035,544
SHORT-TERM INVESTMENTS — 13.52%
MONEY MARKET FUNDS — 13.52%
BlackRock Cash Funds: Institutional, SL Agency Shares
0.50%c,d,e 35,963,691 35,963,691
BlackRock Cash Funds: Prime, SL Agency Shares
0.49%c,d,e 1,825,116 1,825,116
BlackRock Cash Funds: Treasury, SL Agency Shares
0.27%c,d 254,366 254,366
38,043,173
TOTAL SHORT-TERM INVESTMENTS
iSHARES
®MSCI TURKEY ETF
February 29, 2016 Value TOTAL INVESTMENTS IN SECURITIES — 113.38% (Cost: $526,966,729) $319,078,717Other Assets, Less Liabilities — (13.38)% (37,666,430)
NET ASSETS — 100.00% $281,412,287
aNon-income earning security.
bAll or a portion of this security represents a security on loan. See Note 1. c Affiliated issuer. See Note 2.
dThe rate quoted is the annualized seven-day yield of the fund at period end. eAll or a portion of this security represents an investment of securities lending
collateral. See Note 1.
iSHARES
®MSCI USA EQUAL WEIGHTED ETF
February 29, 2016
Security Shares Value
COMMON STOCKS — 99.86%
AEROSPACE & DEFENSE — 1.90%
B/E Aerospace Inc. 1,244 $ 54,263
Boeing Co. (The) 456 53,890
General Dynamics Corp. 392 53,418
Honeywell International Inc. 514 52,094 L-3 Communications Holdings Inc. 452 53,024
Lockheed Martin Corp. 248 53,516
Northrop Grumman Corp. 279 53,629
Raytheon Co. 426 52,760
Rockwell Collins Inc. 598 52,367
Textron Inc. 1,572 53,684
TransDigm Group Inc.a 248 52,968
United Technologies Corp. 582 56,233
641,846
AIR FREIGHT & LOGISTICS — 0.64%
CH Robinson Worldwide Inc. 766 53,490
Expeditors International of
Washington Inc. 1,196 54,753
FedEx Corp. 398 54,478
United Parcel Service Inc. Class B 550 53,102 215,823
AIRLINES — 0.64%
American Airlines Group Inc. 1,320 54,120
Delta Air Lines Inc. 1,089 52,533
Southwest Airlines Co. 1,276 53,528
United Continental Holdings Inc.a 961 55,027
215,208
AUTO COMPONENTS — 0.96%
Autoliv Inc.b 490 52,053
BorgWarner Inc. 1,659 54,216
Delphi Automotive PLC 827 55,144
Goodyear Tire & Rubber Co. (The) 1,802 54,276
Johnson Controls Inc. 1,502 54,763
Lear Corp. 531 53,817
324,269
AUTOMOBILES — 0.65%
Ford Motor Co. 4,291 53,680
General Motors Co. 1,814 53,404
Harley-Davidson Inc. 1,262 54,481
Tesla Motors Inc.a,b 301 57,771
219,336
BANKS — 2.99%
Bank of America Corp. 4,383 54,875
Security Shares Value
BB&T Corp. 1,660 $ 53,386
CIT Group Inc. 1,856 55,327
Citigroup Inc. 1,394 54,157
Citizens Financial Group Inc. 2,751 52,902
Comerica Inc. 1,569 53,001
Fifth Third Bancorp. 3,529 53,852
First Republic Bank/CA 892 54,894
Huntington Bancshares Inc./OH 6,189 54,154
JPMorgan Chase & Co. 950 53,485
KeyCorp 5,013 52,887
M&T Bank Corp. 503 51,583
People’s United Financial Inc. 3,625 52,961 PNC Financial Services Group
Inc. (The)c 644 52,364
Regions Financial Corp. 7,040 52,941
Signature Bank/New York NYa 413 53,504
SunTrust Banks Inc. 1,575 52,258
U.S. Bancorp. 1,360 52,387
Wells Fargo & Co. 1,108 51,987
1,012,905
BEVERAGES — 1.24%
Brown-Forman Corp. Class B 519 51,106
Coca-Cola Co. (The) 1,220 52,619
Coca-Cola Enterprises Inc. 1,087 52,730 Constellation Brands Inc. Class A 382 54,026 Dr Pepper Snapple Group Inc. 579 52,996 Molson Coors Brewing Co. Class B 623 53,123
Monster Beverage Corp.a 414 51,957
PepsiCo Inc. 535 52,334
420,891
BIOTECHNOLOGY — 2.52%
AbbVie Inc. 961 52,480
Alexion Pharmaceuticals Inc.a 375 52,800
Alkermes PLCa 1,563 50,438
Alnylam Pharmaceuticals Inc.a,b 896 52,479
Amgen Inc. 363 51,648
Baxalta Inc. 1,356 52,233
Biogen Inc.a 203 52,662
BioMarin Pharmaceutical Inc.a 705 57,718
Celgene Corp.a 521 52,533
Gilead Sciences Inc. 603 52,612
Incyte Corp.a 740 54,390
Ionis Pharmaceuticals Inc.a,b 1,529 52,842
Medivation Inc.a 1,695 60,630