Durham Research Online
Deposited in DRO:22 July 2014
Version of attached le:
Accepted Version
Peer-review status of attached le:
Peer-reviewed
Citation for published item:
Tymms, P. and Merrell, C. and Wildy, H. (2015) 'The progress of pupils in their rst school year across classes and educational systems.', British educational research journal., 41 (3). pp. 365-380.
Further information on publisher's website:
http://dx.doi.org/10.1002/berj.3156 Publisher's copyright statement:
This is the peer reviewed version of the following article: Tymms, P., Merrell, C. and Wildy, H. (2014), The progress of pupils in their rst school year across classes and educational systems. British Educational Research Journal, 41(3): 365380 which has been published in nal form at http://dx.doi.org/10.1002/berj.3156. This article may be used for non-commercial purposes in accordance With Wiley Terms and Conditions for self-archiving.
Additional information:
Use policy
The full-text may be used and/or reproduced, and given to third parties in any format or medium, without prior permission or charge, for personal research or study, educational, or not-for-prot purposes provided that:
• a full bibliographic reference is made to the original source
• alinkis made to the metadata record in DRO
• the full-text is not changed in any way
The full-text must not be sold in any format or medium without the formal permission of the copyright holders. Please consult thefull DRO policyfor further details.
Durham University Library, Stockton Road, Durham DH1 3LY, United Kingdom Tel : +44 (0)191 334 3042 | Fax : +44 (0)191 334 2971
The Progress of Pupils in Their First School Year across Classes and Educational Systems
Peter Tymms
CEM Centre, Durham University, Durham, UKChristine Merrell
CEM Centre, Durham University, Durham, UKHelen Wildy
Faculty of Education, The University of Western Australia, Perth, AustraliaPeter Tymms, corresponding author,
University of Durham, Centre for Evaluation and Monitoring
Mountjoy Research, Rowan Stockton Road, Durham, DH1 3UZ UK
e-mail address: [email protected]
Fax: +44 191 3348311
Abstract
Educational effectiveness research has identified school membership as being
and important factor in relation to academic progress but it has also pointed to the
importance of teachers. Additionally, districts have been shown to be of minor
importance for progress once key variables are taken into account whilst data from
international studies suggest that countries are important when attainment is studied
whilst controlling for background factors. A perspective, named the Proximate
Variables within Jurisdictions (PVJ) theory, is introduced to help understand and predict
relationships. The theory holds that variables which are closest to the student are the
most influential but that the jurisdiction where the student is educated, which has its
own approaches to education and upbringing is of similar importance. A child’s
educational success in international terms is most influenced by actions in the home and
the classroom seen in the context of the country where she or he is brought up.
Does the theory hold when progress in classrooms, year groups and educational
systems (jurisdictions) is estimated in a single analysis? This study compared progress
of pupils in over 4000 classrooms across eleven educational systems. Large differences
were found between classes and the educational systems both for reading and
mathematics during the first year at school. The theory holds for the most part but
questions are left unanswered and the paper sets out a series of testable hypotheses
which may be addressed in the future.
Keywords: effectiveness; international; progress; school systems
Introduction
With the aim of further exploring school and policy effectiveness within the
estimate the relative importance of classrooms and educational systems to students’
progress in literacy and numeracy in their first year at school. To do this, it analyses
data from three English-speaking countries (Australia, England and Scotland) within
which a number of groups exist, reflecting differing contexts. It examines the effects of
age, gender, Indigenous status (Australia only), English as an additional language, and
prior achievement on end-of-year Reading and Mathematics achievement. It proposes a
theoretical structure within which the analyses can be located and interpreted, and in
doing so, it adds to the literature on educational effectiveness and also on international
comparisons of educational systems and policy.
Significantly, the data are collected at the beginning of schooling and again at
the end of the first year allowing analyses of progress, unlike the snapshot approach of
international studies, such as TIMSS, PISA and PIRLS
Background
Effectiveness research concentrated for many years on the school as the unit of analysis
and the major findings and debates are summarised in Teddlie and Reynolds (2000)
providing a valuable backdrop to the present study which seeks to explore both smaller
(classes) and larger (educational systems) units of analysis. More recently, Guldemond
and Bosker (2009) suggested that schools are associated with between 10% and 30% of
the unexplained variance depending on the stage and the subject domain, giving a
similar estimate to Teddlie and Reynolds. It should be noted that this range was
estimated for the school as a whole without attempting to disaggregate to lower levels
such as departments, as recommended by Fitz-Gibbon (1996), or classes. Further, it is
based on progress over several years of schooling rather than the single year of this
study. Others have broadened the study of educational effectiveness to consider the
or the classroom, lies at the heart of student progress (Campbell et al, 2004). Nye et al.
(2004) reported that 17 studies of teacher effects showed between 7% and 21% of the
variance was associated with teachers after key controls had been put in place. Their
analysis of the experimental Student-Teacher Achievement Ratio (STAR) data
produced estimates of 11%, close to the median of the 17 studies although they note that
the STAR experiment was not designed to estimate teacher effects. More recently,
Chetty et al. (2011) emphasised the value of good teaching to the economy of a country
and put a figure of 25% of the variance associated with teachers. A much higher figure
of 40% was reported by Tymms et al. (1997) for progress during the first year in school
in England, although that figure conflated year groups with classrooms partly because
there is often only a single class per year in elementary (primary) schools.
It might be thought that the school effect is simply an aggregate of class effects.
But it could be that there is a school effect over and above that of classes – that is to say,
the whole may be more than the sum of the parts. However, a paper by Tymms et al
(2009) which analysed data on test scores for every year in elementary school as
students progressed through the grades implied that once progress within years is taken
in to account there is little residual school effect.
On aggregation, when the unit of study is at the next level up from the school -
the district - just 1% or less of the variance has been ascribed to it (Willms, 1987;
Tymms et al, 2008 ). In other words the district, where a school is located, has little
importance over and above individual school membership.
The pattern of classes being more important than schools which, in turn, are
more important than districts corresponds to the general claim that proximal variables
are of dominating importance and that distal variables less relevant. Within schools it
studies indicate that once the unit is aggregated one stage further, to the country level,
the unit becomes important once again (see for example Kyriakides, 2006). Although
the TIMSS data do not have prior achievement measures, Kyriakides comments “the
country effect was more important than the teacher effect”. He found that more than
20% of the variance was associated with countries in a series of models reported in his
paper.
There is clearly a need to bring the extensive work in educational effectiveness together but theoretical approaches to educational effectiveness in general and school effectiveness have been surprisingly sparse in the literature; Schreens (2013) estimated that only six out of one hundred and nine school effectiveness research studies were theory driven. He identified three conceptual/theoretical approaches as being the key contributions; the micro-economic approach, which he does not see as fully theorised, the organizational scientific framework and the dynamic model of educational
effectiveness (Creemers & Kyriakides, 2006, 2008). It is the latter which is the most influential and current. It deals with influences at different levels in the systems including the national level, with cross level influences and is increasing influential in effectiveness research. It does not, however, address the major pattern which is the focus of this paper.
Combining the findings from previous studies which have tended to analyse the
variance associated with different levels of aggregation, we notice a pattern which we
will name the Proximate Variables within Jurisdictions (PVJ) Theory. The PVJ Theory
proposes that the academic progress of students is most influenced by the jurisdiction or
educational system within which they are being educated through those factors within
that context which impact on them directly. At the student level, these would include
are able to become involved in early development, academic progress and/or are able
choose their offspring’s school. One would expect them to be most influential in the
earlier years of life and schooling, when they have greatest direct involvement with
their children, and less so as the students reach the teenage years during which they may
more strongly exert their own influence and align themselves to the culture and
behaviour of their peers. To some extent this influence may be captured through the
ideas associated with Cultural Capital described by Bordieu and Passeron (1977) and
measures of it proposed by Kelly (1988). The PVJ Theory also suggests that, as home
influence becomes less important (more distal) as children grow up, so the teacher
would become more important, corresponding to the findings of Nye et al (2004).
Other writers such as Matin et al. (2011) have offered theoretical explanations at
different levels. One approach is the ecological systems theory (see for example
Brofenbrenner, 2001) which emphasises the importance of not only the factors within
each environment but also how they are perceived by those who experience the
environment. This perspective may well enrich the PVJ theory as more data become
available. Schools provide the environment within which the proximal influence of
teachers occurs and yet they are governed by the distal factors from the district
administrators. Schools might be expected to have some impact on academic progress
over and above the impact of classroom membership, but not to a large degree. Schools
could conceivably provide a further dimension to the pupil and class effects by creating
a micro-culture that runs counter to the prevailing national culture. Such a possibility
corresponds to some aspects of the vision associated with the academies movement in
the UK (see for example Leo et al., 2010).
The PVJ Theory takes jurisdictions to refer to the broader environment of the
groups. For example, a school may be Australian whilst also belonging to a particular
State and be part of the Catholic community. Jurisdictions have a large degree of
autonomy and encompass the widely accepted and understood, implicit or explicit,
beliefs and ways of behaving for a group of individuals. It does not imply that everyone
within the group behaves identically or agrees without detraction, but rather that they
can, on average, as a whole group, be distinguished from other groups. Further, the
group may be as large as a nation but can, equally, be part of a nation and there can be,
as noted above, groups within groups; individuals or schools can belong to two or more
cultural groupings.
The terms proximal and distal refer, not to the physical proximity of factors, but
to their pertinence. For example, parents who take no interest in the academic progress
and cognitive development of their child may be as physically close as parents who are
wholly driven by academic achievement; one set of parents is distal and the other
proximal so far as academic progress is concerned. Further, it is quite possible that
parents are proximal in relation to one dimension such as academic development but
distal for another such as emotional development. A research aspiration is to quantify
the degrees of proximity of various factors to key outcomes and to quantify group
differences and group memberships, but that is beyond the scope of this paper. Further
work might draw on Hofstede’s influential study from 1980 which set out ideas which
led to the measuring of such factors as “power distance” and “individualism” (see for
example Boschner and Hesketh, 1994.)
It is important when proposing theoretical models of educational influence not to
lose sight of the importance of individual differences. In all multi-level models of
educational effectiveness which we are aware of, the greatest variance is associated with
school; it is just that the odds of success vary according to circumstance. There cannot
be anything as proximal as the student to him or herself.
In summary, by combining the findings of previous research into school
effectiveness and previous theoretical perspectives on environmental and cultural
factors, the PVJ Theory suggests that the major influences on a student’s academic
progress are the individual themselves, the classroom/teacher and the educational
system as a whole, which is defined by jurisdiction membership. No study that we are
aware of has been able to test this hypothesis by directly incorporating prior
achievement measures and that is one of the aims of this paper.
The Assessment and the Data Sources
The data were obtained from a large-scale monitoring system known as PIPS,
Performance Indicators in Primary Schools run by the Centre for Evaluation and
Monitoring (CEM) (www.cem.org) at Durham University, UK, and The University of
Western Australia, Perth, Australia. PIPS begins with a baseline assessment of children
on entry to formal schooling. The assessment is repeated at the end of that first year.
Information is collected at both time-points using an individually-administered
objective, computer-delivered adaptive assessment of early maths and early reading.
The assessment has been designed to provide reliable and useful information about
children who are developmentally weak at the age of 4 through to those who are very
academically able at the end of school at the age of 7 (Tymms et al., 2004).
Background data are also recorded at the time of the assessments.
The Assessment
The adaptive PIPS baseline assessment is administered within the first few weeks of
school by an appropriate adult (usually the class teacher) on a one-to-one basis and
takes between 15 and 20 minutes per child
The assessment includes measures of name writing, vocabulary acquisition,
concepts about print, phonological awareness, word recognition, reading (which form
the Reading scale), and concepts about mathematics, counting, numerosity, number
identification, shape identification, informally and formally presented number and
mathematical problems (which form the Maths scale). The questions in each of the
sections listed above are ordered in difficulty. All children begin each section with the
easiest question and work through progressively more difficult items until they get a
certain number of items incorrect at which point they move onto the start of the next
section. The software presents items on-screen accompanied by sound files. The child
responds verbally or by pointing to an answer on the screen. The adult records the
child's response as either correct or incorrect using the appropriate buttons on the screen
or by clicking the mouse pointer on the area of the screen that the child points to. The
software uses the child's responses and the stopping rules within each section to select
appropriate items for presentation. For the follow-up assessment at the end of the year,
the software re-starts the assessment just before the place where the child started to
make mistakes at the beginning of the year. The adaptive nature of the assessment
means that each child completes an assessment that is appropriate to his/her ability of
sufficient length to give a very reliable score, and it enables a whole class of children to
be assessed efficiently. The method of presenting the items on screen and through sound
files means that there is very little reliance on adult judgements, resulting in an
assessment which is standardised in its administration, adding to its reliability.
Although the vast majority of children can be reliably assessed using the software, there
objects and simplified pictures in a booklet to ask a range of easier questions and then
enters the child's responses into the software. The internal reliabilities vary slightly
depending on country and start or end of the year but, for example, the Cronbach's alpha
value for the whole scale for children starting school in England has been reported to be
0.98 and the test/re-test reliability also 0.98 (Tymms, Merrell, Henderson, Albone and
Jones, 2012). PIPS has good predictive validity, for example correlating up to 0.7 with
later measures of academic ability at age 11 (Tymms et al., 2012).
Whilst the content of the assessment was the same for the countries involved in
this study, some adaptations were made and three versions produced; one each for
England, Australia and Scotland. Specifically, the sound files used an accent typically
found in each country so that the pronunciation of words was familiar to the young
children. One of the screens portrayed a countryside scene and used as a prompt for
asking children to point to a number of different objects, for example castle, windmill
and butterfly. Some of the items in this picture were drawn in a different style for the
Australian version, for example the windmill was of a style typically seen in Australia.
A differential item function (DIF) analysis has previously been carried out to explore
the relative difficulty of items in the three versions before making comparisons between
the results. The vocabulary measure differed most of all, but was nevertheless
considered to be sufficiently close to be included (Tymms, Merrell and Jones, 2004).
The Data
Data were available from Scotland, England and all the states and territories in
Australia. In the case of England, Scotland and two of the Australian states the data are
known to be representative, but for the other Australian states and territories they may
The data from Scotland came from state schools that were part of the Scottish
educational system. In England there were state and independent schools, and although
both follow the statutory Early Years Foundation Stage curriculum, the independent
schools do have a degree of autonomy. In Australia the states and territories run their
own educational systems although each has groups of semi-autonomous, state, Catholic
and independent schools. By prior agreement we were unable to analyse the differences
between these groups by state and territory.
Data were available on 83,304 pupils in 2,888 year groups, 4,534 classes and 11
educational systems. The assessments were carried out at the start and the end of the
academic year 2007/8. In Scotland and England these started in the autumn of 2007 and
in Australia in January 2008. The classes’ average size was 19.1 pupils (SD 7.9). The
number of first-year classes in each school varied. Fifty seven per cent of schools had
just one class, 32% had two classes, 9% had 3 classes and 2% had more.
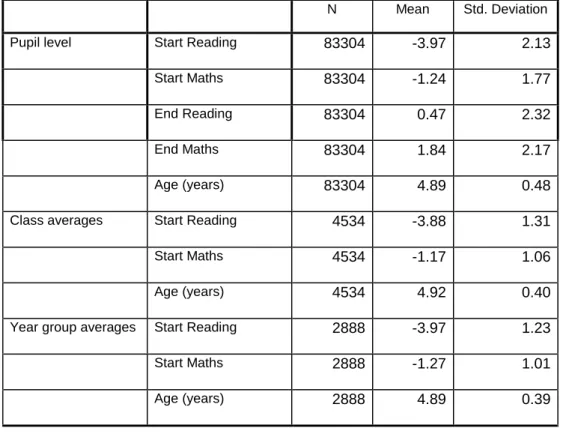
Rasch Measurement was used to create a single ordinal scale of pupils’ scores
for reading and, separately for mathematics. Reading and mathematics mean scores and
standard deviations are reported in Tables 1 and 2 together with details on the other
variables used in the models.
Insert Tables 1 & 2 about here
Socio-economic status (SES) and ethnicity are not included for three reasons.
Firstly once the prior measures are included as explanatory variable in the models, the
SES and ethnicity measures ceased to have the important predictive power that they
exert in isolation, they are essentially implicit in the prior achievement scores. Secondly
the SES measures are not comparable across countries. Thirdly ethnicity is confounded
Language’ because of its importance in preliminary models whilst the Australian
Indigenous population are also specifically identified because of their special status.
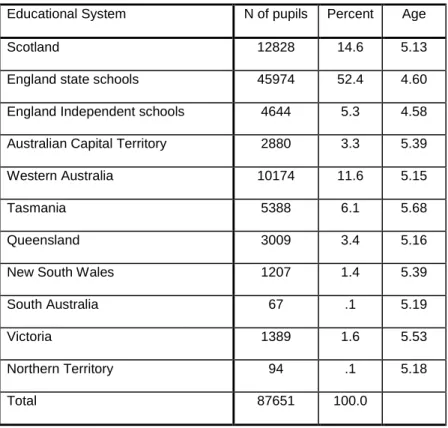
The classes were identified as belonging to 11 educational system units of
varying sample sizes as is shown in Table 3.
Insert Table 3 about here
Analyses
The study used multi-level models to quantify differences in pupils’ relative progress in
reading and mathematics during their first year of school in eleven different educational
systems (which included two countries’ state schools, territories, states and independent
schools in England). The models nested pupils within classes, classes within year
groups and year groups within educational systems. They were constructed to control
for a series of variables first at the pupil level, then at the class level and finally at the
year group level. The results of the analyses of the reading data are described first and
this is followed by the analyses for maths.
The choice of model structure (four levels) is based on the theoretical position which is the basis of this paper and on preliminary investigation of different model structures which are not reported here. In particular the possibility of just reporting pupils in classes in jurisdictions or pupils in year groups in jurisdictions were
considered, but both theory and the partitioning of variance suggested that this would not be appropriate.
Reading
The modelling strategy was first to examine the variance partitioned between the
pupils, classrooms, year groups and educational systems and then examine those
pupil level variables and the differences between the units of the three highest levels are
shown in Figures 1 to 3.
Insert Figures 1-3 about here
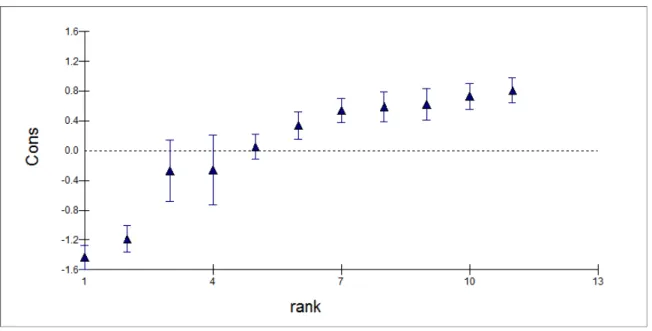
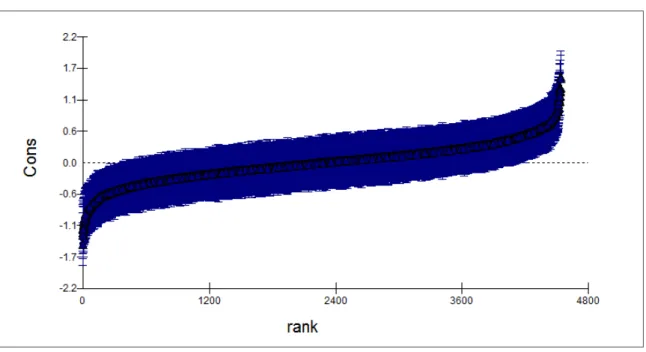
Although there were more classes than year groups the general patterns in
Figures 1 and 2 are similar with a minority units differing significantly from the
average. On the other hand in Figure 3 it is clear that most Educational Systems were
significantly either above or below the mean.
Two key variables were aggregated to the class level and added to give the
second model. Finally the same variables were aggregated to the year group and added
to give the third model. The variables chosen to be aggregated were the initial reading
score of the pupils and their age. The former was selected as the most powerful
predictor of the outcome and it was thought that it would be most likely to influence the
general approach to the teaching of reading at a class level. The age of children in the
study varied considerably and it was thought that the pedagogical approach may well be
influenced by the average age of the class. A similar rationale influenced the decision to
use the same variables at the year group level. It should be noted that first-hand
knowledge of schools suggested that in some the year group is a homogenous whole
with much sharing between teachers whereas others were more traditional, with classes
being more clearly identified as isolated units with single teachers. The former was
thought to be more common in English state and Scottish schools. The models are
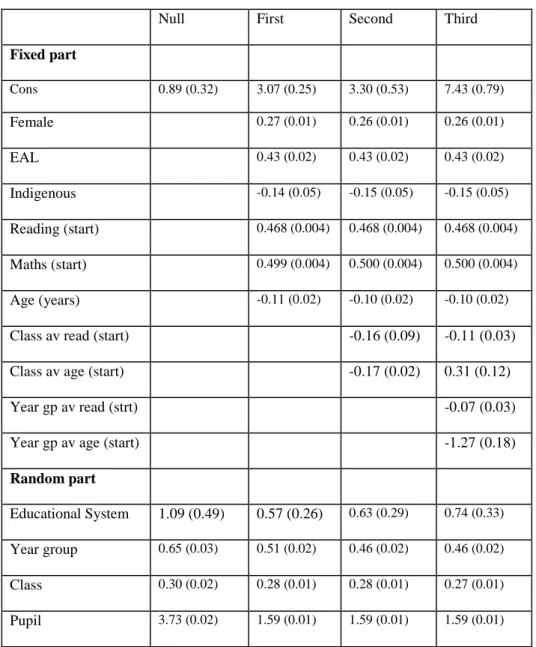
shown in Table 4 where all figures shown are significant at the 5% level.
Insert Table 4 about here
The coefficients from model 3, converted to Effect Sizes as outlined in the appendix,
Insert Figure 4 about here
The chart brings out the dominance of prior achievement as a predictor of later
achievement with reading predicting reading most strongly closely followed by maths
predicting reading. The next most important factor is the average age of the Year group,
which was negatively related to progress (ES=-0.79) whereas was the class average age
was positively linked but is smaller in importance (ES=0.20). Other fixed effects had
ESs between about 0.1 and 0.3. The random effects were large with the educational
system being the largest (ES=1.37) followed by the year group (ES=1.08) and class
(ES=0.82). As noted earlier, the pupil, as an individual, remains the most important
variable in the model providing both the prior achievement measures and unexplained
residual corresponding to an ES of 2.0.
Mathematics
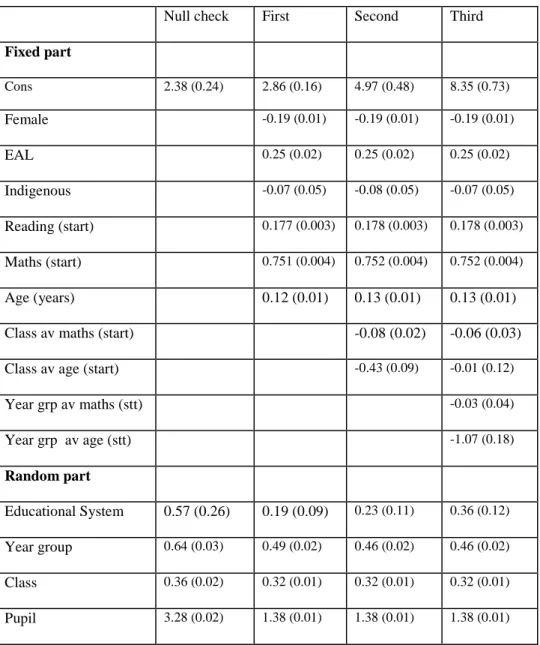
The analysis for maths followed the same approach as for reading and the results are
shown in table 5 with all figures significant at the 5% level unless specifically noted
otherwise in the text.
Insert Table 5 about here
In the null model for maths a slightly higher proportion of the variance was seen
than for reading at the pupil level (68%) whilst, 7% was found at the class level, 13% at
the year group level and 12% at the Educational system level.
As with reading the major predictors in Model 1 account for a considerable
proportion of the variances; they dropped by 58% at the pupil level which matches the
at Educational System which is considerably more than for reading. As in the null
model, a little over half of the variance is found at the pupil level but a seventh was
found at the class level, a fifth at the year group level and just under a tenth at the
Educational System level. This gives a higher proportion of the variation associated
with maths than reading at both the class and year group levels corresponding to Nye et
al.’s (2004) finding of large teacher effects for maths. Compared with reading, the
Educational System is of less relevance.
As for reading, the prior achievement scores dominate the prediction but now
maths prior attainment was clearly more important than reading prior attainment.
Compared with boys whose first language was English, Indigenous pupils made a little
less progress but not significantly so (p>.05) and girls a little less, the opposite of
reading, whilst children whose first language is not English make more progress. The
older the child, the more progress s/he made on average, unlike reading.
In the second model, two class level variables were introduced. Variances at the
four levels were hardly affected except at the educational system level where the
variance increased. The average maths intake level was negatively related to the final
maths score although the effect was small but the average age of the class was
negatively related to progress in maths.
The third model included the two variables aggregated to the year group level.
Again the only variance which changed was at the fourth level and it increased giving it
considerably more relevance than in the first model which simply adjusted for pupil
level variables. The year group average age was strongly linked to less progress and the
class average age lost its significance. The average maths starting score of the year
group was not significant. The third model significantly (p<.01) improved the fit as
The Effect Sizes shown in Figure 4 for maths are very similar to those for
reading although maths is more strongly predicted than reading by prior attainment with
earlier maths being more important than earlier reading. As with reading the next most
important factor is the average age of the Year group and the class average age was
weakly but positively linked. Other fixed effects had similar ESs. The random effects
were more similar and large for the educational system (ES=1.03), the year group
(ES=1.16) and class (ES=0.97). The pupil remains the most important variable in the
model.
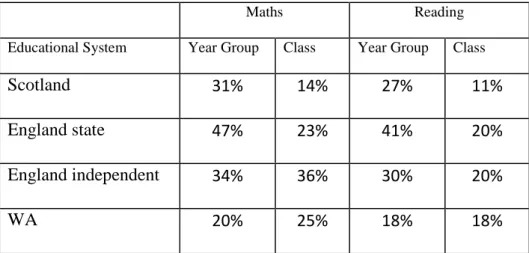
Classes and year groups
The analyses reported above nested pupils in classes, classes in year groups and year
groups in Educational Systems. But, as noted above, the class and year group may be
less well defined than in, for example, a High School. Further it was thought possible
that the integrity of the class might be clearer in some systems than others where a year
group involving say three classes may act as a single unit. To investigate this further,
the four largest education systems represented in the data were analysed separately. For
each system, Model 1 alone was set up with just three levels; pupils, classes and year
groups. Table 6 shows the variance associated with each system for reading and for
maths.
Insert Table 6 about here
The table shows considerable differences between Educational Systems and
some differences between reading and maths. Amongst Scottish and English state
schools the residual variance is mostly linked to the year group rather than the class.
There is a similar trend in reading for English independent schools, but not for maths.
but for Reading the class and the year group are equal. One could reasonably maintain
the hypothesis that in some large schools the year group functions as a large class with
several teachers but that the classes are kept separate in other schools.
Discussion
The analyses set out to explore the progress made by young children in their first year
of schooling using a single unique dataset in which it was possible to control for key
variables and partition the variance between pupils, classes, year groups and educational
system. We acknowledge that the data were not perfect. Some useful variables such as
socioeconomic status were not available across jurisdictions; it is unclear whether the information was representative of some jurisdictions and we did not have detailed measures of class, school or jurisdiction activities. The value of this paper is to provide evidence for a structural framework which can form the basis for further investigation rather than to establish specific relationships. We would argue that the data are suitable for this purpose.
Bringing together the findings from previous research on school effectiveness as well
as perspectives on society and culture, the PVJ Theory was proposed to explain the
importance of jurisdictions in relation to proximal and distal variables, and the results
from a series of multilevel models set against the theory. The pupil, class, year group
and educational system were all of substantive importance to the academic progress of
pupils in reading and mathematics. But in the main, the year group was associated with
a greater proportion of the variance than the class and this appears to run counter to the
predictions of PVJ theory. However, as has been noted above, it does seem that there is
a pedagogic movement to bring classes together in one year group to make a
in England operate Foundation Units, in which children in nursery and the first year of
school are placed together rather than in discrete classes. The data support this view and
show that the portioning of variance between classes and year groups in the largest
systems gave clearly different patterns which were described above. With this in mind
we conclude that the PVJ was generally supported by the data analysis. It would have
been useful also to have had data on the extent to which specific classes were treated as
separate entities and which were integrated within year groups within schools.
A number of additional points came out of the analyses. About half of the
variance in reading scores in Model 3 was associated with classrooms, year groups and
educational systems. For maths it was a little less. For maths, the classroom and year
group together were much more important than the Educational System but for reading
there were approximately equal. This could be because reading is a more
culturally-linked activity, not being so tightly culturally-linked to the effect of schooling, whereas maths is
very closely linked to a curriculum. Similar findings showing that maths is more
influenced by education that reading have been reported elsewhere (see for example Teddlie & Reynolds, 2000; Townsend, 2007)
The proportion of variance associated with classes and year groups is much
higher than is usually reported in relation to classes and schools, and one has to ask
why. The two major reasons are surely that the data covered just one year of progress
and that it related to young children. When progress is checked over several years, more
influences come into play at school and home, although it should be noted that
Kyriakides and Creemers (2008) found that the effect at the school level was stronger in studies which investigated the effect over more than 2 years compared with those studies which investigated the school effect over a single school year. Further, progress
more rapid than in later years following the general growth patterns as theorised by
Demetriou (2005).
Finally we note that the educational systems studied in this paper, whilst
showing clear differences, are very similar. They have evolved with close ties over
many years with all of the systems exchanging teachers, speaking a common language
and reading common texts. There are important and, perhaps, growing differences, but
they are far more similar than, say, Korea and Sweden. It would be interesting to collect
comparable data from these countries and explore the Theory further. It would be useful
also to analyse data from other age groups if and when they become available.
Conclusion
The proposed PVJ Theory predicts that teachers and membership of distinct educational
systems will be important to student progress and the results of the analyses were
consistent with the theory but some questions are left unanswered; these lead to some
predictions which are listed below. In some instances studies have already explored
these ideas and they are noted:
(1) Parental efforts to help children make good progress at school will be an
important predictor of progress yet it is difficult to capture these using broad
measures of socio-economic status. More specific home-based measures need to
be employed within effectiveness studies.
(2) Although school membership is related to progress, it will always be a poorer
predictor than class membership. The importance of class membership
(3) Even greater differences between countries than those found in this paper would
be seen between educational systems if those outside the Anglo world were
included.
(4) Parents can be expected to be of less importance to progress in later school years
whilst teachers and peers can be expected to become more important. Two
meta-analytical studies have confirm this (Kyriakides et al, 2010; Fan & Chen, 2011)
(5) Policy changes will have little impact unless they change the practice of teachers
and/or the ways in which parents bring up their children.
(6) Policy changes will have different impacts in different countries.
(7) Policy initiatives which change teaching will have a greater impact on maths
than reading which is more closely linked to language and home background.
This study has considered a new perspective on the interpretation of data on
school effectiveness in relation to the comparison of different educational systems.
Whilst the findings have added to existing knowledge, there are still unanswered
questions. More data from countries with diverse cultures as well as from difference age
groups, and information that is fully representative of jurisdictions would enable further
exploration of the PVJ Theory.
References
Bordieu, P. and Passeron, J. C. (1977). Reproduction: In Education, Society and
Culture. London: Sage.
Boschner, S. and Hesketh, B. (1994). Power Distance, Individualism/Collectivism, and
Job-Related Attitudes in a Culturally Diverse Work Group. Journal of Cross-Cultural
Bronfenbrenner, U. (2001). The bioecological theory of human development. In N. J.
Smelser & P. B. Baltes (Eds). International encyclopedia of the social and behavioral
sciences(Vol. 10, pp. 6963–6970). New York: Elsevier.
Campbell, J., Kyriakides, L., Muijs, D., and Robinson, W. (2004). Assessing Teacher
Effectiveness: Developing a differentiated model. London: Routledge Falmer.
Chetty, R., Friedman, J. N. and Rockoff, J. E. (2011). The long-term impacts of
teachers: Teacher value-added and students’ outcomes in adulthood. Working Paper
17699 http://www.nber.org/papers/w17699
Creemers, B. P., & Kyriakides, L. (2006). Critical analysis of the current approaches to modelling educational effectiveness: The importance of establishing a dynamic
model. School Effectiveness and School Improvement,17(3), 347-366. Creemers, B.P.M., & Kyriakides, L. (2008). The dynamics of educational
effectiveness: A contribution to policy, practice and theory in contemporary schools. London: Routledge
Demetriou, A. (2005). Mind Intelligence and Development: A cognitive, differential,
and developmental theory of intelligence. In A. Demetriou & A. Raftopoulos
(Eds.), Cognitive developmental change: Models, methods, and measurement.
Cambridge: Cambridge University Press.
Fan, X., & Chen, M. (2001). Parent involvement and students academic
achievement: A meta-analysis. Educational Psychology Review, 13(1), 1-22
Fitz-Gibbon, C. T. (1996). Monitoring Education: Indicators, Quality and Effectiveness.
Guldemond, H. and Bosker, R. (2009). School effects on students' progress – a dynamic
perspective. School Effectiveness and School Improvement 20(2): 255-268.
Harker, R. and Tymms, P. (2004). The Effects of Student Composition on School
Outcomes. School Effectiveness and School Improvement 15(2): 177-199.
Hedges, L. V., & Olkin, I. (1985). Statistical Methods for Meta-Analysis. New
York/Orlando FLA: Academic Press.
Hofstede, G. (1980) Culture’s consequences: International differences in work-related
values.Beverley Hills, CA: Sage.
Kelly, A. (1988). Getting the GIST: A Quantitative Study of the Effects of the Girls Into
Science and Technology Project. Department of Sociology University of Manchester.
Kyriakides, L. (2006). Using International Comparative Studies to Develop the
Theoretical Framework of Educational Effectiveness Research: A secondary analysis of
TIMSS 1999 data. Educational Research and Evaluation, Vol. 12, No. 6, December
2006, pp. 513 – 534.
Kyriakides, L. & Creemers, B.P.M. (2008). A longitudinal study on the stability over time of school and teacher effects on student learning outcomes. Oxford Review of Education, 34 (5), 521-545
Kyriakides, L., Creemers, B.P.M., Antoniou, P., & Demetriou, D. (2010). A synthesis of studies for school factors: Implications for theory and research. British Educational Research Journal, 36(5), 807-830
Leo, E., Galloway, D. and Hearne, P. (2010). Academies and Educational Reform:
Governance, Leadership and Educational Strategy. Multilingual Matters/ Channel View
Publications.
Martin, A., Bobis, J., Anderson, J., Way, J, and Vellar, R. (2011). Patterns of Multilevel
Variance in Psycho-Educational Phenomena: Comparing Motivation, Engagement,
Climate, Teaching, and Achievement Factors. Zeitschrift für Pädagogische Psychologie,
25 (1), 49–61.
Nye, B., Konstantopoulos, S. and Hedges, L.V. (2004). How Large Are Teacher
Effects? Educational Evaluation and Policy Analysis,26(3): 237-257.
Scheerens, J. (2013). The use of theory in school effectiveness research revisited. School Effectiveness and School Improvement, 24(1), 1-38
Teddlie, C. and Reynolds, D. (2000). The International Handbook of School
Effectiveness Research. London: Falmer Press.
Townsend, T. (2007). International Handbook of School Effectiveness and Improvement. Dordrecht, the Netherlands: Springer
Tymms, P., Merrell, C., Heron, T., Jones, P., Albone, S. and Henderson, B (2008). The
importance of districts. School Effectiveness and School Improvement,19(3): 261-274.
Tymms, P., Merrell, C., and Henderson, B. (1997). The First Year at School: A
quantitative investigation of the attainment and progress of pupils. Educational
Tymms, P., Merrell, C. and Jones, P. (2004). Using baseline assessment data to make
international comparisons. British Educational Research Journal, 30(5): 673-689.
Tymms, P., Merrell, C., Henderson, S., Albone, S. and Jones, P. (2012). Learning
difficulties in the primary school years: Predictability from on-entry baseline
assessment. Online Educational Research Journal. June 2012. Retrieved from
www.oerj.org 13/06/12.
Tymms, P. (2004). Effect sizes in multilevel models. In I. Schagen & K. Elliot
(Eds.), But what does it mean? (pp. 55-66). Slough: National Foundation for
Educational Research.
Tymms, P., Jones, P., Albone, S., and Henderson, B. (2009). The first seven years at
school. Educational Assessment and Evaluation Accountability, 21, 67-80.
Weick, K. E. (1976). Educational organisations as loosely coupled
systems. Administrative Science Quarterly, 21.
Willms, J. D. (1987). Differences Between Scottish Educational Authorities in their
Appendix
Figure 4 uses the formulae, taken from Tymms (2004), to convert multi-level model
coefficients into Effect Sizes. The formulae are:
For dummy variables
𝛥 =𝛽𝜎1
𝑒
Where:
Δ is the Effect Size
β1 is the coefficient for a dummy variable at the student level
σe is the square root of the variance (standard deviation) at the student level
For continuous fixed predictors
𝛥 =2𝛽1∗ 𝑆𝐷𝜎𝑝𝑟𝑒𝑑𝑖𝑐𝑡𝑜𝑟 𝑒 For variances 𝛥=2𝜎𝜎𝑢 𝑒 Where
Figure 1 Educational system residuals for reading (Model 1) with 95% Confidence Intervals
Figure 3 Class residuals for reading (Model 1) with 95% Confidence Intervals
Figure 4: Effect Sizes from Model 3 from Table 4 & 5 with Reading or maths as the outcomes -1 -0.5 0 0.5 1 1.5 2 2.5 Fem ale EAL Indi gen ous Rea ding ( star t) Math s (st art) Age (year s) Clas s av s tart r ead o r m aths Cla ss a v age (star t) Year grou p av s tart r ead o r m ath Year grou p a v ag e (st art) Educ atio nal S ystem Year grou p Cla ss Effec t Si z e Reading Maths
Table 1 means and standard deviations for the continuous variables
N Mean Std. Deviation
Pupil level Start Reading 83304 -3.97 2.13
Start Maths 83304 -1.24 1.77
End Reading 83304 0.47 2.32
End Maths 83304 1.84 2.17
Age (years) 83304 4.89 0.48
Class averages Start Reading 4534 -3.88 1.31
Start Maths 4534 -1.17 1.06
Age (years) 4534 4.92 0.40
Year group averages Start Reading 2888 -3.97 1.23
Start Maths 2888 -1.27 1.01
Age (years) 2888 4.89 0.39
Table 2 Categorical variables
Percent
Indigenous 0.8
EAL 10.0
Table 3 The eleven educational systems and age of first assessment on starting school
Educational System N of pupils Percent Age
Scotland 12828 14.6 5.13
England state schools 45974 52.4 4.60
England Independent schools 4644 5.3 4.58
Australian Capital Territory 2880 3.3 5.39
Western Australia 10174 11.6 5.15
Tasmania 5388 6.1 5.68
Queensland 3009 3.4 5.16
New South Wales 1207 1.4 5.39
South Australia 67 .1 5.19
Victoria 1389 1.6 5.53
Northern Territory 94 .1 5.18
Table 4 Multi-level models for Reading (NB compositional effects at 4th level non-significant)
Null First Second Third
Fixed part Cons 0.89 (0.32) 3.07 (0.25) 3.30 (0.53) 7.43 (0.79) Female 0.27 (0.01) 0.26 (0.01) 0.26 (0.01) EAL 0.43 (0.02) 0.43 (0.02) 0.43 (0.02) Indigenous -0.14 (0.05) -0.15 (0.05) -0.15 (0.05) Reading (start) 0.468 (0.004) 0.468 (0.004) 0.468 (0.004) Maths (start) 0.499 (0.004) 0.500 (0.004) 0.500 (0.004) Age (years) -0.11 (0.02) -0.10 (0.02) -0.10 (0.02)
Class av read (start) -0.16 (0.09) -0.11 (0.03)
Class av age (start) -0.17 (0.02) 0.31 (0.12)
Year gp av read (strt) -0.07 (0.03)
Year gp av age (start) -1.27 (0.18)
Random part
Educational System 1.09 (0.49) 0.57 (0.26) 0.63 (0.29) 0.74 (0.33)
Year group 0.65 (0.03) 0.51 (0.02) 0.46 (0.02) 0.46 (0.02)
Class 0.30 (0.02) 0.28 (0.01) 0.28 (0.01) 0.27 (0.01)
Pupil 3.73 (0.02) 1.59 (0.01) 1.59 (0.01) 1.59 (0.01)
Table 5 Multi-level models for Mathematics (NB compositional effects at 4th level not significant)
Null check First Second Third
Fixed part Cons 2.38 (0.24) 2.86 (0.16) 4.97 (0.48) 8.35 (0.73) Female -0.19 (0.01) -0.19 (0.01) -0.19 (0.01) EAL 0.25 (0.02) 0.25 (0.02) 0.25 (0.02) Indigenous -0.07 (0.05) -0.08 (0.05) -0.07 (0.05) Reading (start) 0.177 (0.003) 0.178 (0.003) 0.178 (0.003) Maths (start) 0.751 (0.004) 0.752 (0.004) 0.752 (0.004) Age (years) 0.12 (0.01) 0.13 (0.01) 0.13 (0.01)
Class av maths (start) -0.08 (0.02) -0.06 (0.03)
Class av age (start) -0.43 (0.09) -0.01 (0.12)
Year grp av maths (stt) -0.03 (0.04) Year grp av age (stt) -1.07 (0.18) Random part Educational System 0.57 (0.26) 0.19 (0.09) 0.23 (0.11) 0.36 (0.12) Year group 0.64 (0.03) 0.49 (0.02) 0.46 (0.02) 0.46 (0.02) Class 0.36 (0.02) 0.32 (0.01) 0.32 (0.01) 0.32 (0.01) Pupil 3.28 (0.02) 1.38 (0.01) 1.38 (0.01) 1.38 (0.01)
Table 6: proportion of variance at class and year group levels for the largest educational systems
Maths Reading
Educational System Year Group Class Year Group Class
Scotland 31% 14% 27% 11%
England state 47% 23% 41% 20%
England independent 34% 36% 30% 20%