Developing A Strategic Advertisement
Method “VUCMIN” To Enhance The
Desire Of Customers For Visiting Dealers
Manabu Yamaji, Aoyama Gakuin University, Japan Satoru Hifumi, Aoyama Gakuin University, Japan M. Murat Sakalsiz, Aoyama Gakuin University, Japan
Kakuro Amasaka, Aoyama Gakuin University, Japan
ABSTRACT
In this paper, the authors develop VUCMIN as a new strategic advertisement method designed to enhance the desire to visit dealers in the automobile industry. The proposed method uses video advertisement, and was developed based on scientific approaches and analyses that focus on the standard behavioral movements of customers who visit dealers when choosing an automobile. This method, which is based on the different approaches identified in target customer profiles, aims to increase the desire of customers to visit dealers. After creating this video advertisement, customers were verified as having a positive opinion towards visiting dealers with a plan to purchase the vehicle featured in the video.
Keywords: video advertisement, Customer behavior, Automobile
INTRODUCTION
n the 21st century, one of the important issues in the industrial world is how to create desirable and influential products. The last century was concerned with the important issue of how to implement uniform production in the industrial world. But in today’s world, customer desires have diversified, and it is getting harder to meet the expectations of each customer in production. That is why it has become necessary to design and develop products that grasp the heart of customers and impress them deeply.
In this paper, the authors develop the Video Unites Customer behavior and Maker’s designing INtentions, or VUCMIN, as a new strategic advertisement method designed to enhance marketing and the desire to visit dealers in the automotive industry. The proposed method uses development of a video advertisement based on scientific approaches and analyses that focus on the standard behavioral movements of customers who visit dealers in automobile industry.
Using a statistical data analysis of customer behaviors, the basis of different customer segments, their priorities, and preferences during personal visits can be clarified and linked with an advanced marketing strategy (AIDA) using a short, internet video–oriented advanced advertisement method. This method, which is based on the different approaches identified in target customer profiles, aims to increase customer desire to visit stores.
NEED FOR A NEW ADVERTISING APPROACH IN THE AUTOMOBILE INDUSTRY
Advertising expenses in the Japanese automotive industry are trending to around 6 trillion Japanese Yen [1]. Despite these high advertising expenses, the number of vehicle sales is stagnant [2]. Further, it is thought that retaining existing customers and gaining new customer profiles will be difficult unless researchers construct a new advertising policy; therefore, the authors propose a new advertisement approach. [3].
From the manufacturers’ perspective, new designs must be created to grasp the heart of customers and find out how sale advertisements can deal with new customer intentions in the future.
When looking at media-based advertising expenses, there has been an increase in internet advertising expenses recently [1]. The automobile industry has also been expected to use internet video as a new advertising method.
Application of the AIDA Model in Advertising
The AIDA model, introduced by E. St. Elmo Lewis in 1898 [4], is used to evaluate the effects of an advertisement. The model percieves levels of physiologically diversified behaviors, from when a person comes in contact with an advertisement until engaging in actual purchase of the intended product. The AIDA model is the prototype of today’s advertising information processing model, and it categorizes the psychology of purchasing behavior in customers into 4 steps: A (Attention), I (Interest), D (Desire), and A (Action).
Actual Application of the AIDA Model in Advertising Automobiles
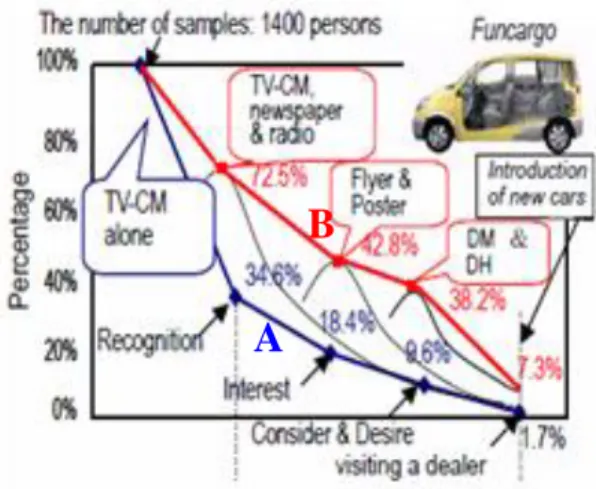
The authors’ reference research is shown in Fig. 1, which shows the AIDA curve from the new sale advertisements of Toyota’s newly-released Funcargo model [5]. From this figure, one can see that in terms of advertisements, vehicles are generally promoted in the following order: television commercials (TVCM), newspapers, radio, fliers, posters, direct mail (DM), and direct hand (DH). The results of this can be seen in the current status of customers visiting the dealers. The A curve in the figure shows the effecs of TVCMs after the advertisements, when 1.7% of customers make an actual dealer visit. The B curve confirms that the Media-Mics (newspaper advertisements, fliers, DM, and DH) result in a 7.3% increase in dealer visits.
However, the effects of the Media-Mics are insufficient as advertisement tools, therefore the authors consider the need to promote new advertisement media [6-9].
In the next chapter, the authors propose “VUCMIN”, which looks at establishing a new stategic advertisement method using internet interface.
A
B
Fig. 1 Customer Purchasing Behaviour (AIDA Model)
APPOACH OF THE VUCMIN STUDY
The purpose of the VUCMIN study is to effectively generate fascination with a product, resulting in an increase in the desire of customers to visit dealers and growth in the number of vehicle sales.
The authors generated the following solution to the current situation outlined in chapter 2: distribution of a video 1 to 2 minutes in length to a particular age group and gender segment. The video takes customer preferences and the intentions of the product planning and design departments into account. In other words, the name of the video advertisement method is “Video Unites Customer behavior and Maker’s designing INtentions” [10].
Fig. 2 represents the steps (Step 1–Step 4) of the VUCMIN study, utilizing the specific concept methods outlined in “SQC technical methods” [3,11,12]. These steps cover preparation of internet video distribution, which unites customer preferences and behaviors with the manufacturer’s design intentions [10].
Step 1: Analysis of Customer Behavior and Data Collection
This step aims to provide an up-to-date inquiry as to deep-seated customer wants in terms of customer behavior analysis [13]. Disparate behaviors by gender and age segment will be clarified in the analysis of standard behaviors.
Step 2: Perception of Intentions
In this step, the intentions of the product planning department and designers are scientifically analysed in terms of product design. Identifying which aspects of the vehicle the designers and manufacturer want to express to customers is an important step in preparing the video.
Step 3: Creation of the VUCMIN method
An advertising video is created, targeting females in their 20s and males in their 50s using the results of Step 1 and Step 2. With this final step, the authors try to reach a solution based on the above research.
Step 4: Verification
Using the data results from Steps 1 through 3, the authors verified the validity of the VUCMIN internet video that was created.
C la ri fi c a ti on of s ta nd a rd B e ha v ior s C la ri fi c a ti on of Dis p a ra te B e ha v ior s b y G e nd e r C la ri fi c a ti on of Dis p a ra te B e ha v ior s b y A g e M a n u fa c tu re r i n te n tio n s
FRAME OF VUCMIN MODEL
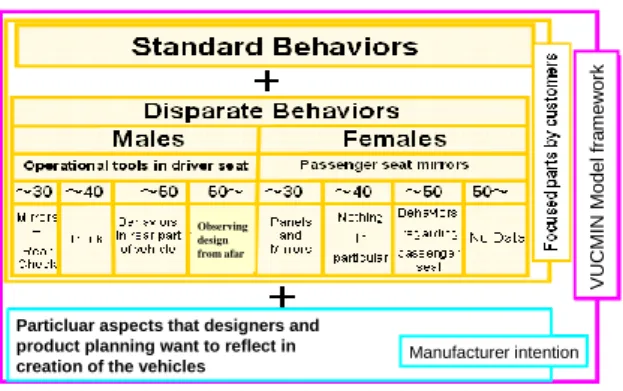
Based on the research approach outlined in the previous chapter, the framework of the VUCMIN model is established as in Fig. 3. In this figure, i) standard behaviors and ii) disparate behaviors by gender are identified and classified. After classifying the subjects by age, the details of disparate behaviors are identified mainly in terms of the front seat of the vehicle (driver’s seat tools, passenger rearview mirror, etc.) and the rear seat (not shown in figure). This knowledge of customer behaviors and knowledge of the parts that product plannning and designers wish to show to customers are taken into consideration as the basis for the VUCMIN model framework.
THE PROCESS OF VUCMIN CREATİON
In this chapter, the authors explain the process of video creation using VUCMIN. Data Collection from Customer Behaviors
In this section, customer behaviors are analyzed while customers are facing the vehicle from the front. This allows collection of customer information used to create the video. It is thought that customers’ desire to visit the dealer can be increased via video distribution when the customer is in the stage “prior to dealer visit”.
The authors therefore conducted the following survey in order to investigate customer behaviors. The authors prepared the survey table in Fig. 4. The survey item categories were decided as follows;
In the survey table, the target vehicle model is 1, gender 2, age 3, standing positions 4, and vehicle part focused on is 5. Among those items, standing positions are categorized as in Fig.5.
Front is 1, front fender (driver seat) 2, rear fender (driver seat side) 3, trunk is 4, rear fender (passenger seat side) 5, front fender (passenger seat) 6, handle 7, shift lever 8, near passenger seat is 9. In total, all customer behaviors (standing positions, getting in and out, operation, walking time, etc.) are categorised into 85 distinct types of behaviors.
The survey was conducted on customers visiting the Toyota Exhibition Hall in the 2 months from August 2006 to September 2006 between 12:00 and 17:00 p.m., according to age and gender group. 316 data items were collected.
Fig. 3 Frame of VUCMIN Model Particluar aspects that designers and
product planning want to reflect in
creation of the vehicles Manufacturer intention
Observing design from afar V U C M IN M o d e l fr a m e w o rk
Data Analysis of Customer Behaviors
As a result of the behavioral analysis of how customers observe vehicles outlined in chapter 3, the following (i~iv) conclusions were drawn:
1. In general, when customers visit vehicle galleries (dealers) they pay special attention to the first vehicle and focus on some parts with interest. However, they start to loose interest by the second and third vehicles, which they observe casually and for a shorter period of time.
2. When movment time is excluded, customers spend only 1-2 minutes to determine the value of each vehicle. 3. Regardless of gender and age, heading for the driver’s seat and getting in and observing the interior,
steering wheel, gagues, and other items was common standard behavior.
4. Nevertheless, there were disparities in standard behaviors by both gender and age.
Fig.5 Sample Customer Standing Positions Fig. 4 Survey Samples
Detailed Analysis for Creation of VUCMIN
Standard Behaviors for Creating the Video
Toyota’s Mark X was the vehicle model used in creating the video, and analyses regarding standard behavior were conducted as follows. As seen in Fig. 4 above, survey sheets are taken on each customer sample while they are observing the vehicle. Sample 1 is a 20 year old male, sample 2 is a 30 year old female, and sample 3 is a 40 year old male. Samples of each of the three customers are different according to their age and gender.
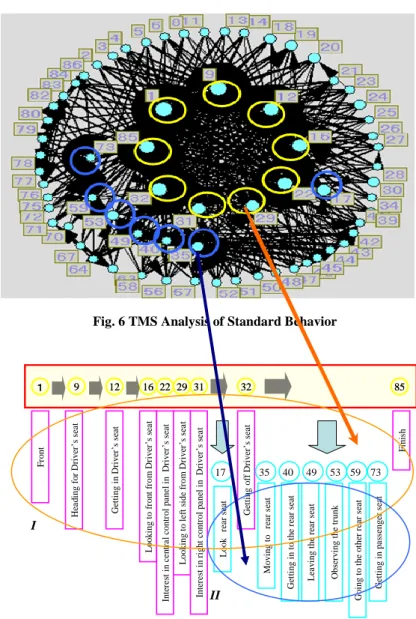
For further analysis, TMS (Text Mining Studio) is conducted on all categorized customer behaviors and the results are shown in Fig. 6, numbers 1 to 86. The numbers in the inner circle of the figure (1, 9, 12, 16, 22, 29, 31, 32, 85) represent the nine standard behaviors (I) (observing front area → sitting in the driver’s seat → driver operation system (control system) → leaving the driver’s seat, etc.). Element resolution of the standard behaviors are also shown in Fig. 7.
Fig. 7 Standard Customer Behaviors Fig. 6 TMS Analysis of Standard Behavior
1 1 99 1212 1616 2222 2929 3131 3232 8585 F ront H ea d ing fo r D ri ve r’ s s ea t G et ti ng i n D ri ve r’ s se at Looki ng t o fr on t f ro m D ri ve r’ s se a t Int er es t in c en tr a l c ont rol p a ne l i n Dr ive r’ s se at Looki ng t o l ef t si de f ro m D ri ve r’ s s ea t Int er es t in r ight c ont rol p a ne l i n D ri ve r’ s se a t 17 Look re ar s ea t F ini sh G et ti ng of f D ri ve r’ s s ea t M ovi ng t o re ar s ea t 35 40 49 53 59 73 G et ti ng i n t o t he r ea r s ea t Le a v ing t he r ea r s ea t O bs er vi ng t he t runk G oi ng t o t he o the r r ea r s ea t G et ti ng i n p as se nge r se at I II
Next, the numbers in middle circle of the figure (17, 35, 40, 49, 53, 59, 73) represent the seven standard behaviors (II) (observing rear seat from driver’s seat → moving to rear seat → leaving driver’s seat and observing side of trunk → getting into rear seat of passenger seat → moving into passenger seat).
Furthermore, the remaining 70 attached behaviors from the outer circle of Fig. 6 specify individual behaviors. For example, 2 through 8 are looking at the vehicle entirely from behind, tires, and engine; 18 to 28 are passenger seat storage, side mirror, and lights: 42 to 48 are looking at vehicle diagonally from a 45 degree angle, looking under the vehicle, etc.
Finally, as a result of detailed anaylses, a pattern of standard behaviors was identified regardless of age or gender. Front → moving to driver’s seat → entering driver’s seat → looking out the front viw → observing steering operation systems and instrument panel → looking to passenger seat side → looking at operation systems on driver’s side and checking side mirrors → leaving the vehicle.
Disparate Customer Behavior by Gender and Age for Creating Video
In this section, the following analyses of disparate behavior are conducted regarding age and gender. 1. Explanation of Disparate Behaviors by Gender
On the basis of the data collected above, a Correspondence Bubble Analysis was then conducted as seen in Fig. 8 to identify disparities in behavior by gender. Correspondence Bubble Analysis is an analysis technique generally known as correspondence analysis. This method distributes area maps related to attributes (gender, age) and texts (customer behaviors). Items with stronger relationships are closely distributed. In Fig. 8, the difference in distributed texts (behaviors) by age and gender can be seen. (The blue line in the figure shows behaviors by gender, and the green line shows behaviors by age). Moreover, the authors identified male and female behaviors as follows.
Female Behaviors
According to the results of the Correspondence Bubble Analysis, female customer behaviors indicate that they are especially concerned with the area around the passenger seat in addition to the front fender and rear-view mirror, door opening and closing, the dashboard, sun visor (make-up mirror), etc.
Fig. 8 Disparate Customer Behaviors by Age and Gender
解析2
Female ~50 Female~
Years old Male~40years old
Male~30years Female~3
Years old
Male~50years Males over 50years
Female behaviors Male behaviors Behaviors of younger people Behaviors of old people C he c k ing d e s ign be tw e e n front a nd d ri v e r’ s s e a t Disparity by gender Disparity by age (a) (c) (b)
Male Behaviors
However, males do not show concern the with passenger seat, and instead were focused on the driver seat position, shift lever, door switches, air conditioner, operating tools, and switches around the driver seat such as audio parts.
2. Explanation of Disparate Behaviors by Age
In this section, disparate behaviors are investigated by conducting a Correspondence Bubble Analysis, on both gender and age attributes. For example, the following behaviors are seen for (a) males over 50 years old (the numbers from orange areas (b) in the figure, 8, 51, 84: (i) looking towards the driver’s seat from far behind, (ii) observing the design between the front and driver’s seat, (iii) looking to the driver’s seat from a distance, etc.).
In particular, disparate behaviors are not evident until (c) the age of 30 for both male and female profiles. Moreover, males in their 20s look at (i) rear seats from the driver’s seat, (ii) the rearview mirror, and (iii) the side mirrors. Similarly, profile behaviors of females in their 20s are looking at (i) the side mirror on the opposite side, (ii) the rearview window, (iii) the instrument panel, (iv) the dashboard, (v) and lastly, focusing on the operation and sound of the passenger seat door while opening and shutting.
The creation of VUCMIN the basis of this knowledge will be explained in the next chapter.
0 Second
30 Seconds
60 Seconds
90 Seconds
Front
Driver seat
Side
⑧
Side
⑩
Rear
⑪
End
①
Opening scene
④
Front
⑤
Left side view
⑥
Operation systems
⑦
Left operation
②
45
°
Front
③
Door Operation
⑨
Rear
45
°
0 Second
30 Seconds
60 Seconds
90 Seconds
Direct view of entire vehicle from front Focus on parts reflected by designers by looking at the front diagonally from a 45° angle Opening door of driver seat and first full view of driver seat Front and interior area view, having a first impression Focus on operating tools around the driver’s seat (Steering Handle) Focus on parts reflected by designers by looking at the entire vehicle from the rearRear
Focus on parts reflected by designers, looking at whole side Viewing the entire vehicle from rear diagonallyTime(secs)
THE CREATİON OF VUCMIN
Indentifying the Intentions of Product Designers
This chapter will explain the influence of product planning and designer intentions in VUCMIN creation. The Mark X is used as a target vehicle in design inquiries. According to common opinions from designers and product planning at Toyota Motor Corporation, the parts that are focused on to be demonstrated to customers are:
Front Proportions
Streamlined Side proportions
Tri-beam Headlamps (lenses)
Widened Console Box
Sharpened Rear
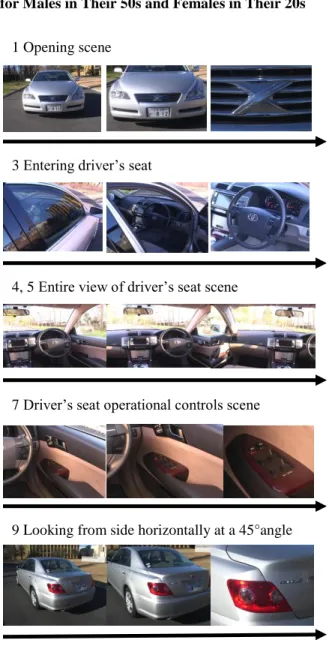
The Creation of VUCMIN for Males in Their 50s and Females in Their 20s
1 Opening scene
3 Entering driver’s seat
4, 5 Entire view of driver’s seat scene
7 Driver’s seat operational controls scene
9 Looking from side horizontally at a 45°angle
Fig. 10 Example of Representative Photos for VUCMIN Video
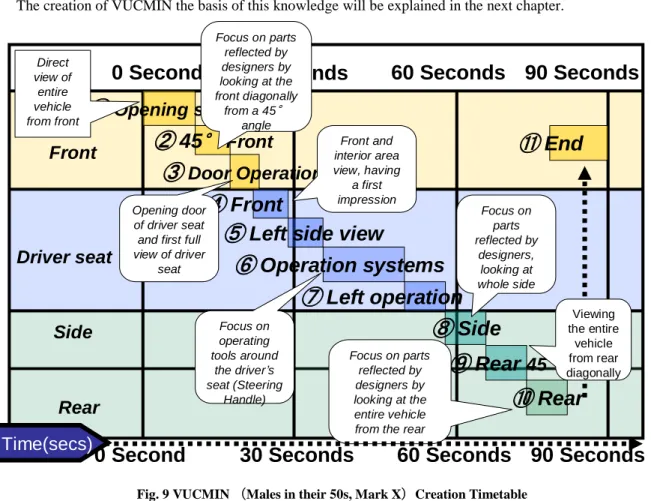
In this section the video created for the target profile of males in their 50s will be explained using the timetable in Fig. 9.
The timetable figure indicates that video time is set at 90 seconds. Video shooting order is composed specifically of scenes from 1 to 11 starting from the front, driver’s seat, side, and rear of the vehicle. Scenes are 1. direct front scene, 2. diagonally front view scene, 3. door opening scene of the driver’s seat, 4. entire driver’s seat view scene, 5. console box and shift lever scene, 6. Steering handle scene, 7. Operation tools of driver’s seat scene, 8. side view scene from driver’s seat, 9. rear side view scene, 10. entire view of vehicle from rear, and lastly, moving back to front, 11. entire view of the vehicle scene. The composed scenes form the VUCMIN video on the basis of the standard and disparate behaviors of customers. Example photos representing these scenes (1 to 11) are shown in Fig. 10.
Using the same approach, VUCMIN is created regarding age and gender. VERİFİCATİON
In this chapter, customer surveys are executed in order to test the validity of VUCMIN. This is done by asking customers, “After seeing the Mark X video, approximately when do you plan to purchase one by visiting a Toyota dealer?” to verify their desire to visit dealers (high, low). According to the survey results, the desire to visit dealers (early stage consideration of Mark X purchase) is not only increased for current Toyota vehicle owners but also for customers who own vehicles from other manufacturers.
The authors are currently promoting the results of this research as part of the strategic advertising method VUCMIN, which utilizes internet interface with the collaboration of universities and industries.
CONCLUSİON
In this study, the authors developed VUCMIN as a new strategic advertising method in order to enhance the desire to visit stores in the automobile industry. The proposed VUCMIN uses video advertisements, developed based on the scientific approaches and analyses that focus on the standard behaviors of customers visiting stores in the automobile industry. VUCMIN aims to increase customer desire to visit stores based on target customer behavior approaches.
AUTHORS INFORMATION
Manabu Yamaji is a research associate in the School of Science and Engineering at Aoyama Gakuin University, Japan. He received his Master of Engineering degree in Graduate School of Information Systems at University of Electro-Communications in 1999. His current research and teaching interests are in the general area of production engineering. In particular, he is interested in Total Quality Management, Computer Aided Engineering.
Satoru Hifumi received his Master of Engineering degree from the School of Science and Engineering at Aoyama Gakuin University.
M. Murat Sakalsiz received his Master of Engineering degree from the School of Science and Engineering at Aoyama Gakuin University.
Kakuro Amasaka is a Professor in the School of Science and Engineering at Aoyama Gakuin University, Japan. He received his Ph.D. degree in Precision Mechanical and System Engineering, Statistics and Quality Control at Hiroshima University in 1997. His current research and teaching interests are in the general area of production engineering. In particular, he is interested in New JIT. He is a member of POMS and EurOMA.
REFERENCES
1. Dentsu Inc., Dentsu Online, “Total Advertisement Expenses Total of Japan”, 2003 http://www.dentsu.co.jp/marketing/adex/adex2005/_media.html
2. Japan Automobile Manufacturers Association (JAMA), “Automobile Sale Numbers of Japan”, 2005 http://www.jama.or.jp/stats/product/index.html
3. Amasaka, K., “The Validity of Advanced TMS, A Strategic Development Marketing System –Toyota’s Scientific Customer Creative Model Utilizing New JIT-”, The International Business & Economics
Research Journal, Vol.6, No.8, pp.35-42, 2007
4. Lewis, E. St. E., “Financial Advertising (AIDA Model)”, Lewey Bros., Reprinted by Garlard Publishing
Inc., New York & London, pp.77, 1985
5. Amasaka, K., “A Demonstrative Study on the Effectiveness of “Flyer Ad” for the Automobile Sales -Proposal of “Marketing SQC” to Revolutionize Dealers’ Sales Activities (part II)-”, The Japan Society for
Production Management, pp.160-163, 2001
6. Melewar, T.C., Smith, N., “The Internet revolution: some global marketing implications”, Marketing
Intelligence & Planning, Vol.21, No.6, 2003.
7. Tuncalp, S., “Newspaper advertising practice in an Arabian gulf country”, Management Research News, Vol.20, No.4, 1997.
8. Smith, D. A., “Online accessibility concerns in shaping consumer relationships in the automotive industry”,
Online Information Review, Vol.33, No.1, pp.77-95, 2009.
9. Kimura, T., Yamaji, M., Amasaka, K., “A Study of “Scientific Approach Method for Direct Mail, SAM-DM”: Effectiveness of Attracting Customers Utilizing Advanced TMS”, Proc. of the 5th Asian Quality Congress, pp.938-945, 2007.
10. Murat, S., Hifumi, S., Yamaji, M., K.Amasaka, "Developing a strategic advertisement method VUCMIN to enhance the desire of customers for visiting dealers", Proc. of the International Symposium on management engineering, pp.248-257, 2008.
11. Amasaka, K., Science SQC, New Quality Control Principle, Springer, 2004
12. Amasaka, K., “A study on Science SQC by Utilizing Management SQC,-A Demonstrative Study on a New SQC Concept and Procedure in the Manufacturing Industry-”, Journal of Production Economics, Vol.60-61, pp.591-598, 1999
13. James F Engel, Roger D Blackwell Paul W Miniard “Consumer Behavior” The Dryden Press, p20-pp.36,
![Fig. 2 represents the steps (Step 1–Step 4) of the VUCMIN study, utilizing the specific concept methods outlined in “SQC technical methods” [3,11,12]](https://thumb-us.123doks.com/thumbv2/123dok_us/10871547.2976023/3.918.288.595.333.537/represents-vucmin-utilizing-specific-concept-methods-outlined-technical.webp)