Jurnal Economia,Volume 8, Nomor 2, Oktober 2012
ESTIMATING THE PAYOFF TO SCHOOLING USING THE STANDARD MINCERIAN MODEL
Losina Purnastuti Yogyakarta State University [email protected]
Abstract: Estimating the Payoff to Schooling using the Standard Mincerian Model. Using data from Indonesia Family Life Survey (IFLS) wave IV, this paper empirically estimates the private rates of return to education in Indonesia. The result from ordinary least-squares estimate shows that one year of schooling increases an individual’s earnings by 5.66 percent. Futhermore, Standard Mincerian Earnings function estimates reveal a gender asymmetry in private economic returns to schooling, with returns to women’s education being substantially and statistically significantly higher than men’s.
Keywords: Return to Schooling, Standard Mincerian Earnings Function
Abstrak: Mengestimasi Hasil Investasi Pendidikan Menggunakan Model Mincerian Standar.Menggunakan data Indonesia Family Life Survey (IFLS) IV, artikel ini secara empiris mengestimasi “rates of return” investasi pendidikan di Indonesia. Hasil dari estimasi dengan menggunakan pendekatan OLS menunjukkan bahwa setiap tambahan satu tahun sekolah akan meningkatkan pendapatan individu sebesar 5.66 persen. Estimasi fungsi pendapatan Standard Mincerian mengindikasikan perbedaan “return to schooling” antara perempuan dan laki-laki. “return to schooling” perempuan lebih tinggi dari pada “return to schooling” laki-laki.
Kata Kunci: Kembalian Investasi Pendidikan, Fungsi Pendapatan Standar Mincerian
Introduction
Although the returns to education has been a topic of considerable interest in the empirical labour and education economics literatures for around 50 years, the analysis of returns to education remains a relevant issue for both the developed and the developing economies. Numerous studies, for many different countries and time periods, have confirmed that better-educated individuals receive higher wages and have occupations of higher status than less-educated individuals. For most developed countries, there is general agreement over the size and the patterns of the return to education across sub-groups of
the population. In terms of the empirical findings from developing countries, however, there has been an ongoing debate concerning even the magnitude of the returns to schooling. Some studies, for example, provide evidence of a relatively low private return to schooling in developing countries, whereas there are numerous other empirical studies that find that the return to schooling is quite high. Despite the voluminous empirical literatures on the returns to schooling in less developed countries, to date there have been only a limited number of studies based on Indonesian data. The current set of
analyses for Indonesia therefore has the potential to fill a major gap in the literature.
The plan of the paper is as follows. In the next section the empirical model and estimation methods will be discussed briefly. Results and interpretation are explored in Section 3. Finally, Section 4 concludes the paper.
Method
The specification of the earnings equation used below is based on the human capital model developed by Mincer (1974). According to this model, the log of earnings in a given time period can be decomposed into an additive function of a linear education term and a quadratic working experience term,
ln(݁ܽݎ݊݅݊݃ݏ) = ߚ+ߚଵ݁݀ݑ +ߚଶ݁ݔ + ߚଷ݁ݔଶ+ߝ
where earnings is monthly earnings for individual i, edui is years of schooling for individual i, expi is a measure of work experience for individual i, ݁ݔଶ is
experience squared for individual i, and ߝiis
an unobservable random variable, and β1,
β2, andβ3 are unknown parameters to be
estimated. According to human capital theory β1 = r, and so the estimated regression coefficient β1 is interpreted as the average private rate of return to one additional year of schooling. The Mincerian model assumes that (i) the only costs of schooling are the foregone earnings, and (ii) each individual starts working immediately after completion of school. Furthermore, this relationship provides a direct measure of the returns to schooling through the coefficient of the years of schooling variable in the earnings regression.
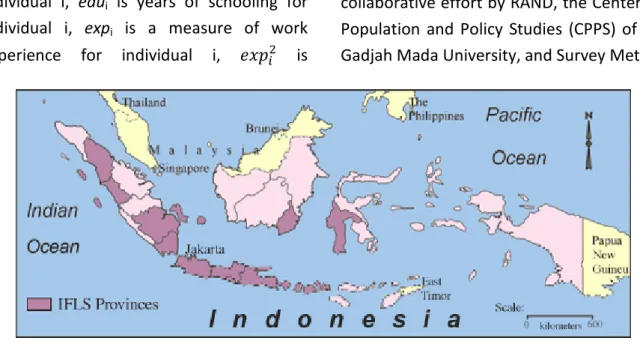
The data set used in the empirical analysis is the Indonesian Family Life Survey 4 (IFLS4). The coverage area of the survey can be seen in Figure 1. The survey collects data on individual respondents, their families, and their households. IFLS4 was fielded in late 2007 and early 2008. It was a collaborative effort by RAND, the Center for Population and Policy Studies (CPPS) of the Gadjah Mada University, and Survey Meter.
Jurnal Economia,Volume 8, Nomor 2, Oktober 2012
For the analysis of the private returns to schooling, the sample is restricted to individuals 15 to 65 years old, who were not full-time students, reported non-missing labour income, and provided information on schooling. Persons in the military during the survey week are omitted, as it is generally argued that the wages of those in the armed forces do not necessary reflect market forces. A total of 4596 observations satisfy these criteria and are utilized in the analysis.
Results and Discussion
The analysis commences with results from the standard Mincer equation. In this section, OLS estimates of the earnings function parameters are reported, assuming education to be exogenous. The econometric analysis of the private returns to schooling are estimated using the basic
Mincerian function, where, as described in previous section, the natural logarithm of earnings is regressed on years of schooling, potential work experience and its squared term. The results are reported in Table 1.
Table 1 presents the OLS coefficients estimated for the total sample and for males and females, separately. The Chow tests reject the null hypothesis of equality of the regression coefficients for males and females. The three standard models explain from about 19 to about 26 percent of the variation in actual earnings, figures which are comparable to other studies in the literature. All the coefficients reported in the table have the expected signs and are
statistically significant at the level of α =
0.01.
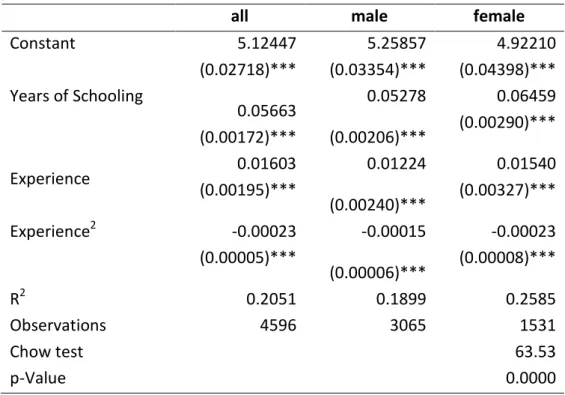
According to the Table 1 results, an additional year of education is associated Table 1.OLS Estimates of Standard Mincerian Earnings Function
all male female
Constant 5.12447 (0.02718)*** 5.25857 (0.03354)*** 4.92210 (0.04398)*** Years of Schooling 0.05663 (0.00172)*** 0.05278 (0.00206)*** 0.06459 (0.00290)*** Experience 0.01603 (0.00195)*** 0.01224 (0.00240)*** 0.01540 (0.00327)*** Experience2 -0.00023 (0.00005)*** -0.00015 (0.00006)*** -0.00023 (0.00008)*** R2 0.2051 0.1899 0.2585 Observations 4596 3065 1531 Chow test 63.53 p-Value 0.0000
Notes: Robust standard errors in parentheses. *, ** and *** denote statistical significance at the 10 percent, 5 percent and 1 percent levels, respectively.
with an annual 5.66 percent and 6.46 percent increase in pooled, male, and fema respectively. These estimate to schooling in Indonesia ar smaller than the Psacharo average estimate of 14 pe Developed Countries, Psacharopoulos (1994) avera 9.6 percent for Asian coun these results are in agreeme empirical studies, for exam (1998) in the Czech Republic and Dinh (2004) in China, Aro in Nigeria, and Aslam et Pakistan.
The estimates of the retu for females (6.46 percent) ar those for males (5.28 perce confirms that these dif statistically different, in schooling is more financially the labour market for fema males. This result is consis
Figure 2 (Sourc 0.00 1.00 2.00 3.00 4.00 5.00 6.00 7.00 R e tu rn to S ch o o li n g (% ) cent, 5.23 percent, ase in earnings for female samples mates of the return ia are substantially haropoulos (1981) percent for Less s, and the average estimate of ountries. However eement with some example: Flanagan ublic, Maurer-Fazio Aromolaran (2006) et al. (2010) in
return to schooling t) are higher than ercent). The t-test differences are indicating that cially rewarding in females than for nsistent with the
findings of many empiri Behrman and Deolalikar Miller et al. (1997) in (1998) in the Czech Rep (2000) in Italy, Lopez Mexico, and Asadullah (2 Comparison of the re among the three specific is provided in Figure potential work experien function to estimate schooling yields a rang percent increase in earn each additional year of s The coefficients on market experience varia term have the expected the usual concavity o earnings profile. The pa level of potential work labour market entrants return estimated for the percent. At 10 years market experience th
re 2. The Standard Mincerian Return to Schooling Source: Author’s calculation based on Table 1)
All Males Females
5.66
5.28
6.46
Observations Categories
mpirical studies, such as alikar (1993) in Indonesia, ) in Australia, Flanagan Republic, Brunello et al. pez-Avecedo (2001) in ah (2006) in Bangladesh. e return to schooling ecifications from Table 1 Figure 2. Using either erience in the earnings imate the returns to range of 5.28 to 6.46 earnings associated with
of schooling.
on the potential labour variable and its squared cted signs, and portray ity of the experience-payoff varies with the ork experience. Among nts (experience = 0) the r the total sample is 1.6 ars of potential labour the return is 1.14
Jurnal Economia,Volume 8, Nomor 2, Oktober 2012
percent, and at 20 years of potential labour market experience the return is 0.68 percent. The increase in earnings associated with additional labour market experience for females exceeds that for males up to around 20 years of experience. For example, among labour market entrants it is 1.54 percent for females and 1.22 percent for males. At experience = 10 it is 1.08 percent for females and 0.92 percent for males. Beyond 20 years of experience, however, the increase in earnings per year of labour market experience for males exceeds that for females, and for a number of years (e.g. at experience = 25 and experience = 35) it is positive whereas that for females is negative. This gender difference in the payoff to experience across levels of experience could be due to the following
reasons. First, it could reflect a cohort effect, where the younger female workers in the sample have joined the labour force under different perhaps more favourable -circumstances than the older female workers in the sample. Second, it could relate to selectivity in labour force participation. In the young cohort, females in the labour force may be heavily selected toward more able and talented individuals. Third, the younger cohorts in the sample tend to have better education than the older cohorts in the sample, and there may be complementarities between labour market experience and the level of education.
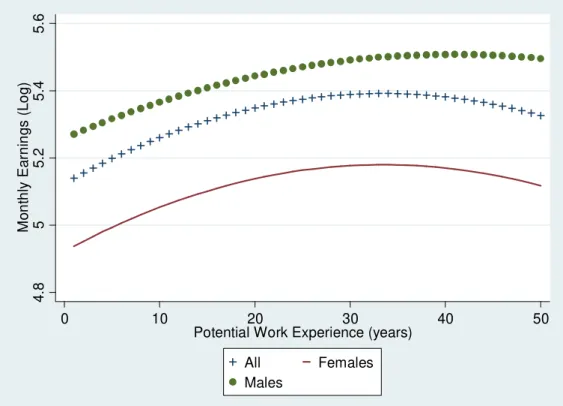
Also of interest is the level of experience at which the predicted experience-earnings profile peaks. This is whereߚመଶ+ 2ߚመଷ݁ݔݎ=
Figure 3. Experience - Earnings Profiles (Source: Author’s calculation based on Table 1)
4 .8 5 5 .2 5 .4 5 .6 M o n th ly E a rn in g s (L o g ) 0 10 20 30 40 50
Potential Work Experience (years)
All Females
0. This occurs when potential work experience reaches 34.85, 40.80, and 33.48 years for all, male, and female samples respectively (see Figure 3).
Figure 3 uses the estimates from Table 1 to predict experience-earnings profiles. The figure presents some patterns worth noting. As discussed above, the experience-earnings profiles have concave, first rising and then falling after reaching a given number of years. Based on the previous calculation of the experience-earnings profile we know that the earnings of male workers increase with experience until their peak at 40.80 years. Thus for a male leaving education at age 16, this peak would be at age 57. Female workers reach the peak of their experience-earnings profile earlier than their male counterparts, at 33.48 years. Thus for females leaving school at age 16 this peak would occur at 50 years. This would be well after women with career interruptions due to child bearing and rearing have returned to the labour market.
Conclusion
This paper reports evidence on the returns to schooling in Indonesia and highlights some critical issues. Separate estimates are obtained for males and females. OLS is employed as the methodological approach to measure the return to schooling. The estimation of the standard Mincerian earnings functions revealed that the return for an extra year of schooling is positive and significant. The results confirm that the returns to schooling in Indonesia are low in comparison with the return to schooling in many other countries, particularly Asian and developing countries.
Furthermore, it is clearly shown that the returns to schooling are higher for females than for males, which is in agreement with the findings of other studies.
References:
Aromolaran, A. B. (2006) Estimates of Mincerian Returns to Schooling in Nigeria. Oxford Development Studies 34 (2): 265-292.
Aslam, M., F. Bari, and G. Kingdon. (2010) Returns to Schooling, Ability and Cognitive Skills in Pakistan. Education Economics,
DOI:10.1080/09645292.2010.488470 Behrman, J.R., and A.B. Deolalikar (1993)
Unobserved Household and Community Heterogeneity and the Labor Market Impact of Schooling: A Case Study for Indonesia. Economic Development and Cultural Change41 (3): 461-488.
Brunello, G., S. Comi, and C. Lucifora (2000) The Returns to Education in Italy: A New Look at the Evidence. IZA Discussion PaperNo. 130.
Flanagan, R. J. (1998) Were Communists Good Human Capitalist? The Case of the Czech Republic. Labour Economics 5: 295-312.
Lopez-Avecedo, G. (2001) Evolution of Earnings and Rates of Returns to Education in Mexico. Policy Research Working PaperNo. 2691.
Maurer-Fazio, M., and N. Dinh (2004) Differential Rewards to, and Contributions of, Education in Urban
Jurnal Economia,Volume 8, Nomor 2, Oktober 2012
China’s Segmented Labor Markets. Pacific Economic Review9 (3): 173-189. Miller, P., C. Mulvey, and N. Martin (1997)
Family Characteristics and the Returns to Schooling: Evidence on Gender Differences from a Sample of Australian Twins.Economica64: 137-154.
Mincer, J. (1974) Schooling, Experience and Earnings.NBER, New York.
Psacharopoulos, G. (1981) Returns to Education: An Updated International Comparison. Comparative Education 17 (3): 321-341.
Psacharopoulos, G. (1994) Returns to Investment in Education: A Global Update. World Development 22 (9): 1325-1343.