ALLOCATION OF MANUFACTURING OVERHEAD COSTS
751
Ege Akademik Bakış / Ege Academic Review 10(3) 2010: 751-771
AN EVALUATION ABOUT THE IMPORTANCE OF
CRITERIA DETERMINING THE ALLOCATION
SEQUENCE IN STEP-DOWN ALLOCATION OF
MANUFACTURING OVERHEAD COSTS
*Assist. Prof. Haluk BENGÜ, University of Nigde, Department of Business Administration, Nigde, Turkey, [email protected].
Prof. Ahmet Vecdi CAN, University of Sakarya, Department of Business Administration, Sakarya, [email protected].
ABSTRACT
In today’s business environment, one of the most popular methodologies used to allocate manufacturing overhead cost (MOC)s on products is “Step-down Allocation Method”. In this methodology, transferring of manufacturing overhead costs from supplementary cost centers to primary cost centers are made considering specific rules (Can, 2003:92). Also, after manufacturing overhead costs accrued in one of the supplementary cost centers are allocated to other cost centers, they can not again be allocated again (Üstün,1994:251). Consequently, sum of manufacturing overhead costs is gathered all together in primary cost centers to be allocated (Altuğ, 2001:225). However, in these situations, from which of cost center to start allocation becomes an important subject. Here, the sequence of allocation plays two important roles and has two different effects. The first effect of sequence of allocation is on cost centers by means of cost planning and control. The second effect is on product parties by means of production planning and product costing&pricing.
In this study, the sequence of allocation of manufacturing overhead costs is tried to be presented by a hypothetical application.
Keywords: Keywords: Keywords:
Keywords: Manufacturing overhead costs, Step-down allocation methodology, Cost center.
* This article has previously been presented in 7th International Social Sciences
Haluk BENGÜ and Ahmet Vecdi CAN
1. INTRODUCTION
As known, one of the fundamental aims of cost accounting is to determine total and/or per-unit product costs. Cost accounting focuses on cause-effect relationship between costs and products in sequence to allocate production costs to products. In situations in which this relationship naturally exist or can be determined without any problem, costs are allocated to products directly. So, these kinds of costs are called as direct costs. The other costs related with production but remaining out of direct costs are called as manufacturing overhead costs. Manufacturing overhead costs (MOC) are mostly heterogeneous and progressive costs, and because of this reason they are unstable, difficult to plan and control.
The allocation of manufacturing overhead costs such as direct material and direct labor costs on products are made by using cost centers and rational allocation bases (ABs) related with these cost centers in a few stages. In the first stage, a connection between manufacturing overhead costs and cost centers are established via allocation bases and manufacturing overhead costs are allocated to primary cost centers (PCCs) where the production is made, and to supplementary cost centers (SCCs) where production is supported. This stage is called as first allocation.
The allocation of manufacturing overhead costs on products can only be made via primary cost centers. Because products subject to main operating area of any production company are actually produced in primary cost centers. However, supplementary cost centers indeed refer to only back-up operations and/or services required for a healthy production. So, manufacturing overhead costs accrued in supplementary cost centers have to be transferred to primary cost centers by any means in a rational way. This stage, in brief, is called as
second allocation. In literature, there are several allocation methodologies such as (i) simple (direct), (ii) step-down, (iii) mathematical and (iv) planned allocation method (Bursal and Ercan,1997:207; Akdoğan, 2006:364).
The fundamental point of these methodologies is that when the easiness of the application of the methodology increases, its sensitivity in cost allocation decreases.
For example, as to be come out of its title, the easiest methodology to be applied is the simple (direct) allocation methodology (Barfield et al.,1994:225). However, in simple allocation, the turnovers of benefits and services between supplementary cost centers definitely are not considered and manufacturing overhead costs are directly transferred to primary cost centers (Garrison at al.,2008:169). However, in mathematical allocation methodology, the complexity of application increases. In this methodology, manufacturing overhead costs are
ALLOCATION OF MANUFACTURING OVERHEAD COSTS
So, it is possible to mention that mathematical allocation methodology is relatively hard to apply, but gives more accurate results and here the allocation is more sensitive. This sensitivity has important effects on evaluation of success of products, product and cost center planning&control. Also, the application of such a complex methodology may have greater importance especially in corporations that have many cost centers and have a wide range of production. In this study, one of the above mentioned allocation methodologies; “Step-down allocation methodology” is discussed.
2. DETERMINING THE ALLOCATION SEQUENCE IN
STEP-DOWN ALLOCATION
As step-down allocation methodology is not included in ERPs and in cost accounting modules in software packages related with accounting, and/or because of the difficulty in determining an appropriate sequence about costs for each cost calculation period, application related with step-down allocation is mostly rare.
“Step-down allocation methodology” is more sensitive considered to simple (direct) allocation methodology. Step-down allocation methodology considers the turnovers of benefits and services between supplementary cost centers. The reason why this methodology is called as step-down is that it allocates manufacturing overhead costs to primary cost centers not directly and at one time, but step by step. So, it is not easy to apply this methodology such as simple allocation methodology. In step-down allocation methodology, the allocation of costs is made according to specific rules as mentioned below :
The accrued manufacturing overhead costs in supplementary cost centers are allocated only one-time. The allocated manufacturing overhead cost remains “out of the game” (Can,2003:92).
Supplementary cost center does not participate manufacturing overhead costs of itself(Horngern at al.1999:148).
In step-down allocation methodology, it is so important to choose the supplementary cost center from which the allocation will be started. In here, the last remaining supplementary cost centers participate manufacturing overhead cost share from the firstly allocated supplementary cost centers. So, the firstly allocated supplementary cost centers will not participate manufacturing overhead share of themselves from last remaining supplementary cost centers as they are out of the game, as mentioned before. The sequence of allocation of costs and an accurate choice of supplementary cost centers play a very important role in this methodology.
Though the rational determination of allocation sequence in step-down allocation method is so vital, it is obvious that this problem is mostly ignored in literature of cost accounting. In most of the related published books and articles,
Haluk BENGÜ and Ahmet Vecdi CAN
there is only a little bit or a very limited piece of information about the allocation sequence of costs.
The fundamental criteria determining the allocation sequence in step-down allocation methodology is given below:
Amount of manufacturing overhead cost criterion: According to this criterion, the allocation of supplementary cost centers starts from the cost center that has the highest amount of manufacturing overhead cost and this sequence continues till the end of the allocation (Büyükmirza, 2003:212; Karakaya, 2004:322).
Number of cost centers criterion: According to this criterion, the allocation of supplementary cost centers begins with the supplementary cost center that serves the most benefit and service to the other cost centers (Howe, 1969:108; Dearden, 1973:29; Horngern, 1982:420; Hacırüstemoğlu, 1995:170; Yükçü, 2007:261; Gürsoy, 1999:121; Atamanalp et al., 2000:222; Civelek, 2000:130; Küçüksavaş, 2002:190; Kartal, 2003:109; Karakaya, 2004:322; Akdoğan, 2006:374;Haftacı,2009:194;Barfield et al.,1994:225 Horngern et al.,1999:148,) and the allocation goes on considering this criterion till the allocation ends.
Combined criterion: This criterion determines the allocation sequence considering the two above mentioned criteria, respectively. It can be applied in two different ways:
o The allocation sequence is tried to be determined according to the number of cost centers (Yükçü, 1998:216; Atamanalp et al., 2000:222; Kartal, 2003:109). In presence of any equivalence in number, the sequence of allocation is then determined by taking the -highest- amount of manufacturing overhead costs into consideration.
o In situations in which the amounts of manufacturing overhead costs are equal –that this possibility is very low-, the decision is made according to any other criteria mentioned here.
Percentaged weights criterion: According to this criterion, benefits and services that supplementary cost centers receive from each other are taken into consideration in percentages. Percentaged weights criterion can be applied in two different ways as horizontal and vertical percentages:
o The horizontal sums of percentages represent the total amount of manufacturing overhead costs shares of supplementary cost centers that are to be allocated to other supplementary cost centers. The allocation sequence here is made beginning from the highest percentage to the lowest one (Horngern, 1982:421; Civelek, 2000:130).
ALLOCATION OF MANUFACTURING OVERHEAD COSTS o The vertical sums of percentages represent the shares of
manufacturing overhead costs of that the supplementary cost centers will receive from the other supplementary cost centers. Here, the allocation sequence is opposite of the horizontal percentages, that is the allocation begins from the lowest percentage to the highest one.
Allocation effect criterion: This criterion refers to a little bit more complicated and subjective process. Firstly, an allocation simulation is formed in sequence to see the effects of various allocation sequences. Then, according to the results, the sequence of allocation that is thought to have the most powerful allocation effect is preferred.
3. AN APPLICATION ABOUT STEP-DOWN ALLOCATION
METHODOLOGY
In CAN Production Company that has four supplementary cost centers (SCCs) and three primary cost centers (PCCs), three kinds of products named X, Y and Z, respectively, are produced. The Company’s total sum of actual manufacturing overhead costs in November is 42,750,950 TL. The allocation of manufacturing overhead costs to cost centers as the result of 1st allocation are given below:
Table 1: 1st Allocation
SUPPLEMENTARY COST CENTER SUPPLEMENTARY COST CENTER SUPPLEMENTARY COST CENTER
SUPPLEMENTARY COST CENTER PRIMARY COST CENTERPRIMARY COST CENTERPRIMARY COST CENTERPRIMARY COST CENTER
1 11 1stststst SCCSCCSCCSCC 6,755,920 TL PCCPCC A PCCPCCA A A 5,690,900 TL 2 2 2 2ndndndnd SCCSCCSCCSCC 9,766,190 TL PCCPCC BPCCPCCBBB 6,713,470 TL 3 33 3rdrdrdrd SCCSCCSCCSCC 3,957,810 TL PCCPCCPCCPCC CCC C 4,317,280 TL 4 4 4 4thththth SCCSCCSCCSCC 5,549,380 TL TOTAL TOTAL TOTAL TOTAL 26,029,26,029,26,029,26,029,300 TL300 TL300 TL 300 TL 16,721,650 TL16,721,16,721,16,721,650 TL650 TL650 TL 42,750,42,750,42,750,42,750,950 TL950 TL950 TL 950 TL
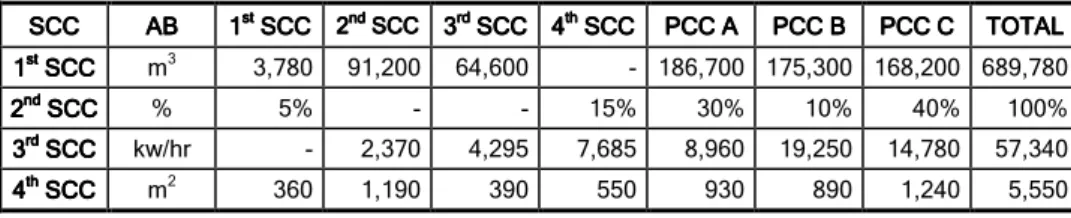
The benefits and services that supplementary cost centers produce and/or support are expressed by allocation bases (ABs) and measures:
Table 2: Bases for 2nd Allocation SCC SCC SCC SCC ABABABAB 1111stststst SCCSCCSCCSCC 2222ndndndnd SCCSCCSCCSCC 3333rdrdrdrd SCCSCCSCC 4SCC 444thththth
SCCSCCSCCSCC PCCPCCPCC APCCAAA PCCPCC BPCCPCCB BB PCCPCCPCCPCC CCCC TOTOTALTOTOTALTALTAL
1 11 1stststst SCCSCCSCCSCC m3 3,780 91,200 64,600 - 186,700 175,300 168,200 689,780 2 2 2 2ndndndnd SCCSCCSCC SCC % 5% - - 15% 30% 10% 40% 100% 3 3 3 3rdrdrdrd SCCSCCSCC SCC kw/hr - 2,370 4,295 7,685 8,960 19,250 14,780 57,340 4 4 4 4thththth SCCSCCSCC SCC m2 360 1,190 390 550 930 890 1,240 5,550
Haluk BENGÜ and Ahmet Vecdi CAN
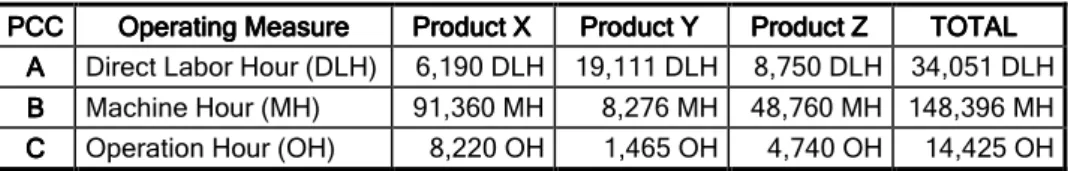
The capacity volumes of primary cost centers are as given below:
Table 3: The Capacity Volumes of Primary Cost Centers
PCC PCCPCC
PCC Operating MeasureOperating MeasureOperating MeasureOperating Measure Product XProduct X Product XProduct X Product Y Product YProduct YProduct Y Product ZProduct ZProduct ZProduct Z TOTALTOTALTOTALTOTAL A
AA
A Direct Labor Hour (DLH) 6,190 DLH 19,111 DLH 8,750 DLH 34,051 DLH
B BB B Machine Hour (MH) 91,360 MH 8,276 MH 48,760 MH 148,396 MH C C C
C Operation Hour (OH) 8,220 OH 1,465 OH 4,740 OH 14,425 OH
And the amount of sales (net), actual direct costs, production and sales quantities of the products are as mentioned below:
Product X Product X Product X
Product X Product YProduct YProduct YProduct Y Product ZProduct ZProduct ZProduct Z Sales (net)
Sales (net) Sales (net)
Sales (net) 26,950,000 TL 36,280,000 TL 25,000,000 TL
Actual Direct Costs Actual Direct Costs Actual Direct Costs
Actual Direct Costs 7,457,600 TL 25,958,000 TL 11,736,500 TL
Production and Sales Quantities Production and Sales Quantities Production and Sales Quantities
Production and Sales Quantities 25,000 units 20,000 units 10,000 units
In this example of application it is assumed that:
o Cost centers are perfectly fictionalized,
o The allocation bases are chosen among the most rational and appropriate bases that reflects the relationships between manufacturing overhead costs and cost centers, and
o The 1st allocation of manufacturing overhead costs to cost centers is made very properly.
3.1. Cursory Allocation
If step-down allocation methodology is conducted cursory, that is without considering any allocation sequence; the conclusion is as given in Table 4. In the Table 4, cost allocation, the allocation of supplementary cost centers has not been made according to any criteria and not any rational assumptions have been made. The allocation has been made in sequence of 1-2-3-4. Most of published books and articles about step-down allocation methodology depict the subject like this.
ALLOCATION OF MANUFACTURING OVERHEAD COSTS Table 4: Cursory Allocation
Allocation Allocation Allocation Allocation Measure MeasureMeasure Measure 1111 st st st st SCCSCCSCC SCC 2222ndndndnd SCCSCCSCCSCC 3333rdrdrdrd SCCSCCSCCSCC 4444thththth
SCCSCCSCC SCC PCCPCC APCCPCCAAA PCCPCC BPCCPCCBB B PCCPCCPCCPCC CCC C TOTALTOTAL TOTALTOTAL 1 1 1 1stststst Allocati Allocati Allocati Allocationononon 6,755,920 TL 9,766,190 TL 3,957,810 TL 5,549,380 TL 5,690,900 TL 6,713,470 TL 4,317,280 TL 42,750,950 TL 1 1 1 1stststst SCCSCCSCC SCC m3 91,200 64,600 0 186,700 175,300 168,200 686,000 6,755,6,755,6,755,6,755,920920920920 TLTLTL TL 898,163 TL 636,199 TL 0 TL 1,838,674 TL 1,726,403 TL 1,656,481 TL 6,755,6,755,9206,755,6,755,920920920 TLTLTLTL 2 22 2ndndndnd SCCSCCSCCSCC % 0 15 30 10 40 95 10,664,10,664,10,664,10,664,353353353 TL353TLTL TL 0 TL 1,683,845 TL 3,367,690 TL 1,122,563 TL 4,490,254 TL 10,664,10,664,10,664,10,664,353353353353 TLTLTLTL 3 33 3rdrdrdrd SCCSCCSCCSCC kw/hr 7,685 8,960 19,250 14,780 50,675 4,594,4,594,4,594,4,594,009009009 TL009TLTLTL 696,694 TL 812,281 TL 1,745,134 TL 1,339,900 TL 4,594,4,594,0094,594,4,594,009009009 TLTLTLTL 4 44 4thththth SCCSCCSCCSCC m2 930 890 1,240 3,060 7,929, 7,929,7,929, 7,929,919919919 TL919TLTLTL 2,410,073 TL 2,306,414 TL 3,213,431 TL 7,929,9197,929,7,929,7,929,919919919 TLTLTLTL 2 2 2 2ndndndnd Allocation Allocation Allocation Allocation 14,119,14,119,14,119,14,119,618618618618 TLTL 13,613,TLTL 13,613,13,613,13,613,985985985985 TLTL 15,017,TLTL 15,017,15,017,34615,017,346346346 TLTL 42,750,TLTL 42,750,42,750,42,750,950950950950 TLTLTLTL PCC A DLH 34,051 PCC B MH 148,396 PCC C OH 14,425 Allocation Allocation Allocation Allocation Ratio Ratio Ratio Ratio 414.66 TL 91.74 TL 1.041.06 TL
Haluk BENGÜ and Ahmet Vecdi CAN
3.2. Allocation According to the Amount of Manufacturing Overhead
Costs
In situation in which step-down allocation methodology is conducted according to criterion of amount of manufacturing overhead costs, the allocation should be made beginning from the supplementary cost center with the highest amount of manufacturing overhead costs to the lowest one as presented below:
In the Table 5, above allocation, supplementary cost centers are allocated in sequence of 2-1-4-3; that is from the highest amount of manufacturing overhead costs to the lowest one. As obviously seen, both shares of manufacturing overhead costs and calculated manufacturing overhead costs’ allocation ratios in cost centers differ.
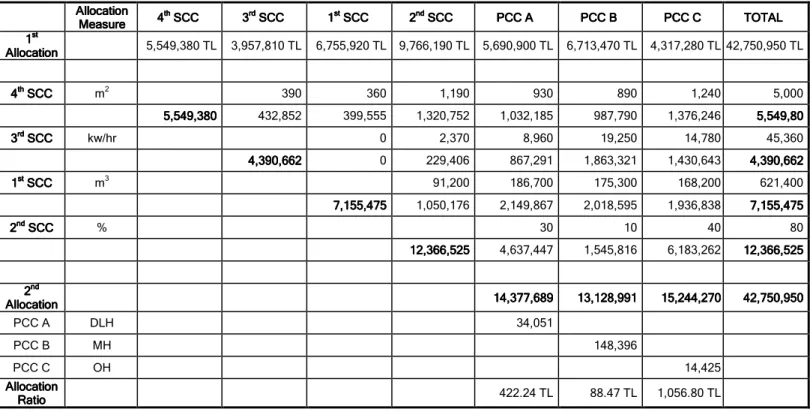
3.3. Allocation According to the Number of Cost Centers
If step-down allocation methodology is conducted according to the number of cost centers, the below given result is achieved:
In the Table 6, the underlying reason about the allocation sequence of 4-3-1-2 is that the 4th cost center produces benefits and services to other cost centers the most in number. However, most of the time it is not possible to make judgments considering just only this criterion. So, in alike situations it is recommended to refer other criteria in determining the cost allocation sequence.
3.4. Allocation According to the Combined Criterion
Allocation according to the combined criterion necessitates the usage of 3.2. and 3.3. criteria. However, first of all it has to be decided to choose one of these criteria. The example of application of the study can be conducted according to the combined criterion as given in Table 7-8
In the Table 7-8, as seen, the sequence of allocation is as 4-1-3-2. This sequence is because of that the 4th supplementary cost center provides benefits and services to other supplementary cost services the most in number. However, as the 1st and 3rd supplementary cost centers provide benefits and services to other cost center equally in number. After this point, the allocation sequence has been determined according to the amount of manufacturing overhead costs of cost centers (1st SCC and 3rd SCC, respectively).
ALLOCATION OF MANUFACTURING OVERHEAD COSTS Table 5: Allocation According to the Amount of Manufacturing Overhead Costs
Allocation Allocation Allocation Allocation Measure MeasureMeasure Measure 2222 nd nd nd nd SCCSCCSCC SCC 1111stststst SCCSCCSCCSCC 4444thththth SCCSCCSCCSCC 3333rdrdrdrd
SCCSCCSCCSCC PCC APCC APCC APCC A PCC B PCC BPCC BPCC B PCC CPCC CPCC CPCC C TOTALTOTAL TOTALTOTAL 1
1 1
1stststst AllocationAllocationAllocationAllocation 9,766,190 TL 6,755,920 TL 5,549,380 TL 3,957,810 TL 5,690,900 TL 6,713,470 TL 4,317,280 TL 42,750,950 TL 2 22 2ndndndnd SCCSCCSCCSCC % 5 15 0 30 10 40 100 9,766,9,766,9,766,9,766,190190190190 488,310 1,464,929 0 2,929,857 976,619 3,906,476 9,766,9,766,1909,766,9,766,190190190 1 11 1stststst SCCSCCSCC SCC m3 0 64,600 186,700 175,300 168,200 594,800 7,244,7,244,7,244,7,244,230230230 230 0 786,781 2,273,870 2,135,026 2,048,553 7,244,7,244,2307,244,7,244,230230230 4 4 4 4thththth SCCSCCSCC SCC m2 390 930 890 1,240 3,450 7,07,07,07,014,14,14,30914,309309 309 792,922 1,890,814 1,809,488 2,521,085 7,014,7,014,3097,014,7,014,309309309 3 3 3 3rdrdrdrd SCCSCCSCC SCC kw/hr 8,960 19,250 14,780 42,990 5,537, 5,537, 5,537, 5,537,513513513513 1,154,132 2,479,579 1,903,802 5,537,5,537,5135,537,5,537,513513513 2 2 2 2ndndndnd
AllocationAllocation AllocationAllocation 13,939,13,939,13,939,13,939,572572572 572 14,114,14,114,14,114,14,114,183183 183183 14,697,14,697,19614,697,14,697,196196196 42,750,42,750,42,750,42,750,950950950950
PCC A DLH 34,051 PCC B MH 148,396 PCC C OH 14,425 Allocation Allocation Allocation Allocation Ratio Ratio Ratio Ratio 409.37 TL 95.11 TL 1,018.87 TL
Haluk BENGÜ and Ahmet Vecdi CAN
Table 6: Allocation According to the Number of Cost Centers
Allocation Allocation Allocation Allocation Measure Measure Measure Measure 4444 th th th th SCCSCCSCCSCC 3333rdrdrdrd SCCSCCSCCSCC 1111stststst SCCSCCSCC SCC 2222ndndndnd
SCCSCCSCCSCC PCC APCC APCC APCC A PCC B PCC BPCC BPCC B PCC CPCC C PCC CPCC C TOTALTOTAL TOTALTOTAL 1 11 1stststst Allocation AllocationAllocation Allocation 5,549,380 TL 3,957,810 TL 6,755,920 TL 9,766,190 TL 5,690,900 TL 6,713,470 TL 4,317,280 TL 42,750,950 TL 4 4 4 4thththth SCCSCCSCCSCC m2 390 360 1,190 930 890 1,240 5,000 5,549,5,549,3805,549,5,549,380380380 432,852 399,555 1,320,752 1,032,185 987,790 1,376,246 5,549,5,549,805,549,5,549,808080 3 3 3 3rdrdrdrd SCCSCCSCC SCC kw/hr 0 2,370 8,960 19,250 14,780 45,360 4,390,4,390,6624,390,4,390,662662662 0 229,406 867,291 1,863,321 1,430,643 4,390,4,390,4,390,4,390,662662662662 1 1 1 1stststst SCCSCCSCCSCC m3 91,200 186,700 175,300 168,200 621,400 7,155,7,155,4757,155,7,155,475475475 1,050,176 2,149,867 2,018,595 1,936,838 7,155,7,155,7,155,7,155,475475475475 2 2 2 2ndndndnd SCCSCCSCCSCC % 30 10 40 80 12,366, 12,366, 12,366, 12,366,525525525525 4,637,447 1,545,816 6,183,262 12,366,12,366,12,366,12,366,525525525525 2 2 2 2ndndndnd Allocation AllocationAllocation Allocation 14,377,14,377,14,377,14,377,689689689689 13,128,13,128,13,128,13,128,991991 991991 15,244,15,244,27015,244,15,244,270270270 42,750,42,750,42,750,42,750,950950950950 PCC A DLH 34,051 PCC B MH 148,396 PCC C OH 14,425
ALLOCATION OF MANUFACTURING OVERHEAD COSTS Table 7: Allocation According to the Combined Criterion
Allocation Allocation Allocation Allocation Measure MeasureMeasure Measure 4444 th th th th SCCSCCSCCSCC 1111stststst SCCSCCSCCSCC 3333rdrdrdrd SCCSCCSCC SCC 2222ndndndnd
SCCSCCSCCSCC PCC APCC APCC APCC A PCC B PCC BPCC BPCC B PCC CPCC CPCC CPCC C TOTALTOTAL TOTALTOTAL 1 11 1stststst Allocation Allocation Allocation Allocation 5,549,380 TL 6,755,920 TL 3,957,810 TL 9,766,190 TL 5,690,900 TL 6,713,470 TL 4,317,280 TL 42,750,950 TL 4 4 4 4thththth SCCSCCSCCSCC m2 360 390 1,190 930 890 1,240 5,000 5,549,5,549,5,549,5,549,380380380 380 399,555 432,852 1,320,752 1,032,185 987,790 1,376,246 5,549,5,549,3805,549,5,549,380380380 1 1 1 1stststst SCCSCCSCCSCC m3 64,600 91,200 186,700 175,300 168,200 686,000 7,155,7,155,7,155,7,155,474747547555 673,825 951,282 1,947,416 1,828,506 1,754,447 7,155,7,155,4757,155,7,155,475475475 3 3 3 3rdrdrdrd SCCSCCSCC SCC kw/hr 2,370 8,960 19,250 14,780 45,360 5,064,5,064,4865,064,5,064,486486486 264,613 1,000,392 2,149,280 1,650,201 5,064,5,064,4865,064,5,064,486486486 2 2 2 2ndndndnd SCCSCCSCC SCC % 30 10 40 80 12,302, 12,302, 12,302, 12,302,837837837837 4,613,564 1,537,855 6,151,419 12,302,12,302,12,302,12,302,837837837837 2 2 2 2ndndndnd Allocation Allocation Allocation Allocation 14,284,14,284,45714,284,14,284,457457 457 13,216,13,216,13,216,13,216,900900 900900 15,249,15,249,59315,249,15,249,593593 593 42,750,42,750,42,750,42,750,950950950950 PCC A DLH 34,051 PCC B MH 148,396 PCC C OH 14,425 Allocation Allocation Allocation Allocation Ratio Ratio Ratio Ratio 419.50 TL 89.07 TL 1,057.16 TL
Haluk BENGÜ and Ahmet Vecdi CAN
Table 8.: The Allocation Order
SCC
SCCSCC
SCC Allocation Allocation Allocation Allocation
Measure Measure Measure Measure Manufacturing Manufacturing Manufacturing Manufacturing O O O
Overheadverheadverhead CostsverheadCostsCostsCosts 1 11 1stststst SCC SCC SCC SCC 2 2 2 2ndndndnd SCC SCC SCC SCC 3 33 3rdrdrdrd SCC SCC SCC SCC 4 44 4thththth SCC SCC SCC SCC Number Number Number Number of Cost of Cost of Cost of Cost Centers CentersCenters Centers Refined Refined Refined Refined 1 1 1 1stststst SCC SCCSCC SCC m 3 6,755,920 TL 3,780 91,200 64,600 - 3 2 2 22 2ndndndnd SCC SCCSCC SCC % 9,766,190 TL 5% - - 15% 2 2 3 33 3rdrdrdrd SCC SCCSCC SCC kw/hr 3,957,810 TL - 2,370 4,295 7,685 3 2 4 44 4thththth SCC SCCSCC SCC m 2 5,549,380 TL 360 1,190 390 550 4 3
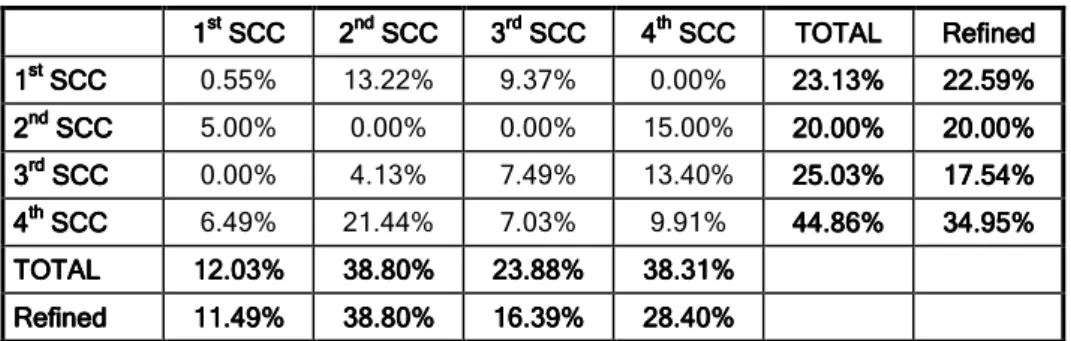
3.5. Allocation According to the Percentaged Weights Criterion
As mentioned before, allocation according to this criterion can be conducted basically in two ways. As seen in the table below, the sequence of allocation is as 4-1-2-3 according to the sum of refined horizontal percentages and as 1-3-4-2 according to the sum of refined vertical percentages. Refining process can be made in two ways:
1. After calculating the percentages, if there is, the own percentage of each supplementary cost center is subtracted and refined value is calculated. This is the most practical way.
2. Before calculating the percentages, if there is, the own share of each supplementary cost center is subtracted and the refined values are calculated from the start point of refined shares. Though this is not so practical, it gives more healthy results.
Table 9: Allocation Bases in Percentages
1111stststst SCCSCCSCCSCC 2222ndndndnd SCCSCCSCC SCC 3333rdrdrdrd SCCSCCSCC SCC 4444thththth SCCSCCSCC SCC TOTALTOTAL TOTALTOTAL RefinedRefinedRefinedRefined 1 11 1stststst SCCSCCSCC SCC 0.55% 13.22% 9.37% 0.00% 23.13%23.23.23.13%13%13% 22.22.59%22.22.59%59% 59% 2 22 2ndndndnd SCCSCCSCC SCC 5.00% 0.00% 0.00% 15.00% 20.00%20.20.20.00%00%00% 20.20.00%20.20.00%00% 00% 3 33 3rdrdrdrd SCCSCCSCC SCC 0.00% 4.13% 7.49% 13.40% 25.03%25.25.25.03%03%03% 17.17.54%17.17.54%54% 54% 4 44 4thththth SCCSCCSCCSCC 6.49% 21.44% 7.03% 9.91% 44.86%44.44.44.86%86%86% 34.34.95%34.34.95%95% 95% TO TOTO
TOTALTALTALTAL 12.12.12.12.03%03%03%03% 38.38.38.38.80%80% 80%80% 23.23.23.23.88%88%88%88% 38.38.31%38.38.31%31%31% Refined
RefinedRefined
Refined 11.11.11.11.49%49%49%49% 38.38.38.38.80%80% 80%80% 16.16.16.16.39%39%39%39% 28.28.40%28.28.40%40%40%
ALLOCATION OF MANUFACTURING OVERHEAD COSTS Table 10: Allocation According to the Refined Horizontal Percentages
Allocation Allocation Allocation Allocation Measure Measure Measure Measure 4444 th thth th SCCSCCSCCSCC 1111stststst SCCSCCSCC SCC 2222ndndndnd SCCSCCSCCSCC 3333rdrdrdrd
SCCSCCSCC SCC PCC APCC APCC APCC A PCC B PCC BPCC BPCC B PCC CPCC C PCC CPCC C TOTALTOTAL TOTALTOTAL 1
1 1 1stststst
AlloAlloAlloAllocationcationcationcation 5,549,380 TL 6,755,920 TL 9,766,190 TL 3,957,810 TL 5,690,900 TL 6,713,470 TL 4,317,280 TL 42,750,950 TL 4 4 4 4thththth SCCSCCSCC SCC m2 360 1,190 390 930 890 1,240 5,000 5,549,5,549,5,549,5,549,380380380 380 399,555 1.320,752 432,852 1,032,185 987,790 1,376,246 5,549,5,549,5,549,5,549,380380380380 1 11 1stststst SCCSCCSCC SCC m3 91,200 64,600 186,700 175,300 168,200 686,000 7,155,7,155,7,155,7,155,475475475475 951,282 673,825 1,947,416 1,828,506 1,754,447 7,155,7,155,7,155,7,155,475475475475 2 2 2 2ndndndnd SCCSCCSCC SCC % 0 30 10 40 80 12,038,12,038,12,038,12,038,224224224224 0 4,514,334 1,504,778 6,019,112 12,038,12,038,22412,038,12,038,224224224 3 3 3 3rdrdrdrd SCCSCCSCCSCC kw/hr 8,960 19,250 14,780 42,990 5,064, 5,064, 5,064, 5,064,486486486 486 1,055,543 2,267,768 1,741,175 5,064,5,064,5,064,5,064,486486486486 2 22 2ndndndnd Allocation Allocation Allocation Allocation 14,240,14,240,14,240,14,240,378378378378 13,302,13,302,13,302,13,302,312312 312312 15,208,15,208,26115,208,15,208,261261 261 42,750,42,750,95042,750,42,750,950950950 PCC A DLH 34,051 PCC B MH 148,396 PCC C OH 14,425 Allocation Allocation Allocation Allocation Ratio Ratio Ratio Ratio 418.21 TL 89.64 TL 1,054.30 TL
Haluk BENGÜ and Ahmet Vecdi CAN
According the refined vertical percentages, the cost allocation is as below:
Table 11.: Allocation According to the Refined Vertical Percentages
Allocation Allocation Allocation Allocation Measure MeasureMeasure Measure 1111 st st st st SCCSCCSCCSCC 3333rdrdrdrd SCCSCCSCCSCC 4444thththth SCCSCCSCCSCC 2222ndndndnd
SCCSCCSCC SCC PCC APCC APCC APCC A PCC B PCC BPCC BPCC B PCC CPCC CPCC CPCC C TOTALTOTALTOTALTOTAL 1 1 1 1sssstttt Allocation Allocation Allocation Allocation 6,755,920 TL 3,957,810 TL 5,549,380 TL 9,766,190 TL 5,690,900 TL 6,713,470 TL 4,317,280 TL 42,750,950 TL 1 1 1 1stststst SCCSCCSCCSCC m3 64,600 0 91,200 186,700 175,300 168,200 686,000 6,755,6,755,6,755,6,755,920920920 920 636,199 0 898,163 1,838,674 1,726,403 1,656,481 6,756,756,756,755,5,5,9205,920920 920 3 33 3rdrdrdrd SCCSCCSCCSCC kw/hr 7,685 2,370 8,960 19,250 14,780 53,045 4,594,4,594,4,594,4,594,009009009009 665,566 205,256 775,989 1,667,163 1,280,035 4,594,4,594,4,594,4,594,009009009 009 4 44 4thththth SCCSCCSCCSCC m2 1,190 930 890 1,240 4,250 6,214,6,214,9466,214,6,214,946946946 1,740,185 1,359,976 1,301,483 1,813,302 6,214,6,214,6,214,6,214,946946946 946 2 22 2ndndndnd SCCSCCSCCSCC % 30 10 40 80 12,609, 12,609,12,609, 12,609,794794794 794 4,728,673 1,576,224 6,304,897 12,609,12,609,79412,609,12,609,794794 794 2 2 2 2ndndndnd Allocation Allocation Allocation Allocation 14,394,14,394,14,394,14,394,212212212212 12,984,12,984,12,984,12,984,744744 744744 15,371,915,371,99515,371,915,371,9959595 42,750,42,750,95042,750,42,750,950950 950 PCC A DLH 34,051 PCC B MH 148,396 PCC C OH 14,425
ALLOCATION OF MANUFACTURING OVERHEAD COSTS
765
As it is seen, even the application of the criterion of percentaged weigths may give different results in itself.
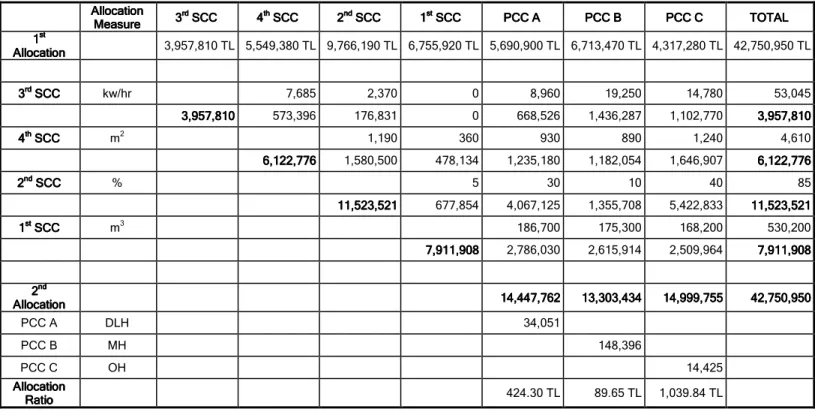
3.6. Allocation According to the Allocation Effect Criterion
As mentioned before, this criterion refers to a more complicated and subjective process. Firstly, an allocation simulation is formed in sequence to see the effects of various allocation sequences. Then, according to the results, the sequence of allocation that is thought to have the most powerful allocation effect is preferred and allocation is made according to this sequence.
In below, the allocation sequence is determined as 3-4-2-1 and allocation has been conducted according to this sequence. However, as a specification of this criterion, it is not possible that the allocation sequence choice is objective. Here, how the choice of allocation sequence is made can be explained by subjective judgments of decision-makers. Also, this choice may be a result of company’s expectations and interferences. This allocation methodology is extremely subjective. However, as the simulation shows the effects and consequences of allocation previously, it is definitely not casual, but a very rational choice and prevents possible surprises.
Haluk BENGÜ and Ahmet Vecdi CAN
Table 12.: Allocation According to the Allocation Effect Criterion
Allocation Allocation Allocation Allocation Measure MeasureMeasure Measure 3333 rd rdrd rd SCCSCCSCC SCC 4444thththth SCCSCCSCC SCC 2222ndndndnd SCCSCCSCCSCC 1111stststst
SCCSCCSCC SCC PCC APCC APCC APCC A PCC B PCC BPCC BPCC B PCC CPCC C PCC CPCC C TOTALTOTAL TOTALTOTAL 1 1 1 1stststst Allocation AllocationAllocation Allocation 3,957,810 TL 5,549,380 TL 9,766,190 TL 6,755,920 TL 5,690,900 TL 6,713,470 TL 4,317,280 TL 42,750,950 TL 3 3 3 3rdrdrdrd SCCSCCSCCSCC kw/hr 7,685 2,370 0 8,960 19,250 14,780 53,045 3,957,3,957,3,957,3,957,810810810 810 573,396 176,831 0 668,526 1,436,287 1,102,770 3,957,3,957,8103,957,3,957,810810810 4 4 4 4thththth SCCSCCSCCSCC m2 1,190 360 930 890 1,240 4,610 6,122,76,122,7766,122,76,122,77676 76 1,580,500 478,134 1,235,180 1,182,054 1,646,907 6,122,6,122,7766,122,6,122,776776776 2 2 2 2ndndndnd SCCSCCSCCSCC % 5 30 10 40 85 11,523,11,523,11,523,11,523,521521521521 677,854 4,067,125 1,355,708 5,422,833 11,523,11,523,11,523,11,523,521521521521 1 1 1 1stststst SCCSCCSCCSCC m3 186,700 175,300 168,200 530,200 7,911, 7,911, 7,911, 7,911,908908908908 2,786,030 2,615,914 2,509,964 7,911,7,911,9087,911,7,911,908908908 2 2 2 2ndndndnd Allocation AllocationAllocation Allocation 14,447,14,447,14,447,14,447,762762762762 13,303,13,303,13,303,13,303,434434434 434 14,999,75514,999,14,999,14,999,755755755 44442,750,2,750,2,750,9502,750,950950950 PCC A DLH 34,051 PCC B MH 148,396 PCC C OH 14,425
ALLOCATION OF MANUFACTURING OVERHEAD COSTS
4. THE COMPARISON OF CRITERIA DETERMINING THE
ALLOCATION SEQUENCE
The above results of step-down allocation according to different criteria are compared below. In this comparison, only the results calculated according to allocation effect criterion are not included because of the subjectivity of this criterion. As seen in the table below, the differentiation of criteria determining the allocation sequence affects the allocation results and shares received by cost centers from manufacturing overhead costs. So, it is possible to conclude that this situation may have important effects on cost planning, cost controlling and performance measurement and evaluation.
Table 13.: Comparison of Cost Centers
COST COST COST COST CENTER CENTER CENTER CENTER Cursory Cursory Cursory Cursory Allocation Allocation Allocation Allocation Allocation Allocation Allocation Allocation According to According to According to According to the Amount of the Amount of the Amount of the Amount of MOC MOC MOC MOC Allocation Allocation Allocation Allocation According to According to According to According to the Number of the Number of the Number of the Number of Cost Centers Cost CentersCost Centers Cost Centers Allocation Allocation Allocation Allocation According to According to According to According to tttthe Combined he Combined he Combined he Combined
Methodology MethodologyMethodology Methodology Allocation Allocation Allocation Allocation According to According to According to According to the Horizontal the Horizontal the Horizontal the Horizontal Percentage Percentage Percentage Percentage Allocation Allocation Allocation Allocation According to According to According to According to the Vertical the Vertical the Vertical the Vertical Percentage PercentagePercentage Percentage 1 1 1 1stststst SCCSCCSCCSCC 6,755,920 TL 7,244,230 TL 7,155,475 TL 7,155,475 TL 7,155,475 TL 6,755,920 TL 2 2 2 2ndndndnd SCC SCC SCC SCC 10,664,353 TL 9,766,190 TL 12,366,525 TL 12,302,837 TL 12,038,224 TL 12,609,794 TL 3 3 3 3rdrdrdrd SCCSCCSCCSCC 4,594,009 TL 5,537,513 TL 4,390,662 TL 5,064,486 TL 5,064,486 TL 4,594,009 TL 4 4 4 4thththth SCCSCCSCC SCC 7,292,919 TL 7,014,309 TL 5,549,380 TL 5,549,380 TL 5,549,380 TL 6,214,946 TL TOTAL TOTAL TOTAL TOTAL 29,307,201 TL 29,562,242 TL 29,462,042 TL 30,072,178 TL 29,807,566 TL 30,174,669 TL PCC A PCC A PCC A PCC A 14,119,618 TL 13,939,572 TL 14,377,689 TL 14,284,457 TL 14,240,378 TL 14,394,212 TL PCC B PCC B PCC B PCC B 13,613,985 TL 14,114,183 TL 13,128,991 TL 13,216,900 TL 13,302,312 TL 12,984,744 TL PCC C PCC C PCC C PCC C 15,017,346 TL 14,697,196 TL 15,244,270 TL 15,249,593 TL 15,208,261 TL 15,371,995 TL T T T
TOTALOTALOTAL OTAL 42,750,949 TL 42,750,951 TL 42,750,950 TL 42,750,950 TL 42,750,950 TL 42,750,950 TL
Allocation overhead rates calculated for primary cost centers according to different criteria are given below:
Table 14.: Allocation Rates
COST COST COST COST CENTER CENTER CENTER CENTER Cursory Cursory Cursory Cursory Allocation Allocation Allocation Allocation Allocation Allocation Allocation Allocation According to According to According to According to the Amount of the Amount of the Amount of the Amount of MOC MOC MOC MOC Allocation Allocation Allocation Allocation According to According to According to According to the Number of the Number of the Number of the Number of Cost Centers Cost Centers Cost Centers Cost Centers Allocation Allocation Allocation Allocation According to According to According to According to the Combined the Combined the Combined the Combined Methodology Methodology Methodology Methodology Allocation AllocationAllocation Allocation According to According to According to According to the Horizontal the Horizontal the Horizontal the Horizontal Percentage Percentage Percentage Percentage Allocation Allocation Allocation Allocation According to According to According to According to the Vertical the Vertical the Vertical the Vertical Percentage PercentagePercentage Percentage PCC A PCC A PCC A PCC A 414.66 TL/DLH 409.37 TL/DLH 422.24 TL/DLH 419.50 TL/DLH 418.21 TL/DLH 422.73 TL/DLH PCC B PCC B PCC B PCC B 91.74 TL/MH 95.11 TL/MH 88.47 TL/MH 89.07 TL/MH 89.64 TL/MH 87.50 TL/MH PCC C PCC C PCC C
PCC C 1,041.06 TL/OH 1,018.87 TL/OH 1,056.80 TL/OH 1,057.16 TL/OH 1,054.30 TL/OH 1,065.65 TL/OH
The differentiation of allocation ratios also causes shares of manufacturing overhead costs to the product parties. The shares of product parties that will be charged of manufacturing overhead costs are given below:
Haluk BENGÜ and Ahmet Vecdi CAN PR O D U C T PR O D U C T PR O D U C T PR O D U C T Cursory Cursory Cursory Cursory Allocation AllocationAllocation Allocation Allocation Allocation Allocation Allocation According According According According to the to the to the to the Amount of Amount of Amount of Amount of MOC MOC MOC MOC Allocation Allocation Allocation Allocation According According According According to the Number to the Number to the Number to the Number
of of of of Cost CentersCost CentersCost CentersCost Centers
Allocation Allocation Allocation Allocation According to the According to the According to the According to the Combined Combined Combined Combined Methodology MethodologyMethodology Methodology Allocation Allocation Allocation Allocation Ac AcAc According to cording to cording to cording to
the the the the Horizontal Horizontal Horizontal Horizontal Percentage Percentage Percentage Percentage Allocation Allocation Allocation Allocation According According According According to to to to the Vertical the Vertical the Vertical the Vertical Percentage Percentage Percentage Percentage X X X X 19,505,746.30 TL 19,598,526.85 TL 19,383,384.12 TL 19,423,590.59 TL 19,444,608.16 TL 19,370,365.13 TL Y Y Y Y 10,208,990.89 TL 10,103,321.79 TL 10,349,830.65 TL 10,302,947.44 TL 10,278,773.91 TL 10,364,030.82 TL Z ZZ Z 13,036,212.81 TL 13,049,101.36 TL 13,017,735.23 TL 13,024,411.97 TL 13,027,567.93 TL 13,016,554.05 TL TOTAL TOTALTOTAL TOTAL 42,750,950.00 TL 42,750,950.00 TL 42,750,950.00 TL 42,750,950.00 TL 42,750,950.00 TL 42,750,950.00 TL
The differentiation of shares that will be charged from manufacturing overhead costs on product parties also causes total production costs to differ:
PR O D U C T PR O D U C T PR O D U C T PR O D U C T Cursory Cursory Cursory Cursory Allocation Allocation Allocation Allocation Allocation Allocation Allocation Allocation According According According According to the to the to the to the Amount of Amount of Amount of Amount of MOC MOC MOC MOC Allocation Allocation Allocation Allocation According According According According to t to tto t to thehehehe Number of Number of Number of Number of Cost CentersCost CentersCost CentersCost Centers
Allocation Allocation Allocation Allocation According to the According to the According to the According to the Combined Combined Combined Combined Methodology Methodology Methodology Methodology Allocation Allocation Allocation Allocation According to According to According to According to the the the the Horizontal Horizontal Horizontal Horizontal Percentage PercentagePercentage Percentage Allocation Allocation Allocation Allocation According to According to According to According to the Vertical the Vertical the Vertical the Vertical Percentage Percentage Percentage Percentage X X X X 26,963,346.30 TL 27,056,126.85 TL 26,840,984.12 TL 26,881,190.59 TL 26,902,208.16 TL 26,827,965.13 TL Y Y Y Y 36,166,990.89 TL 36,061,321.79 TL 36,307,830.65 TL 36,260,947.44 TL 36,236,773.91 TL 36,322,030.82 TL Z Z Z Z 24,772,712.81 TL 24,785,601.36 TL 24,754,235.23 TL 24,760,911.97 TL 24,764,067.93 TL 24,753,054.05 TL TOTAL TOTALTOTAL TOTAL 87,903,050.00 TL 87,903,050.00 TL 87,903,050.00 TL 87,903,050.00 TL 87,903,050.00 TL 87,903,050.00 TL
As it is assumed that all products are sold in the mentioned period (November), sales profits/losses are calculated as below:
P R O D U C T P R O D U C T P R O D U C T P R O D U C T Cursory Cursory Cursory Cursory Allocation Allocation Allocation Allocation Alloc Alloc Alloc Allocation ation ation ation According According According According to the to the to the to the Amount of Amount of Amount of Amount of MOC MOCMOC MOC Allocation Allocation Allocation Allocation According According According According to the to theto the to the Number Number Number Number of of of of Cost CentersCost CentersCost CentersCost Centers
Allocation Allocation Allocation Allocation According to the According to the According to the According to the Combined Combined Combined Combined Methodology MethodologyMethodology Methodology Allocation Allocation Allocation Allocation According to According to According to According to the the the the Horizontal Horizontal Horizontal Horizontal Percentage Percentage Percentage Percentage Allocation Allocation Allocation Allocation According According According According to to to to the Vertical the Vertical the Vertical the Vertical Percentage Percentage Percentage Percentage X X X X -13,346.30 TL -106,126.85 TL 109,015.88 TL 68,809.41 TL 47,791.84 TL 122,034.87 TL Y Y Y Y 113,009.11 TL 218,678.21 TL -27,830.65 TL 19,052.56 TL 43,226.09 TL -42,030.82 TL Z Z Z Z 227,287.19 TL 214,398.64 TL 245,764.77 TL 239,088.03 TL 235,932.07 TL 246,945.95 TL TOTAL TOTAL TOTAL TOTAL 326,950.00 TL 326,950.00 TL 326,950.00 TL 326,950.00 TL 326,950.00 TL 326,950.00 TL
The results show that it is so important to properly determine the allocation sequence in step-down allocation methodology. Though the methodology remains the same, it is obviously seen that criteria used to determine the allocation sequence differentiates not only manufacturing overhead costs of
ALLOCATION OF MANUFACTURING OVERHEAD COSTS
5. CONCLUSION
It is known that the origins of cost accounting are not as old as the origins of accounting itself. It is also obvious that the theory of cost accounting is not efficient and effective for today’s contemporary businesses’ needs and desires, as it is designed for the requirements of old-fashioned manufacturing companies. The cost structures of today’s manufacturing companies shift from direct costs to indirect costs day by day. Consequently, the allocation of manufacturing overhead costs to products has become the major area of interest in accounting. This has led the businessmen -operating especially in capital/technology/knowledge intensive companies- to focus more on cost accounting, and the concept “cost management” has changed into a wider concept “strategic cost management”.
In this study, step-down allocation methodology is discussed by an example of application. The main difficulty of the step-down allocation methodology is to determine from which supplementary cost center the cost allocation will start. For this reason, this study mostly focuses on the mentioned difficulty.
In this study, additional criteria used to determine the sequence of allocation have been developed. And the previously used and newly developed criteria have been both discusses under a numerical application. The seven different criteria in this study have been presented in the table given below:
Table 15.: Evaluation of Criteria Used to Determine the Allocation Sequence
Allocation Allocation SequenceAllocation Allocation SequenceSequenceSequence (from left to right)(from left to right)(from left to right)(from left to right)
Criteria Used to Determine the Criteria Used to Determine the Criteria Used to Determine the Criteria Used to Determine the Allocation
Allocation Allocation
Allocation SequenceSequenceSequenceSequence
1 1 1 1stststst Sequence Sequence Sequence Sequence 2 2 2 2ndndndnd Sequence Sequence Sequence Sequence 3 3 3 3rdrdrdrd Sequence SequenceSequence Sequence 4 44 4thththth Sequence Sequence Sequence Sequence 1 Cursory Allocation 1st SCC 2nd SCC 3rd SCC 4th SCC
2 Allocation According to the Amount
of Manufacturing overhead Costs 2
nd
SCC 1st
SCC 4th
SCC 3rd
SCC
3 Allocation According to the Number
of Cost Centers 4 th SCC 3rd SCC 1st SCC 2nd SCC
4 Allocation According to the
Combined Criterion 4
th
SCC 1st SCC 3rd SCC 2nd SCC
5 Allocation According to the Refined
Horizontal Percentages 4
th
SCC 1st SCC 2nd SCC 3rd SCC
6 Allocation According to the Refined
Vertical Percentages 1
st
SCC 3rd SCC 4th SCC 2nd SCC
7 Allocation According to the
Allocation Effect Criterion 3
rd
SCC 4th SCC 2nd SCC 1st SCC
The application of the study reveals out two important causes and effects on cost allocation criteria:
Haluk BENGÜ and Ahmet Vecdi CAN
The above mentioned criteria have important causes and effects on cost planning and control of cost centers.
These criteria have also important causes and effects on product costing and product pricing.
The results of this study is more important for high-tech companies of that the profit margins are relatively low; products are more differentiated; cost centers are many in number and manufacturing costs are relatively high.
In especially production companies in which profitability margins are relatively low, that have a wide range of product variety and that uses high technological equipments in production stages, the causes and effects mentioned above may be relatively vital for the survival of the company. Such companies should have to:
First of all, manufacturing overhead costs should have to be determined properly and manufacturing overhead costs that can not be ascertained within a short period should have to be estimated in a realistic manner,
Cost centers should have to be determined considering both cost planning (by means of planning and control) and responsibility accounting perspectives of the company, and
Allocation bases that represent the relations in a rationalist, coherent and realistic manner should have to be chosen.
Finally, it is recommended for the production companies to understand the importance of allocation sequence of the costs that they bear in production stages properly.
REFERENCES
Akdoğan, N. (2006): ““Cost Accounting” (In Turkish), Ankara.
Altuğ, O. (2001): “Cost Accounting” (In Turkish), 13th Edition, Türkmen Publications, Istanbul.
Atamanalp, C., Karcioğlu R. And Sevilengül, O. (2000): “Cost Accounting” (In Turkish), Aktif Publications, Istanbul.
Barfield, J. T., Raiborn, C. A.,Kinney, M. R.,(1994), “Cost Accounting” Traditions And Innovations(Second Edition), West Publishing Co. Newyork.
Burch, J. G., (1994),”Cost And Management Accounting,” West Publishing Co. St Pool, Usa
ALLOCATION OF MANUFACTURING OVERHEAD COSTS
Büyükmirza, K. (2003): “Cost And Managerial Accounting” (İnturkish), 9th Edition, Gazi Publications, Ankara.
Can, A.V. (2003): “Cost Accounting” (In Turkish), Sakarya Publications, Sakarya.
Civelek, M. (2000): “Cost Accounting” (In Turkish), A Agent Publications, Istanbul.
Dearden, J. (1973): “Cost Accounting And Financial Control Systems”, Addison Wesley Publishing Company, New York.
Garrıson, R. H., Noreen, E. W.,Brever, P. C., (2008), “Managerial Accounting”(Twelfth Edition), Mcgraw-Hill Irwin,
Gürsoy, T. C. (1999): “Managerial And Cost Accounting”, (In Turkish), 2nd Edition, Istanbul.
Hacirüstemoğlu, R. (1995): “Cost Accounting” (In Turkish), Istanbul.
Haftacı, V.,(2009),“Cost Accounting” (In Turkish),Umuttepe Publications, Kocaeli.
Horngern, T. C.,Bhımanı, A.,Foster, G, Datar, S.M.,(1999), “Management And Cost Accounting”, Prentice Hall,Europa.
Horngern, T. C. (1982): “Cost Accounting: A Managerial Emphasis”, 5th Edition, Prentice-Hall International Inc.
Howe, W. A. (1969): “Cost Accounting”, Scranton, Pennsylvania.
Karakaya, M. (2004): “Cost Accounting” (In Turkish), Gazi Publications, Ankara. Kartal, A. (2003): “Cost Accounting” (In Turkish), A. O. F. Publications, Eskişehir.
Küçüksavaş, N. (2002): “Computer Aided Cost Accounting” (In Turkish), Beta Publications, Istanbul.
Üstün, R. (1994): “Cost Accounting” (In Turkish), 4th Edition, Science & Technique Publications, Istanbul.
Yükçü, S. (2007): “Cost Accounting in the Perspective of Management”, İzmir. Yükçü, S. (1998): “Cost Accounting in the Perspective of Management”, İzmir