High School Principals’ Leadership Roles and Use of Time
Dr. Kennedy Ongaga * Dr. Mary Ombonga Dr. Kim Finch Dr. Jon TurnerMissouri State University, 901 S National Avenue, Springfield MO 65897 USA. * E-mail of the corresponding author: KennedyOngaga@MissouriState.edu Abstract
Time is the most valuable currency in schools. This study describes how successful high school principals reported spending and allocating their time to various leadership tasks using selected items from a study of principal-time use and school effectiveness in Miami-Dade County Public Schools in Florida US. Public high school principals were selected based on their 2019 Missouri School Improvement Program performance indicators and asked to complete either a paper or online survey. Findings show that principals spend more time on management-related activities than curriculum and instruction-related activities. There is a strong association between time-use on curriculum and instruction with both gender and school size. The more leadership experience a principal has, the less time they are likely to spend on school management activities. Time-use on organization management is strongly associated with school size. If instructional leadership is a fundamental priority for principals, then development and support of successful principalship will require a redesign of their roles to free time for instructional leadership. School districts that hire principals from a pool of assistant principals (AP) or invest in principal pipelines, need to develop a strategy to build APs’ instructional and leadership skills.
Keywords: High school principals, principals’ time-use, principals’ roles, successful principals, instructional leadership.
DOI: 10.7176/JEP/11-18-01 Publication date:June 30th 2020 1. Introduction
This study evolves from an on-going larger study, the Dimensions of School Leadership Study (DSLS), that is examining leadership among high school principals in the state of Missouri. The study examines successful high school principals’ use and allocation of time to improve their instructional leadership capacity and increase student achievement using the International Successful School Principals Project (ISSPP) model (Day, 2007).
ISSPP began in England in 2001 and aimed to: (1) collect data from a multiplicity of perspectives, (2) compare successful principal leadership in contexts ranging from small to large schools, (3) identify personal qualities and professional competencies generic to successful school principalship, (4) re-examine existing theoretical perspectives on school leadership through insight derived from new empirical research, and (5) contribute to the scholarly debate on the relationship between principal leadership and school effectiveness and improvement (Day & Leithwood, 2007). Simply put, ISSPP aims to understand what successful principals do in today’s demanding accountability context.
The guiding framework for ISSPP is grounded in four specific models of leadership: (1) leading schools in times of change (Day et al., 2000), (2) successful school leadership (Gurr et al., 2003), (3) leadership for school– community partnerships (Kilpatrick, et al., 2002), and (4) leadership for organizational learning and improved student outcomes (Mulford, et al., 2004). The focus of ISSPP framework is to study and provide a better understanding and insights into what successful principals do to improve schools regardless of context. According to Leithwood (2005), key areas of inquiry that guide this framework include: (1) practices successful principals use, (2) variability of practices across contexts, (3) attributes of successful principal leadership, (4) conditions under which such attributes are heightened or diminished, and (5) characteristics that link principals’ influence to student learning.
According to Green (2013), successful principals lead schools where students are learning, parents are eager to enroll their students, and teachers clamor to teach. These principals are able to “create a community of teachers and parents united in a mission to ensure the best possible education for all of the students. These remarkable leaders have an uncanny ability to successfully respond to the changing needs of schools and students” (p. vii). For this study, successful high school principals were identified by using their school’s performance in Missouri School Improvement Program (MSIP 5) (DESE, 2019, n.d.). (see Table 1). The performance standards are used to recognize the achievement and continuous growth of all students as they prepare for a global economy. The study included principals whose high schools had either met or exceeded 75% of the 2018 state standards or demonstrated improvement in MSIP 5 performance indicators for at least three consecutive years.
Table 1
MSIP 5 Performance Standards and Indicators
Performance Standards Indicators
Academic Achievement Student performance on assessments required by the Missouri Assessment Program (MAP) meets or exceeds the state standard or demonstrates improvement in performance over time.
The percent of students tested on each required MAP assessment meets or exceeds the state standard.
Growth data indicate that students meet or exceed growth expectations.
Subgroup Achievement The performance of students identified on each assessment in identified subgroups, including free/reduced price lunch, racial/ethnic background, English language learners, and students with disabilities, meets or exceeds the state standard or demonstrates required improvement.
College and Career readiness
The percent of graduates who scored at or above the state standard on any department-approved measure(s) of college and career readiness, (e.g., ACT, SAT, COMPASS or Armed Services Vocational Aptitude Battery (ASVAB), meets or exceeds the state standard or demonstrates required improvement.
Performance Standards Indicators
Attendance The percent of students who regularly attend school meets or exceeds the state standard or demonstrates required improvement.
Graduate Rate The percent of students who complete an educational program that meets the graduation requirements as established by the board meets or exceeds the state standard or demonstrates required improvement.
1.1 The Work of School Principals
Most states and school districts have established a series of frameworks, policies, standards, partnerships, and whole-school initiatives aimed at the development and support of effective school leaders. These frameworks have put pressure on school principals to be effective instructional leaders by requiring them to have substantive knowledge of supervisory skills, strategies, and structures that lead to high student achievement. Many experts point out that, while the influence a principal has on fostering school effectiveness is indirect (see, e.g., Hallinger & Heck, 1996a; Hallinger & Murphy, 1985), his or her behavior has a direct effect on the school’s overall climate and on its instructional organization (Sergiovanni & Green, 2015). According to Leithwood et al. (2004), “there are virtually no documented instances of troubled schools being turned around without intervention by a powerful leader. Many other factors may contribute to such turnarounds, but leadership is the catalyst” (p. 5). Studies (e.g., Hallinger, 1996; Grissom & Loeb, 2012; Horng et al., 2009; Green, 2013; Sergiovanni & Green, 2015) describe principals as agents of change, managers, personnel directors, disciplinarians, policymakers, and instructional leaders.
Leithwood and Riehl (2005) conducted a comprehensive review of literature on successful school leadership and concluded that, regardless of context, successful principals focus on four core practices: (1) setting direction, (2) developing people, (3) redesigning the organization, and (4) managing the instructional program. The focus on these areas explains the increased emphasis placed on individual principals to perform and to be held accountable to state standards, which have been developed to guide them as they continually reflect upon and improve their effectiveness throughout their careers.
Contentious in studies on principals is the appropriate balance of these roles and the extent to which they have the time, expertise, and skills to function as instructional leaders. Effective instructional leaders focus on improving student achievement and are “hands-on leaders, engaged with the curriculum and instruction issues, unafraid to work directly with the teachers, and often present in classrooms” (Horng & Loeb, 2010, p. 66). However, studies on how principals actually spend their time (e.g., Grissom, et al., 2010; Horng, et al., 2009) show they rarely measure up to this ideal. A considerable knowledge base of research (e.g., Grissom, et al., 2015; Murphy, 1990; Horng, et al., 2010; May & Supovitz, 2011; May, et al., 2012) reveals that principals spend minimal amounts of time on instructional leadership activities. While there are interventions such as the Wallace
range of economic and socio-cultural settings (rural, urban, suburban), schools led by male/female principals, and schools in which principals have varied leadership experience.
2. Methodology
2.1 Survey Design and Sample Selection
This study comprised selected items from Horng et al. (2009) study of principal-time use and school effectiveness in Miami-Dade County Public Schools in U.S. Items in the survey instrument included information on demographics and professional experience, school characteristics, principals’ work and time-use, and other leadership variables, whose analysis is on-going. The study and protocol were reviewed and approved by the Internal Review Board (IRB) of Missouri State University in March 2019. The names, school addresses, and email addresses of all public high school principals in the state of Missouri were obtained from a database maintained by the Missouri State Department of Elementary and Secondary Education (DESE) on July 2019. Two modes of completing the survey were utilized simultaneously, namely: a link to an online version of the survey designed using Qualtrics, a web-based survey tool, and a paper version of the survey. An envelope containing a cover letter including instructions and a link to the online version of the survey, an informed consent document, the paper survey instrument, and a postage-paid return envelope were mailed to each high school principal at their address. As per the instructions, each principal was guided to complete either the online or paper version of the survey within a three-week mailing deadline. A blanket email alerting the principals of the impending survey mailing was sent to them one week in advance, and three email follow-up reminders to complete and return the survey were sent at one-week intervals after the mailing.
An initial analysis of all 534 public high schools in the state yielded 303 schools that had met our criteria (see Table 1). Surveys were mailed to all principals whose high school had met or exceeded 75% of the 2018 MSIP 5 performance standards (DESE, 2019). Thirty-one surveys were returned as undeliverable by the United States Postal Services. Twenty-three emails were received stating the targeted principal had either retired or changed jobs. Following the first weekly reminder, 26 principals sent out-of-office automatic email responses indicating that they were unavailable until after the survey deadline. One hundred twenty-two surveys were returned (65 paper and 57 online), indicating a response rate of 54% (122 of 223). Twenty-four surveys were dropped from analysis because they were insufficiently complete, leaving a final sample of 98.
Forty (41%) surveys were completed online, and the remaining 58 (59%) were completed on paper. It was noted 45 (78%) of the principals who completed the paper version of the survey were from high schools classified as rural (DESE, 2018). The completed paper survey data were entered into an Excel spreadsheet, and the resulting records were combined with those derived from the online responses. Unique identifiers were added to the records in the combined file. The Excel spreadsheet was imported into IBM SPSS Statistics (Version 24) for data cleaning and analysis.
2.2 Description of time-use measurements
This paper focuses on the section of the survey instrument in which principals were asked to estimate the average number of hours per week they spent working in total and on various leadership activities, which were categorized into five leadership categories/task (see Table 2). These are: (1) curriculum and instructional leadership, (2) internal school management, (3) organization management, (4) internal school relations, and (5) external relations.
These categories and the related activities are similar to the ones used by Horng et al. (2009) to conduct an observational time-use study for high school principals in Miami-Dade County Public Schools. For purposes of these analyses, the five tasks are assumed to be non-overlapping and to encompass all possible activities, such that, theoretically, total worktime comprises time spent on the five tasks. In addition, internal school management, organization management, and internal school relations are considered to be components of school management.
Response choices to the time-use item eliciting total hours worked per week were given as intervals in the following manner: <=10; 11-20; 21-30; 31-40; 41-50; 51-60; >60. Response choices to the remaining time-use items were given as follows: <=10; 11-20; 21-30; 31-40; >40. Values representing range midpoints were substituted to ease interpretation and to allow items to be added together. The interval ‘<=10’ was assumed to mean ‘0-10’. The open intervals ‘>40’ and ‘>60’ were assumed to have a width equivalent to the closed intervals (Hanneman, 2012). The calculated midpoints were rounded down to ease discussion and visualization. The resulting substituted values for total hours worked per week are the following: 5; 15; 25; 35; 45; 55; 65. Substituted values for all other time-use items are as follows: 5; 15; 25; 35; 45. Two computed time-use measurements are used in the analyses, specifically: (1) the sum of all five leadership task items, using substituted midpoint values and (2) the sum of the three leadership task items comprising school management, using substituted midpoint values. The hierarchical nature of the time-use measurements is depicted in Figure 1.
Table 2
Principals’ time-use categories
Category Associated tasks
Curriculum and Instructional leadership (Day-to-Day Instruction and Instructional Program)
Utilizing school meetings
Planning, directing after-school/summer instruction Planning, facilitating professional development for teachers Planning, facilitating PD for prospective principals
Developing an educational program across the school Releasing or counseling teachers
Evaluating curriculum
Using assessment results for program evaluation
Preparing, conducting classroom observations/walk-throughs
Evaluating teachers formally, providing instructional feedback
Coaching teachers informally coaching teachers Teaching students (e.g., tutoring, after-school) Implementing required professional development Using data to inform instruction
School Management
Internal School Management Managing student services (e.g., records, reporting) Managing student discipline
Supervising students (e.g., lunch duty)
Managing schedules (for the school, not personal schedule) Fulfilling (non-SpEd) compliance requirements/paperwork Preparing, implementing, administering standardized tests Managing student attendance-related activities
Fulfilling SpEd requirements (e.g., meetings with parents).
Category Associated Tasks
Organization Management Managing budgets, resources Managing non-instructional staff Maintaining campus facilities
Developing and monitoring a safe school environment Dealing with concerns from staff
Hiring personnel
Interacting or networking with other principals Managing personal, school-related schedule
Internal School Relations Interacting socially with staff about school-related topics Interacting socially with staff about non-school topics Developing relationships with students
Counseling students and/or parents Communicating with parents
Counseling staff (about conflicts with other staff members) Talking informally to teachers about students, not related to instruction
External relations Working with local community members or organizations Utilizing district office meetings or other communications initiated by the district office
Communicating with district office to obtain resources for school (initiated by the principal)
SOURCE: Adapted from Horng, E. L., Klasik, D., & Loeb, S. (2010). Principals time-use and school effectiveness. American Journal of Education 116(4), 491-523.
Note. We combined Day-to-Day Instruction with Instructional Program and called it Curriculum and Instructional leadership.
Figure 1
Hierarchy of time-use measurements
2.3 Statistical Tests
Somers’ d is a nonparametric measure of association, which can be utilized when one of the two variables in a crosstabulation is considered to be dependent and both variables have an ordinal level of measurement. Its value ranges from -1 to +1, indicating a strong negative or strong positive association, respectively. For this paper, time-use variables were treated as the dependent variable when Somers’ d was utilized. It is important to note that any dichotomous variable can be treated like an ordinal variable (Agresti, 2010) and consequently, it is valid to use Somers’ d to assess a relationship between a dichotomous and an ordinal variable. We also use Cohen’s kappa coefficient, which is a measure of agreement between two variables when they are measured on the same response scale and take on a limited number of distinct values (Chen, 2019). The simple observed percent agreement is corrected for chance and is normalized such that the coefficient takes on values ranging from -1 to +1, indicating perfect disagreement to perfect agreement, respectively.
The nonparametric Wilcoxon signed-rank test can be utilized with paired variables that are measured on either an ordinal or interval level (Sheskin, 2011). An additional condition is that the paired differences are a sample from a symmetric distribution. The signed-rank test accounts for the magnitude of the paired differences in addition to their sign (- or +). The Spearman’s rank correlation coefficient measures the strength of a linear association between two ordinal- or interval-level variables, with values ranging from -1 to +1, indicating a strong negative or strong positive linear association, respectively (Lehmann, 2006).
3. Results
The demographics and school characteristics of public high school principals in the state of Missouri included in the final sample of 98 respondents are displayed in Table 3.
Table 3
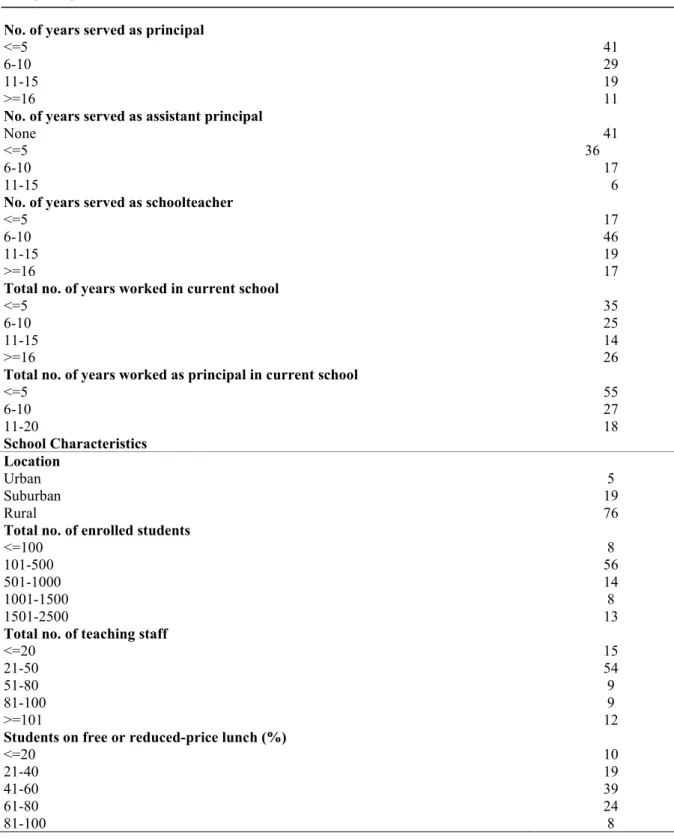
Personal and school characteristics of the survey respondents
Variable Percent (%) Personal Characteristics Gender Female 26 Male 74 Age in years <=45 43 >45 57 Highest degree Masters 21 Specialist 51 Doctorate 28
No. of years served as principal
<=5 41
6-10 29
11-15 19
>=16 11
No. of years served as assistant principal
None 41
<=5 36
6-10 17
11-15 6
No. of years served as schoolteacher
<=5 17
6-10 46
11-15 19
>=16 17
Total no. of years worked in current school
<=5 35
6-10 25
11-15 14
>=16 26
Total no. of years worked as principal in current school
<=5 55 6-10 27 11-20 18 School Characteristics Location Urban 5 Suburban 19 Rural 76
Total no. of enrolled students
<=100 8
101-500 56
501-1000 14
1001-1500 8
1501-2500 13
Total no. of teaching staff
<=20 15
21-50 54
51-80 9
81-100 9
>=101 12
Students on free or reduced-price lunch (%)
<=20 10
21-40 19
41-60 39
61-80 24
81-100 8
3.1 Principal’s Work and Time-use Items
Table 4 displays the six items from the “Principal’s Work and Time-use” section of the survey questionnaire eliciting the average number of hours per week spent at school in total and on five leadership tasks, plus the two summated time variables.
Table 4
Descriptive statistics for the time-use items and computed variables
Survey Items Minimum Maximum Median Median1
On average, how many total hours/week do you work at school?
45 65 55 55.7
On average, how many hours/week do you spend on
Curriculum and Instructional Leadership? 5 25 15 10.8
Internal School Management? 5 45 15 13.6
Organization Management? 5 25 5 10.2
Internal School Relations? 5 45 15 16.8
External Relations? 5 25 5 6.3
Sum of All Tasks2 (computed variable) 25 105 55 57.8
School Management3 (computed variable) 15 85 45 41.1
Note. 1 Median value under assumption of grouped data.
2 The midpoint values assigned to each response level were summated for the five tasks for each respondent. 3 The midpoint values assigned to each response interval were summated for the tasks Internal School Management, Organization Management, and Internal School Relations for each respondent.
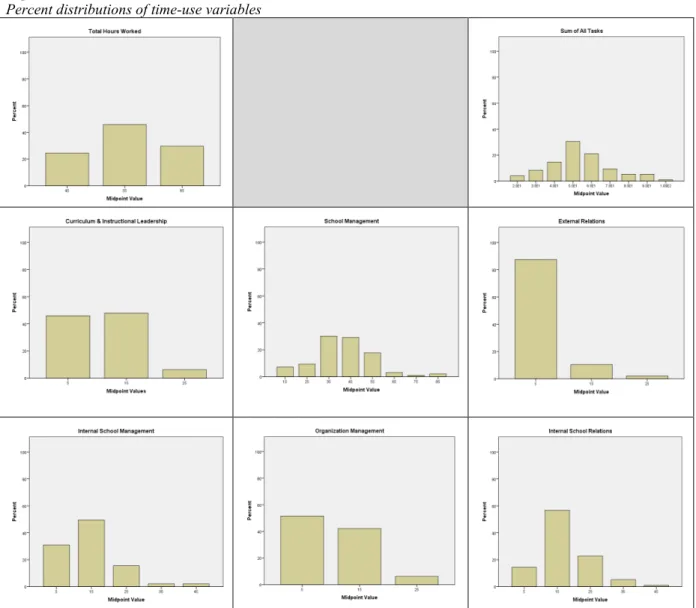
Figure 2 shows the percent of respondents falling into each time interval, with the assigned mid-point values displayed as tickmarks on the horizontal axes.
Figure 2
Percent distributions of time-use variables
Referring to Figure 2 Row 1, the Total Hours Worked (THW) per week ranged from 45 to 65 (based on midpoints), with a median of 55 hours. The computed variable Sum of All Tasks (SAT) ranged from 25 to 105
hours/week, with a median of 55 hours. As anticipated by virtue of the Central Limit Theorem, the frequency distribution of this computed variable simulates a normal distribution.
Moving to Figure 2 Row 2, the hours per week spent on Curriculum and Instructional Leadership (CIL) ranged from 5 to 25, with a median of 15 hours. Only 6% selected a response value >20 hours/week for CIL. The computed variable School Management (SM) ranged from 15 to 85 hours/week, with a median of 45 hours. Like the computed variable Sum of All Tasks (SAT), its frequency distribution simulates a normal distribution in accordance with the Central Limit Theorem. Just 6% had a value >60 hours. Overall, principals spent less time on External Relations (ER). Responses ranged from 5 to 25, with a median of 5 hours. Only 2% selected a response value >20 hours/week for ER.
Moving to Figure 2 Row 3, for the task Internal School Management (ISM), hours spent per week ranged from 5 to 45, with a median of 15. Just 4% selected a response value >30 hours/week for ISM. Overall, principals spent fewer hours per week on Organization Management (OM), which ranged from 5 to 25 and had a median of 5 hours. Only 6% selected a response value >20 hours/week for OM. Hours per week spent on Internal School Relations (ISR) ranged from 5 to 45, with a median of 15 hours. Just 6% selected a response value >30 hours/week for ISR.
3.2 Agreement Between Total Hours Worked and Sum of All Tasks
The reported value for total hours per week worked at school (Total Hours Worked) was crosstabulated against the computed variable Sum of All Tasks to examine congruence (see Table 5). For 30 principals, the values were the same (30/95 or 32%). For 26 principals, the reported value was greater than the computed value (26/95 or 27%). For the remaining 39 principals, the reported value was less than the computed value (39/95 or 41%). Cohen’s kappa coefficient for this comparison was 0.10 (p=0.05).
Table 5
Total Hours Worked by Sum of All Tasks1
25 35 45 55 65 75 85 95 105 Total 25 0 0 0 0 0 0 0 0 0 35 0 0 0 0 0 0 0 0 0 45 4 1 5 6 5 0 0 1 0 22 55 0 5 6 18 8 7 0 1 0 45 65 0 2 3 5 7 2 5 3 1 28 75 0 0 0 0 0 0 0 0 0 85 0 0 0 0 0 0 0 0 0 95 0 0 0 0 0 0 0 0 0 105 0 0 0 0 0 0 0 0 0 Total 4 8 14 29 20 9 5 5 1 95
Note. 1Midpoint value assigned to each time interval on both axes
The bivariate relationship of the two variables is depicted using a pyramid chart (see Figure 3). As shown, the distribution of responses provided by the principals, Total Hours Worked, is symmetric and narrow. The modal response was 51-60 hours/week (midpoint 55). The distribution of the computed variable, Sum of All Tasks, is nearly symmetric with the same modal response, but is much wider, in keeping with the manner of computation.
Figure 3
The congruence between reported (THW) and computed (SAT) total worktime was further explored by constructing a variable to represent the difference in three categories, namely: probable underreport (THW<SAT); congruent (THW=SAT); and probable overreport (THW>SAT). The new variable was crosstabulated against key personal and school characteristics and assessed using the nonparametric Somer’s d measure of association.
Two personal characteristics demonstrated significant associations with the congruency variable. Female principals were much more likely (56%) than male principals (36%) to ‘underreport’ total worktime (Somer’s d= -0.238; p=0.050). The relationship between the congruency variable and principal’s highest degree was not uniform in direction. Principals with a specialist degree were more likely (52%) than those with either a master’s degree (29%) or a doctorate (29%) to ‘underreport’ total worktime. On the other end of the congruency scale, an inverse trend was observed for ‘overreporting’ total worktime by highest degree, with 38% of master’s degree-holders, 26% of specialist degree-holders, and 21% of doctoral degree-holders ‘overreporting’. Because the bivariate relationship was not unidirectional, the Somer’s d test statistic is nonsignificant (Somer’s d= -0.049; p=0.588). However, the chi-square test indicates a moderately significant bivariate association (chi-square=8.426; 4 df; p=0.077).
One school characteristic was found to be moderately significantly associated with the congruency variable (Somer’s d= -0.195; p=0.082). Principals from schools with a large teaching staff (>50) were more likely than those from schools with a small staff to either be ‘congruent’ (43% vs. 27%, respectively) or to ‘overreport’ (34% vs. 11%, respectively).
3.3 Estimated Allocation of Worktime into Leadership Categories
It was observed that the median value (55) for reported total worktime per week (Total Hours Worked) is the same as the median value (55) for computed total worktime per week (Sum of All Tasks). In addition, the sum of the median values for time spent per week on each of the five categories of leadership tasks is also 55 (see Table 4). This consistency provided reassurance that 55 hours per week could reasonably be chosen as the denominator for allocating worktime into the five leadership categories. To this end, the median number of reported hours spent in each category was divided by 55 to yield an estimated percent of time per week spent in that category. The results are displayed in Figure 4.
Figure 4
Estimated Percentage of Time Spent per Week by Leadership Task
27.3 27.3
9.1
27.3
9.1
CIL ISM OM ISR ER
Curriculum and Instructional Leadership, Internal School Management, and Internal School Relations share the same estimated percentage (27.3), and Organization Management and External Relations share the same estimated percentage (9.1), of time spent per week on that task. Since School Management comprises ISM, OM, and ISR, the estimated percentage of time spent per week on School Management is 63.7.
3.4 Inter-relationships of Components of Total Worktime and School Management
The inter-relationships among the three component variables of total worktime were examined. The direction of each bivariate relationship can be discerned from the pyramid charts shown in Figure 5. Time spent on Curriculum and Instruction tasks is markedly shifted towards lower values, i.e., fewer hours/week, as compared to time spent on School Management tasks. In contrast, time spent on External Relations tasks is highly weighted
towards the low end, with a majority of principals reporting <10 hours/week, as compared to either time spent on Curriculum and Instruction tasks or School Management tasks. It is noteworthy that School Management tasks has a large, but nearly symmetric, spread of values in comparison to the other two components. This is an artifact of the manner in which it was computed.
Figure 5
Pyramid charts of bivariate relationships of total worktime components
The significance of these inter-relationships was assessed using the Wilcoxon signed-rank test. The results are displayed in Table 6. For each of the three paired comparisons, the difference in mean ranks was determined to be statistically significant by the Wilcoxon signed-rank test.
Table 6
Wilcoxon signed-rank test for components of total worktime
CIL SM ER
Curriculum and Instructional Leadership (CIL) z=8.434 p<0.001; 2-sided z= -5.294 p<0.001; 2-sided School Management (SM) z= -8.481 p<0.001; 2-sided External Relations (ER)
Similarly, the inter-relationships among the three component variables of School Management were examined (see Figure 6). Time spent on Internal School Management tasks is moderately shifted towards higher values, as compared to time spent on Organization Management tasks. In contrast, time spent on Internal School Relations tasks is moderately weighted towards higher values in comparison to time spent on Internal School Management tasks. Organization Management tasks is strongly shifted towards lower values, as compared to Internal School Relations tasks.
Figure 6
Pyramid charts of bivariate relationships of School Management components
The significance of these inter-relationships was tested using the Wilcoxon signed-rank test. The results are displayed in Table 7. The difference in mean ranks was determined to be statistically significant by the Wilcoxon signed-rank test for each of the three paired comparisons.
Table 7
Wilcoxon signed-rank test for components of School Management
IM OM ISR
Internal School Management (IM) z= -3.688 p<0.001; 2-sided z=2.388 p=0.017; 2-sided Organization Management (OM) z=5.884 p<0.001; 2-sided Internal School Relations
(ISR)
3. 5 Total Hours Worked by Personal and School Characteristics
Somers’ d was used to examine principals’ estimated total hours worked per week by school and personal characteristics, including the following: gender, age, highest degree completed, years served as a principal, years served as an assistant principal, years served as a schoolteacher, years worked in current school, and years as the principal in current school. Total Hours Worked did not vary significantly by any of the personal characteristics using Somers’ d.
Next, the association between principals’ estimated total hours per week working at school was examined with respect to the three key school characteristics of interest, namely: location, enrollment, and percentage of students on free or reduced-price lunch. Total Hours Worked was not found to vary significantly by any of the school characteristics using Somers’ d.
3. 6 Total Worktime Components by Personal and School Characteristics Curriculum and Instructional Leadership (CIL)
Somers’ d was used to examine the relationship between principals’ estimated hours per week spent on Curriculum and Instructional Leadership (CIL) activities and the eight key personal characteristics. Time spent on CIL activities was statistically significantly different based on gender (Somers’ d=0.283; p=0.014). Female principals were more likely than male principals to report a greater number of hours spent on curriculum and instruction. Curriculum and Instructional Leadership did not vary significantly by any of the remaining personal characteristics. Hours spent on CIL activities were similarly assessed for its relationship with the three key school characteristics. Time spent on CIL activities was statistically significantly different based on enrollment (d=0.280; p=0.008), whereby principals in large schools (>500 enrolled) more frequently reported a greater number of hours as compared to principals in small schools. Similarly, Curriculum and Instructional Leadership did not vary significantly by any of the remaining school characteristics.
School Management (SM)
The computed variable School Management (SM) was likewise assessed for its relationship with the eight personal characteristics of interest. Time spent on SM activities did not vary significantly by any of the personal characteristics based on Somers’ d. Time spent on SM activities was examined for its relationship with the three school characteristics of interest. School Management also did not vary significantly by any of the school characteristics based on Somers’ d.
External Relations (ER)
Estimated hours/week spent on External Relations (ER) activities was similarly assessed for its relationship with the key personal characteristics. Time spent on ER was statistically significantly negatively related to age (Somers’ d=-0.168; p=0.020), years as a principal (Somers’ d=-0.117; p=0.024), and years as principal in current school (Somers’ d=-0.117; p=0.032), and weakly significantly related to years as an assistant principal (Somers’ d=-0.087; p=0.098). Hours spent on ER activities did not vary significantly by the four remaining personal characteristics. Further, an examination of time spent on ER activities was conducted to determine its relationship with the key school characteristics. External Relations did not vary significantly by any of the school characteristics based on Somers’ d.
3.7 School Management Components by Personal and School Characteristics Internal School Management (ISM)
Time spent on Internal School Management (ISM) was assessed for its relationship with the eight key personal characteristics. Estimated time spent on ISM activities was statistically significantly positively related to highest degree completed (Somers’ d=0.171; p=0.044). Amount of time spent on ISM activities was weakly significantly positively related to years spent as an assistant principal (Somers’ d=0.153; p=0.098). Internal School Management did not vary significantly by the six remaining personal characteristics. Next, the relationship between principals’ estimated hours/week spent on ISM activities and the three key school characteristics was examined. Internal School Management did not vary significantly by any of the school characteristics using Somers’ d.
Organization Management (OM)
Organization Management (OM) was assessed for its relationship with the key personal characteristics. Time spent on OM activities was found to be weakly significantly positively associated with highest degree completed (Somers’ d=0.142; p=0.103). Organization Management did not vary significantly by the seven remaining personal characteristics. Estimated hours per week spent on OM activities was examined for its relationship with the key school characteristics. Organization Management was statistically significantly positively associated with school location (Somers’ d=0.248; p=0.035), i.e., principals in suburban or urban schools were more likely to report a greater number of hours spent on this task than were their rural counterparts.
Similarly, principals in large schools more frequently reported a greater number of hours spent on Organization Management (OM) activities than did principals in small schools (Somers’ d=0.319; p=0.003). However, time spent on OM activities did not vary significantly by the percentage of students on free or reduced-price lunch.
Internal School Relations (ISR)
Time spent on Internal School Relations (ISR) activities was assessed for its relationship with the eight personal characteristics. Internal School Relations was statistically significantly negatively associated with years spent as an assistant principal (Somers’ d=-0.185; p=0.039). Time spent on ISR activities did not vary significantly by the seven remaining personal characteristics. The estimated hours/week principals spend on ISR activities was assessed for its relationship with the key school characteristics. Principals from small schools reported a greater number of hours spent on ISR activities in comparison to principals from large schools (Somers’ d=-0.216; p=0.045). Internal School Relations did not vary significantly by either school location or the percent of students on free or reduced-price lunch.
4. Discussion
This study is the first examination of principals’ use of time using the ISSPP model in the state of Missouri. While the survey response rate was low (29%), the principals who responded appear to comprise a diverse sample with respect to their personal characteristics and those of their schools, although urban school principals may be underrepresented.
We examined the agreement between self-reported total time high school principals spend per week in school and total time spent in the five categories of leadership tasks. Ideally, a time-use study of principals would involve real-time recording of time spent on each category of leadership tasks for a specified number of days at multiple time points throughout the school year (see Grissom et al., 2011). It is likely this time-demanding approach would be a deterrent to participation. In this study, principals were asked to estimate the average number of hours per week in total and for each of five leadership tasks. While acknowledging the recall error and recall bias inherent in such estimates, we attempted to get a sense of the magnitude of these limitations. The reported total hours worked and computed total hours worked were congruent for 32% of the principals. Applying the same interpretation developed by Landis and Koch (1977) for Cohen’s kappa statistic, this simple observed statistic (0.32) indicates ‘fair’ agreement. The computed kappa is much smaller at 0.10, although it is statistically significant. Because of the somewhat large number of ‘classes’ for the computed total hours (i.e., 12), the observed statistic may be the better choice (Chen, 2019).
For 27% of principals, their reported total hours worked was greater than their computed total hours worked. This could be attributable to overestimating total worktime, or underestimating time spent on one or more leadership tasks. For the remaining 41% of principals, their reported total hours worked was less than their computed total hours worked. This could be attributable to overestimating time spent on one or more leadership tasks or underestimating total worktime.
While it is not possible to discern direction (i.e. over or under) from this cross-sectional study, we were able to explore whether or not congruency was associated with some key personal and school characteristics. Female principals were more likely to underreport total worktime. Overreporting was inversely related to the principal’s highest completed degree, and principals from larger schools were more likely to be ‘congruent’. Principals from larger schools may be more attuned to their time allocation due to juggling larger staffs, student bodies, and curriculums and/or may be responding to perceived expectation that they work extra-long hours.
The work week of a principal can be relegated to three components, namely, curriculum and instructional leadership (Blasé & Blasé, 2000), school management, and external relations (King, 2002), with the expectation that curriculum and instructional leadership will occupy the largest portion of time. According to Green (2013), when a principal assumes a leadership role in a school, it is often expected that the individual will bring to the organization knowledge, expertise, and ideas that can be transformed into a shared vision for the enhancement of the school’s programs and activities. Hence, we examined how principals distribute their total time per week
Instructional Leadership > External Relations. The grouped median values provide clear evidence of this pattern (41.1>>10.8>6.3 hours/week). Using another approach, we estimated the percentage of time spent per week for each of the five leadership task categories and for the combined School Management category. The pattern of time spent based on percentages is the same as that based on median hours/week, i.e., School Management (63.7%) >> Curriculum & Instructional Leadership (27.3%) > External Relations (9.1%). This pattern is consistent with a large base of research that documents principals’ spending more time on school operations/management (see e.g., Leithwood et al., 2004; Lee et al., 1993; Knapp et al., 2006) compared to time on instructional leadership activities that are directly linked to student achievement. It is plausible to argue that principals who consider instruction their highest priority are likely to ‘find’ time to allocate to instructional leadership tasks through better time management.
According to Green (2017), school management is comprised of internal school management, organization management, and internal school relations. School management is associated with concepts such as organization, operations, resources, safety, efficiency, and effectiveness. One area we examined is how principals distribute their time performing school management tasks among internal school management, organization management, and internal school relations. Our examination of these three time-use variables and their inter-relationships revealed Missouri high school principals are allocating their time on these tasks in the following manner: internal school relations>internal school management>organizational management. The grouped median values corroborate this pattern (16.8>13.6>10.2 hours/week). This observation could be due to the distribution of school size in this sample (i.e., 64% rural). Principals from smaller schools were found to spend more time on Internal school relations and land less time on organizational management than principals from larger schools.
One question we sought to answer is whether the total time high school principal spend per week in school varies by personal and/or school characteristics. Principals reported working an average of 45 to 65 hours per week at school, with most reporting 51 to 60 hours. The reported total worktime was not found to be significantly related to any of the personal or school characteristics we examined. One explanation may be the distribution of reported total worktime was relatively narrow, i.e., all responses fell into one of three adjacent hours/week intervals (41-50; 51-60; 61-70) with a central modal value. Another explanation is this variable is simply poorly measured. Our comparison of reported average total hours/week against total worktime computed from hours/week spent in each of the five individual leadership components revealed congruence for only 32% of principals in the sample.
We also described the amount of time high school principals spend per week on the components of total worktime, i.e., curriculum and instructional leadership, school management, and external relations, and explored their relationships to key personal and school characteristics. Nearly all principals reported spending, on average, 20 or less hours per week on activities related to curriculum and instructional leadership. Several studies (e.g., Day et al., 2009; Heck & Hallinger, 2009, 2010; Goldring et al., 2015; Loeb et al., 2013; Turnbull, et al., 2019) provide support for the importance of principal’s instructional leadership and advocate for increasing the time principals spend on curriculum and instruction for improved school outcomes, including teaching practices and higher student achievement. Our finding is consistent with previous research showing a shortfall in this expectation (see e.g., Hallinger, 2005; Hallinger & Murphy, 1985; Grissom & Loeb, 2011; Grissom, et al., 2015). In response to this shortfall, there are interventions such as The National School Administration Manager (SAM) Innovation Project (NSIP) (Goldring et al., 2015) that are aimed at supporting the principal to increase instructional time and decrease management time.
We found female principals and principals in large schools (>500 enrolled students) spent more hours per week than their counterparts on curriculum and instructional leadership activities. Principals in larger schools almost certainly have larger teaching staff to monitor and manage and are likely to have a larger number of course offerings to track. It is more difficult to hypothesize the gender association. Gender was not associated with any other time variable in our analyses. It was also not confounded with school size. While there is always the possibility that an association will be observed by chance, especially given a sample size of 98, principals’ time use by gender warrants further research.
Time spent on school management activities per week was a computed variable and consequently had a spread larger than the reported values of its three individual components. We estimated most principals spent 30-60 hours per week on school management. Clearly, this would be a substantial portion of their work week. Four of the eight personal characteristics of principals were found to be negatively related to time spent on school management, namely: age, years as a principal, years as a principal in the current school, and years as an assistant principal (weakly significant). The direction of these relationships suggests that older and/or more experienced principals have established management practices that are more efficient and/or effective than their younger or less experienced colleagues.
A large majority of principals reported spending 10 or less hours per week on activities pertaining to external relations. Not surprisingly, time spent on external relations was not found to vary by any of the personal or school characteristics that we examined. This may well be explained by the lack of spread in the responses.
Finally, we described the amount of time high school principals spend per week on the components of school management (internal school management, organization management, and internal school relations) and examined their relationships to key personal and school characteristics. Most principals reported spending an average of 20 or less hours per week on internal school management activities. The principal’s highest completed degree and years as an assistant principal (weakly significant) were both found to be positively related to time spent on internal school management. We noted internal school management includes a variety of tasks that may appeal to different traits (see Table 2). Principals who have extended their formal education to the levels of specialist or doctorate may approach their job with a keener interest in meeting compliance requirements (e.g. standardized testing, IEPs) than principals with lesser degrees. Principals who spent a lengthy time as an assistant principal before ascending to the principal position may have become accustomed to managerial duties such as managing students as a significant focus of their job and have simply continued to do so as principal.
Nearly all principals reported spending 20 hours or less per week on organization management tasks. We found highest completed degree (weakly significant) was positively related to time spent on organization management, and principals in urban/suburban schools and those in large schools (>500 enrolled students) spent more hours than their counterparts on organization management. In our sample, highest degree and location are both confounded with school size. Principals with a post-master’s degree are more likely to work in large schools and principals from urban/suburban schools are more likely to be from large schools as compared to their respective counterparts. Larger schools have larger instructional and non-instructional staffs, more physical facilities, and more complex budgets to oversee as compared to smaller schools.
A majority of principals spent 20 hours or less per week on activities related to internal school relations. Years spent as an assistant principal was negatively related to time spent on internal school relations, and principals from small schools (<=500 enrolled students) spent more hours per week on internal school relations than their counterparts. In these data, years spent as an assistant principal confounded with school size, i.e., current principals of large schools are more likely to have spent a longer period of time in the role of an assistant principal than their small school counterparts. Principals of smaller schools may form closer relationships with students and parents, expressed as more one-on-one counseling or communication, compared to principals from larger schools. Additionally, in a smaller school, regular attendance at school activities, i.e., promoting school spirit, may take on more importance than in a larger school.
5. Conclusion
Self-report appears to be a highly inaccurate method to measure the use of time for Missouri high school principals. Additionally, our findings suggest that under- or over reporting may not be random. Principals spend an estimate of just under two-thirds of their worktime on school management related activities and just over one-fourth on curriculum- and instruction-related activities. Female principals and principals in larger schools spend more time on curriculum and instruction-related activities. The more leadership experience a principal has, the less time they are likely to spend on school management activities. Under the umbrella of school management, principals with post-master’s degrees spend more time on internal school management; principals in larger schools spend more time on organization management; principals who served as assistant principals for a longer period of time are likely to spend less time on internal school relations; and those from smaller schools are likely to spend more time on internal school relations.
References
Agresti, A. (2010). Analysis of ordinal categorical data. (2nd ed.). Wiley.
Blasé, J., & Blasé, J. (2000). Effective instructional leadership: teachers’ perspectives on how principals promote teaching and learning in schools. Journal of Educational Administration, 38(2), 130-141.
Chen, Y. S. (2019, July 5). Interpretation of Kappa Values: Evaluate the agreement level with condition. Towards Data science. https://towardsdatascience.com/interpretation-of-kappa-values-2acd1ca7b18f.
Day, C., Harris, A., Hadfield, M., Tolley, H. & Beresford, J. (2000). Leading schools in times of change. Open University Press.
DESE. (2018, June). Ensure equitable access to excellent educators. Department of Elementary and Secondary Education. https://dese.mo.gov/sites/default/files/Educator-Equity-Plan-June2018.pdf.
Goldring, E., Grissom, J., Neumerski, C. M., Blissett, R., porter, A. (2015). Making time for instructional leadership: The feasibility of a randomized control trial of the Sam Process. The Wallace Foundation.
https://www.wallacefoundation.org/knowledge-center/Documents/Making-Time-for-Instructional-Green, R. L., (2017). Practicing the art of leadership: A problem-based approach to implementing the professional standards for educational leaders. (5th ed.). Pearson.
Grissom, J. A., & Loeb, S. (2011). Triangulating principal effectiveness: How perspectives of parents, teachers, and assistant principals identify the central importance of managerial skills. American Educational Research Journal, 48(5), 1091–1123.
Grissom, J., Loeb, S., & Mitani, H. (2015). Principal time management skills: explaining patterns in principals’ time-use, job stress, and perceived effectiveness. Journal of Educational Administration, 53(6), 773-793. Gurr, D., Drysdale, L., Di Natale, E., Ford, P., Hardy, R., & Swann, R. (2003). Successful school leadership in
Victoria: Three case studies. Leading and Managing, 9(1), 18-37.
Hallinger, P. (2005). Instructional leadership and the school principal: A passing fancy that refuses to fade away. Leadership and Policy in Schools, 4(3), 221–239.
Hallinger, P., & Heck, R. (1996). Reassessing the principal’s role in school effectiveness: A review of empirical research 1980-1995. Educational Administration Quarterly 32(1), 5-44).
Hallinger, P., & Murphy, J. (1985). Assessing the instructional management behavior of principals. The Elementary School Journal, 86(2), 217–47.
Hanneman, R., Kposowa, A., & Riddle, M. D. (2012). Basic Statistics for Social Research. Jossey-Bass. Horng, E. L., Klasik, D., & Loeb, S. (2009). Principal time-use and school effectiveness. (School Leadership
Research Report No. 09-3). Institute for Research on Education Policy & Practice. www.schoolleadershipresearch.org.
Horng, E. L., Klasik, D., & Loeb, S. (2010). Principals time-use and school effectiveness. American Journal of Education 116(4), 491-523.
IBM Corp. (2016). IBM SPSS Statistics (Version 24) [Computer software].
Kilpatrick, S., Johns, S., Mulford, B., Falk, I., & Prescott, L. (2002). More than education: Leadership for rural school-community partnerships. Rural Industries Research and Development Corporation Press (Australia). King, D. (2002). The changing shape of the leadership. Educational Leadership, 59(8), 61-63.
Knapp, M. S., Copeland, M., Plecki, M., & Portin, B. (2006). Leading, learning, and leadership support. Center for the Study of teaching and policy. https://www.wallacefoundation.org/knowledge-center/Documents/Leading-Learning-Leadership-Support-Overview.pdf
Landis, J. R., & Koch, G. G. (1977). The measurement of observer agreement for categorical data. Biometrics, 33(1), 159-174.
Lee, V. E., Bryk, A. S., & Smith, J. B. (1993). The organization of effective secondary schools. Review of Research in Education 19, 171-267.
Lehmann, E., J. (2006). Nonparametrics: statistical methods based on ranks. Springer.
Leithwood, K. (2005). Understanding successful principal leadership: Progress on a broken front. Journal of Educational Administration, 43(6), 619-629.
Leithwood, K., & Reihl, C. (2005). What we know about successful school leadership. In W. Firestone & C. Reihl (Eds.), A new agenda: Directions for research on educational leadership. (pp. 22-47). Teachers College Press.
Leithwood, K., Louis, K., Anderson, S., & Wahstrom, K. (2004). How leadership influences student learning. Report for the Wallace Foundation, Center for Applied Research and Educational Improvement, University of Minnesota. https://www.wallacefoundation.org/knowledge-center/Documents/How-Leadership-Influences-Student-Learning.pdf
May, H., & Supovitz, J. A. (2011). The scope of principal efforts to improve instruction. Educational Administration Quarterly, 47(2), 332–352.
May, H., Huff, J., & Goldring, E. B. (2012). A longitudinal study of principals’ activities and school performance. School Effectiveness and School Improvement, 23(4), 417–439.
Mulford, W., Silins, H., & Leithwood, K. (2004). Educational leadership for organizational learning and improved student outcomes. Kluwer Academic Publishers.
Sergiovani, T. J., & Green, R. L. (2015). The principalship: A reflective practice perspective. (7th ed.). Pearson Education Inc.