Benchmarking Big Data Technologies
for Energy Procurement Efficiency
Full Paper
Manuel Fritz
University of Stuttgart
[email protected]
Simon Albrecht
University of Freiburg
[email protected]
Holger Ziekow
Furtwangen University
[email protected]
Jens Strüker
Fresenius University of Applied Sciences
[email protected]
Abstract
The electrical power industry is undergoing radical change due to the push for renewable energy that makes energy supply less predictable. Smart meters along with analytics software can grant insights into customer-specific consumption and thereby enable a better match between the demand and supply side for an electric utility. However, the vast amount of allocatable smart metering data and complexity of analytics pose chal-lenges to database system. We address the implementation of an analytics approach to optimize customer portfolios, eventually preventing excess energy procurement. Using real-world and simulated data, we test the suitability of big data approaches as well as traditional relational database technology. Furthermore, we present solutions based on big data platforms and demonstrate their cost effectiveness and performance. Our findings suggest economic feasibility of big data solutions for large utilities. Small and medium-sized utilities are advised to invest in more cost-effective solutions such as cluster-based systems.
Keywords
Big Data, Performance Evaluation, Energy Procurement, Customer Segmentation, Smart Meter
Introduction
The energy sector is transitioning into an ‘Internet of Energy’. This forthcoming network system is expected to connect increasingly decentralized energy supply and heterogeneous consumers. Electricity generation is diversifying from thermal power plants to renewables and distributed energy resources (DER), frequently owned on residential level. The weather-determined and fluctuating behavior of the supply side translates into uncertainty in the market and subsequently to inefficient measures to cope with mismatches of demand and supply. Miscalculated market equilibria force grid operators to use their operation reserve. This gener-ation capacity consists of mostly non-renewable power plants which can be activated in case of underesti-mated demand. Minimizing such ex post balancing measures requires precise energy procurement on the side of the electric utilities and thus a comprehensive knowledge regarding end-consumers’ demand. The forthcoming rollout of smart meters will allow the utilization of 15-minute granularity smart meter readings for the examination of customer characteristics and behavioral patterns. The obtained information may improve energy procurement by developing dynamic and individualized customer contracts. Processing these tasks requires a high performance and resilient ICT infrastructure, incorporating modern quantitative tools. Concurrently, the relevance of data management and analytics is increasing alongside technological innovation. Big data solutions enable utilities to store and process raw metering data, forecast develop-ments and develop appropriate market strategies. Professionals are now faced with the challenge to choose and implement suitable processing technologies depending on the needs of their respective companies. In this paper, we address the question how electrical power utilities can efficiently implement a cost-of-service segmentation to optimize their portfolio for procurement on electricity markets. We build on top of the work in Albert and Rajagopal (2014) and Albrecht et al. (2017), which address the algorithmic questions
of cost-of-service segmentation. Building on Fritz (2016) this work focusses on efficiency of respective pro-cessing platforms and paradigms suitable for implementing the algorithms. Our main contributions are: (1) We investigate to which degree traditional databases can cope with the requirements of performing cost-of-service segmentation; (2) We present a scalable and efficient solution for cost-cost-of-service segmentation with big data technologies; (3) We quantify the performance benefits of big data technologies over tradi-tional databases for the targeted use case; (4) We provide insights into the resource requirements for im-plementing cost-of-service segmentation and demonstrate saving potential with big data technologies. For our research, we follow a design science approach (Crnkovic 2010), developing design artifacts in the form of a distributable implementation concept for cost-of-service segmentation and the combination with suitable processing platforms. We evaluate our solution against the requirements of electrical power utili-ties using real-world smart meter data. The remainder of the paper is structured as follows: In the next section, we provide the necessary background on electrical power markets, the specifics of cost-of-service segmentation and big data technology. Subsequently, we describe our scalable implementation of cost-of-service segmentation and describe the options for processing platforms. Next, we present the experiments for evaluating the implementation options and discuss the resulting implications on the implementation at utilities. Finally, we review related work and conclude our insights.
Background
The steadily increasing share of renewable energies (currently 30 percent in Germany (BMWi 2015, 2016)), is causing high fluctuations on the supply side. Accordingly, electricity markets are subject to high levels of uncertainty. Electric energy is generally being traded in two major ways: Long-term procurement is done on futures markets while short-term buying is executed on spot markets. Although the former has the greater share of the total trade, the spot market exchange volume is increasing steadily (Simon 2012). For this paper, we focus on the optimization of short-term energy procurement and thus the trading on the EPEX Spot, the most relevant short-term energy exchange in Europe. Participants trade two major products in two different modes: Auction trade (or ‘day-ahead’) is being finalized on the day before the physical ful-fillment (12 noon), whereas continuous trade (or ‘intraday’) allows for trading and fulful-fillment one the same day (EEX 2016; Konstantin 2013). While the share of renewable energy resources like photovoltaics and wind energy is increasing, power generation becomes more fluctuate and thus uncertain. The ability to transfer, process, store and analyze data on a large scale enables a utility to gain valuable information on their customer base and respective consumption behavior patterns. The insights obtained by big data ana-lytics will allow for the segmentation and identification of load profiles. This is the foundation for an indi-vidualized and uncertainty-minimizing procurement on power spot markets. For the customer segmenta-tion, it is crucial to obtain information on the actual energy consumption of given customers. Currently, the regular billing process in Germany is still based on local, annual meter readings and subsequent averaging of household load profiles, to obtain a handful of standard load profiles. However, a comprehensive and differential analysis of individual load profiles and subsequently normative actions are only feasible using smart meter technology. The last amendment of the German energy act (EnWG 2016), adopted the EU proposal for a wide-scale smart roll out. Smart meters further the evolution of conventional energy markets to smart markets as a foundation for dynamic prices and incentive-based load management by acting as an enabler and accelerator for the integration of DER. Those will provide high-granularity data, allowing for the identification of deferrable loads during costly time slices within flexible tariffs and a more efficient load control by the provider due to bi-directionality of smart meter signals (Aichele and Doleski 2013). Given the application of 15-minute smart meter readings, every smart meter will provide 35,000 load data points annually, an increase amounting to more than three million percent, compared to the current analogous meters. Identifying anomalous customers may enable a utility to better forecast the energy demand, and to differentiate among procurement strategies. In this manner, efficient consumption patterns can be incen-tivized by providing consumers with specific products suited for their demand.
Related Work
This work addresses the use of big data technologies to perform cost-of-service segmentation with smart meter data. The term big data has been around for more than a decade. A widely known early definition focusses on the so-called three V’s: Volume, Velocity and Variety (Laney 2001). The V’s describe data
prop-systems. These and other new requirements have driven the development of alternative approaches and architectural designs for data processing and storage (Stonebraker et al. 2007). Paradigms such as MapRe-duce have emerged (Dean and Ghemawat 2004) and new architecture styles have been proposed, such as the lambda architecture (Marz and Warren 2015). By now, numerous solutions facilitate big data applica-tions in various aspects. Hadoop (White 2012), Hive (The Apache Software Foundation 2016), Impala (Kornacker et al. 2015) and Spark (Zaharia et al. 2010) are just examples of software solutions supporting big data paradigms. The advent of such continuously maturing solutions promises to solve diverse data challenges that are anticipated for utilities (Diamantoulakis et al. 2015). For the analysis in this paper, we tap into smart meters as a data source by utilizing readings from an Irish research project (accessed via the Irish Social Science Data Archive (2009) - www.ucd.ie/issda). The associated large amounts of measure-ments result in challenges that relate to big data problems. Hence, we base our solution concept on big data technologies. The experiments in the later section illustrate the need for this technological choice by facing traditional database technologies.
To our knowledge, there exists no analysis on how to efficiently determine scalable cost-of-service segmen-tations. Hence, closest related work can be found in analyses of different big data problems within the smart grid domain: Diamantoulakis et al. (2015) discuss big data challenges in the context of the smart grid. They elaborate on analytics approaches with a focus on load classification and forecasting problems. For the im-plementation of analytics, they briefly touch upon grid computing and cloud computing. However, in con-trast to this paper, they do not provide insights on the performance of specific big data technologies for concrete tasks. Patel et al. (2013) model the segmentation of customers in price-groups as a nonlinear prob-lem, solving it with integer programming. The authors focus on their optimization technique and the end-results while this very paper puts the emphasis on the dynamic scalability of the approach and the choice of processing platforms. Leonardi et al. (2016) use big data technologies to analyze smart home data re-garding data quality. They use some of the technologies addressed in our work, namely Hadoop Distributed File System (HDFS) as underlying storage, Impala, and PostgreSQL. However, they focus their work on the findings on data quality in smart home data and do not report on the performance details of the data pro-cessing. Furthermore, the presented analytics mainly concern descriptive statistics of the smart home data. In contrast, our work gives insights into the processing of the more complex analytics task of cost-of-service segmentation. Ziekow et al. (2013) present a solution for real-time load forecasting with smart home data. They present performance measures for their solution based on the lambda architecture for big data pro-cessing and the Esper complex event propro-cessing engine. However, they focus on the continuous propro-cessing of continuous streams of energy measurements. They do not address scalable batch processing and the corresponding technologies we analyze. Furthermore, they focus on different energy analytics problems, like short-term load forecast with machine learning techniques. Liu et al. (2015) benchmark analytics tasks on smart meter data with several analytics platforms. However, they analyze a different set of processing platforms and address different analytics problems (no cost-of-service segmentation). In summary, this paper differs from related work in two main aspects. First, it provides detailed insights into the performance of different candidate platforms within the energy analytics domain. Second, it details the scalable imple-mentation and related performance for the problem of cost-of-service segimple-mentation.
Implementation of the Cost-of-Service Segmentation
This section describes the model for a cost-of-service segmentation. We base our approach on the work in Albert and Rajagopal (2014), and extend their model to factor in seasonality and deviations on the energy market by integrating real market data as described in Albrecht et al. (2017). The model is based on the newsvendor model where a perishable product is traded on a short-term market. The problem is to deter-mine the optimal amount of this good to purchase in advance based on past observations. As proposed in Albert and Rajagopal (2014) and Albrecht et al. (2017), we utilize a simplified market model, allowing en-ergy procurement on either the ahead spot market or on a real-time market. Buying enen-ergy on the day-ahead market is generally cheaper, but comes with uncertainty, since customer-specific consumption is only revealed in real-time. The optimum purchase 𝑧𝑡∗ for a customer is determined by equation 1.
𝐹𝐿(𝑧𝑡∗) =
𝑝𝑟𝑒𝑑(𝑞, 𝑡) − 𝑝𝑡
Here, 𝑞 represents the cost on the real-time market and 𝑝𝑡 the cost of day-ahead procurement at time 𝑡. Thus, we require a forecasting mechanism to determine real-time market prices, since purchases are made (in this model exactly) 24 hours in advance on the day-ahead market, on which 𝑝𝑡 is known. Hence, we use 𝑝𝑟𝑒𝑑(𝑞, 𝑡) to represent the forecasted value for real-time prices at 𝑡. For this work, we instantiate 𝑝𝑟𝑒𝑑(𝑞, 𝑡) by averaging the real-time prices over the last seven weekdays for the time slice 𝑠. 𝐹𝐿 is the cumulative dis-tribution function (CDF) for the consumption of an arbitrary customer for a given time frame. Albert and Rajagopal (2014) build the CDF on past observations for each customer. We use the extended model sug-gested in Albrecht et al. (2017) and focus on different time intervals, like seasonality distinguishing week-days and weekends, which is reflected in equation 2. Here, 𝐿𝑆 is the consumption time series for a given customer at time slice 𝑠, which acts as a filter for timed consumption data (e.g. all records for Fridays at 1pm) and I is the indicator function.
𝐹𝐿(𝑙, 𝑠) = ∑
I (𝑣 ≤ 𝑙) |𝐿𝑠| 𝑣∈𝐿𝑠
(2) The filter returns consumption data for an interval featuring similar consumption behavior. The specific criteria may depend on exogenous factors like geography or climate. We focus on the hour of the day, the season and a distinction between weekdays and weekends. This is formally denoted by equation 3 below.
𝐿𝑠= {
𝑙 ∈ 𝑇 | ℎ𝑜𝑢𝑟_𝑜𝑓_𝑑𝑎𝑦(𝑙) = ℎ𝑜𝑢𝑟_𝑜𝑓_𝑑𝑎𝑦(𝑠) ∧ 𝑠𝑒𝑎𝑠𝑜𝑛(𝑙) = 𝑠𝑒𝑎𝑠𝑜𝑛(𝑠)
∧ 𝑖𝑠_𝑤𝑒𝑒𝑘𝑑𝑎𝑦(𝑙) = 𝑖𝑠_𝑤𝑒𝑒𝑘𝑑𝑎𝑦(𝑠)
} (3)
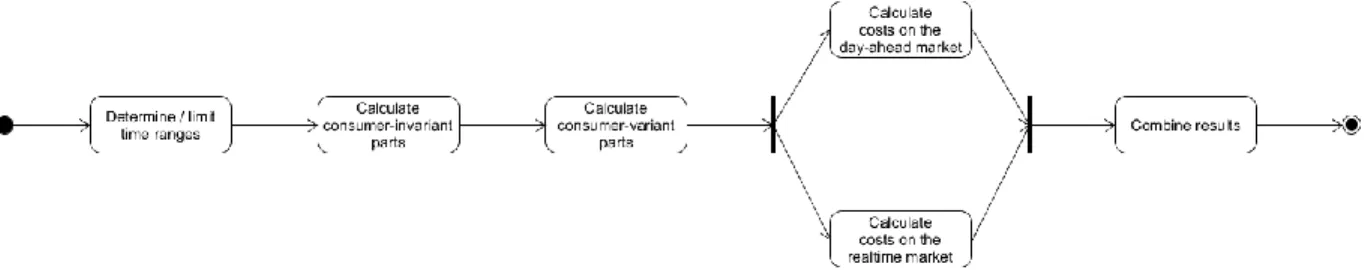
The steps required to implement the specified model can be depicted as a sequence of multiple steps (Figure 1). First, we need to select similar time frames (Equation 3). Our experiment requires two distinct time ranges – one to build the model and another to apply it on. By reflecting seasonal characteristics, we assume a good fit between the two-time ranges. Subsequently, we calculate the consumer-invariant part of the anal-ysis (Equation 1). Next, we solve Equation 1 for each point in time 𝑡 using 𝑝𝑟𝑒𝑑(𝑞, 𝑡) and 𝑝𝑡 which is known at 𝑡. This value is invariant for all consumers. We then build the CDF for each customer and each time slice 𝑠 based on past observations and solve it by determining the highest consumption in the order of the CDF which is equal or less than the result of Equation 1. This is formally described in Equation 2. The result is the amount of the optimum purchase on the day-ahead market for each customer at time 𝑡 called 𝑧𝑡∗.
Figure 1. High-level overview of the processing chain
Using 𝑧𝑡∗, we can now simulate the procurement on the day-ahead market by multiplying it with 𝑝𝑡. If the actual consumption at 𝑡 exceeds 𝑧𝑡∗, the excess amount will be procured on the real-time market. Since solving Equations 1 and 2 can result in an optimum purchase amount of a negative or zero value, it is nec-essary to bridge the gaps by purchasing the actual consumption for each customer on the real-time market. Finally, we combine the results to achieve the costs for each customer at each time slice.
Processing Platforms for the Execution of the Analysis
This section describes the technical solutions as possible instantiations of the described distribution strat-egies. We limited our observations to four software solutions: PostgreSQL, Hive, Impala and Spark. The latter three solutions are software solutions most widely used in a big data context, whereas PostgreSQL is considered a classical relational database management system (RDBMS). PostgreSQL is an instantiation of
represented in tuples and grouped together in relations. PostgreSQL is an open-source endeavor and sup-ports the use of window functions to execute row-relational calculations. This is required for the realization of our experiment. The performance of RDBMS can be tuned by indexing the most frequently used data in the set. This improves the lookup speed and is thus an advantage for combining/joining relations. Depend-ing on the installation of PostgreSQL, it can either run distributed when partitionDepend-ing the tables or on a sDepend-ingle node. Hive is an open-source solution for data warehousing based on Apache Hadoop. Hive uses a deriva-tive of SQL called HiveQL, which currently supports DDL and DML operations. Queries are optimized and compiled to MapReduce jobs on Hadoop. (Dean and Ghemawat 2004) primarily presented MapReduce as a paradigm for data processing on clusters. The performance of Hive relates on an extensive use of I/O operations on the hard disk, i.e. temporary files are written, read and finally deleted. Impala is an open-source distributed and massively parallel processing SQL-Engine based on a Hadoop cluster. Currently, it is an Apache Incubator project submitted by Cloudera. Impala is implemented in C++ and Java from scratch. The underlying architecture of Impala allows a distributed and parallel execution of operations on each data node and an aggregation of the results at the end. Spark is a platform for distributed computation based on a cluster implementing the Hadoop-API. It provides interfaces for Python, Scala, Java and R. Spark defines resilient distributed datasets (RDDs), which is a collection of objects stored distributed in memory. This enables Spark to achieve a fast access time on these RDDs. Furthermore, Spark offers sound extensions for data analytic operations, i.e. machine learning.
Evaluation of Solution Options
In this section, we describe the experimental approach to evaluate the introduced technical solutions. That is, we describe the setup of the experiment and how it will be performed. The aim of the experiment is to measure the runtime, hard disk and RAM utilization of the extended cost-of-service segmentation approach for a steadily increasing number of customers. Subsequently, we will present and discuss the results. We base the experiment on the publicly available Commission for Energy Regulation data set (Irish Social Science Data Archives 2009). This data set contains smart meter reads in a 30-minute interval for 4,225 households in Ireland for the timescale of mid-July 2009 until the end of 2010. After filtering out anoma-lous sensors, we end up with 3,608 sensors. Due to different consumption behavior patterns on weekends and holidays, we solely focus on weekdays. The price data is retrieved from the EPEX Spot, which is a short-term energy exchange. The regarded markets include central Europe, i.e. Germany, France, Austria, Swit-zerland and Luxembourg. Price from the EPEX intraday market will be used as an approximation of the real-time market for the implementation of the cost-of-service segmentation, since purchases can be made 30 minutes prior to the actual delivery (EPEX Spot 2016). This data set contains smart meter reads in a 30-minute interval for 4,225 households in Ireland for the timescale of mid-July 2009 until the end of 2010. After filtering out anomalous sensors, we end up with 3,608 sensors. Due to different consumption behavior patterns on weekends and holidays, we solely focus on weekdays. The price data is retrieved from the EPEX Spot, which is a short-term energy exchange. The regarded markets include central Europe, i.e. Germany, France, Austria, Switzerland and Luxembourg. Price from the EPEX intraday market will be used as an approximation of the real-time market for the implementation of the cost-of-service segmentation, since purchases can be made 30 minutes prior to the actual delivery.
Experimental Setup
The experiment is based on a sequential execution of predefined actions. The order of these actions is de-scribed on an abstract level below to preserve generality for all technical solutions. For the experimental setup, we implemented four steps:
1. Data Generation. In this step, we create a data generator based on the given 3,608 customers. This
generator simulates artificial customers based on the smart meter reads of the existing ones, plus adding some noise to the consumption data. The noise depends on the standard deviation of each customer for each time slice, so the resulting consumption could be considered as realistic to a certain degree. For each run 10,824 (= 3 * 3,608) synthetic customers will be added to the data set.
2. Storage Optimization. The introduced technologies use different approaches to optimize a given data
set. Relational DBMS generally use the concept of indices on frequently used columns, which are set at this point (if not set yet). When adding data to a table in a PostgreSQL database with existing indices, it main-tains its structure, thus resetting an index is not required. Indices are set on the columns id, days, time
individually and grouped. The investigated NoSQL solutions use statistics to optimize the query execution. Those are stored in the metadata and contain information regarding table size or number of rows and thus result in a better performance i.e. when joining tables due to the precise estimates of the required resources.
3. Query Execution. We create a query that can be executed by each of the introduced technical solutions.
This query uses window functions which extend the existing SQL standard. The respective output is stored in the underlying database. After five executions, the median runtime will be regarded as the most realistic value. During the execution, the utilization of the RAM and HDD will be measured every 60 seconds.
4. Infrastructure Restoration. Spark, Hive and parts of Impala are implemented in Java, which
allo-cates and frees memory automatically when required. The used memory space will be purged implicitly by the Java garbage collection (GC). Currently, there are several strategies on how to clean memory imple-mented in the GC. Since all of them require further computation, the results of this experiment could be affected by them. Therefore, after each test series for a specific number of customers, we restart all services on the cluster nodes to free the memory explicitly.
For this experiment, we scale the number of customers from 10,824 to 205,656 in steps of 10,824 customers and execute the process for each technical solution separately. The setup for PostgreSQL is version 9.3 on a single node (Intel Xeon E5-2660 v3 (10 x 2.6 GHz), 64 GB RAM, 512 GB SSD), running on Ubuntu 14.04. Spark, Impala and Hive are installed on a 7-node cluster (1 master node, 6 data nodes). Each node consists of an AMD FX-6300 CPU (6 x 3.5 GHz), 16 GB RAM, 2 TB HDD with 7,200 RPM and Ubuntu 14.04. The big data software solutions are installed through Cloudera CDH 5.8.0. This also installs tools to manage and monitor the hardware and software infrastructure. It installs Hive in version 1.1.0, Impala 2.6.0 and Spark 1.6.0. We use the prebuilt package for Spark on YARN (Yet Another Resource Negotiator) distributed by Cloudera Manager, whereas the other solutions don’t use a resource manager. All further settings for the technical solutions were left to default, except for the maximum RAM allocation threshold for Impala, since the implementation of the cost-of-service segmentation couldn’t be executed with default settings.
Experimental Results
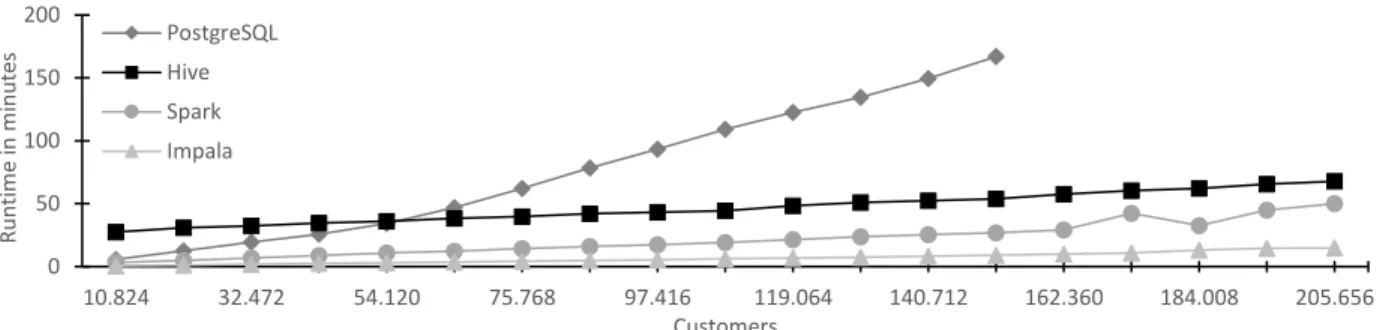
Figure 2. Comparison of the runtime behavior
The results regarding the execution time in dependence of the number of analyzed customers are depicted in Figure 2. PostgreSQL exhibits the poorest performance. After about 150k customers, we ran out of suffi-cient storage space because of the huge number of indices set to improve querying performance. Albeit, we expect an even worse runtime without any indices set, because of the huge amount of data and the resulting lookup time. Therefore, it is advisable to include indices to the actual data to be processed in the calculation. The big data solutions tend to scale better with the increasing amount of data. At the beginning, Hive has a poorer performance than PostgreSQL. At around 54k customer, Hive and PostgreSQL are roughly on par, whereas after that, Hive behaves better than PostgreSQL regarding the runtime. Spark and Impala are char-acterized by an even better performance, whereas the latter seems to have an advantage with an increasing amount of data to be processed. Regarding the variance of the five runtime measurements per round, the values are very close to each other with a relative standard deviation (RSD) of 7% for PostgreSQL runs. Hive has a similar RSD of about 6%, which is only surpassed by Impala with an RSD of 3%. Spark on the other hand has an RSD of about 34%, which can be traced back to one outlier at a specific run for 184k customers. relative standard deviation (RSD) of 7% for PostgreSQL runs. Hive has a similar RSD of about 6%, which is only surpassed by Impala with an RSD of 3%. Spark on the other hand has an RSD of about 34%, which can
0 50 100 150 200 10.824 32.472 54.120 75.768 97.416 119.064 140.712 162.360 184.008 205.656 R un ti m e i n m inu te s Customers PostgreSQL Hive Spark Impala
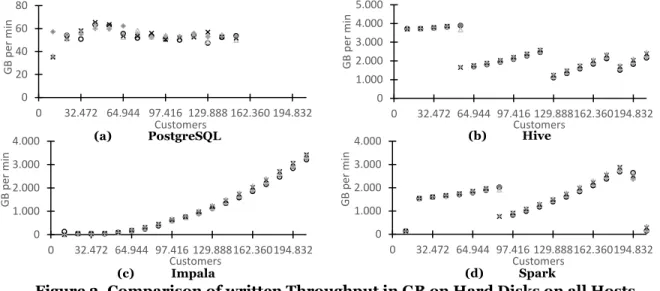
the storage, we observe that big data systems save way more data on the storage (Figure 3). Though it needs to be reflected, that the data is generally stored with a replication factor, which is defined as three by the installation of Cloudera CDH. Furthermore, the data may be stored temporarily and can be deleted during or after the actual execution. We also observe the total amount of data stored across all 6 data nodes as well as metadata stored on the master node.
Figure 3. Comparison of written Throughput in GB on Hard Disks on all Hosts
Regardless of the technical specifications, we observe some patterns during the execution. Hive tends to optimize the amount of data written to the storage (Figure 3b), i.e. no linear gradient can be denoted. It seems like Spark (Figure 3d) behaves somewhat similar to Hive, but further experiments with more data must prove this claim. Impala uses the storage almost exclusively to save the final results, therefore a rea-sonable gradient can be observed (Figure 3c). For PostgreSQL, the throughput values appear to be constant. The values measured during the experiment are very contiguous, yielding a stable result. For PostgreSQL, we observe small deviations which appear to be negligible to the observed extend.
Figure 4. Comparison of total RAM used averaged over the runtime on all Hosts
Lastly, we observe the usage of the RAM during the execution of the experiment (Figure 4). For PostgreSQL, the usage of RAM increases in a linear manner with an increasing number of customers (Figure 4a), whereas the gradient for Hive tends to flatten while increasing the data size (Figure 4b). The measurements for these solutions are stable considering the error indicator. For Impala and Spark, it isn’t possible to state a clear statement regarding the RAM usage. While for Impala, the distribution of the RAM usage is considerably large. Spark on the other hand has a similarly divergent RAM usage, though it seems to stabilize during the execution of the experiment for later series.
0 20 40 60 80 0 32.472 64.944 97.416 129.888 162.360 194.832 GB p er m in Customers 0 1.000 2.000 3.000 4.000 5.000 0 32.472 64.944 97.416 129.888162.360194.832 G B p er m in Customers 0 1.000 2.000 3.000 4.000 0 32.472 64.944 97.416 129.888162.360194.832 G B p er m in Customers 0 1.000 2.000 3.000 4.000 0 32.472 64.944 97.416 129.888162.360194.832 G B p er m in Customers 0 5 10 15 0 32.472 64.944 97.416 129.888 162.360 194.832 A ve rag e R A M in G B Customers 0 10 20 30 40 50 0 32.472 64.944 97.416 129.888 162.360 194.832 A ve rag e R A M in G B Customers 0 20 40 60 80 0 32.472 64.944 97.416 129.888 162.360 194.832 A ve rag e R A M in G B Customers 0 20 40 60 80 0 32.472 64.944 97.416 129.888 162.360 194.832 A ve rag e R A M in G B Customers (b) Hive (d) Spark
(a) PostgreSQL (b) Hive
(c) Impala (d) Spark
(c) Impala (a) PostgreSQL
Discussion of the Results
Given the runtime of our extended cost-of-service segmentation, classical RDBMS on a single powerful node are not practicable for big data approaches. The analysis took almost three hours for about 150k cus-tomers. Additional to the smart meter data, one must also consider metadata like indices, requiring great amounts of disk space. The increase of the RAM utilization is considered moderate, i.e. the performance of PostgreSQL is more likely to be contingent on hard disk usage. Hive on the other hand started off with a longer runtime than PostgreSQL, but scales better with an increasing amount of data. This claim is sup-ported by the stepwise improvement of writes on the hard disk. Supposedly, fewer or bigger (temporary) files are saved on the disk. Further, the RAM usage tends towards a limiting value around 40 GB of potential most 96 GB. All measured values for Hive are solid and located close to the other measurements. Yet, the analysis requires an hour-odd to complete for 200k customers and is thus not practical. Spark provides the result of the analysis slightly faster, in about 50 minutes for 200k customers. While the reads on the hard disk also seem to improve with an increasing amount of data, the RAM usage is unpredictable and charac-terized by a regular variation during the experiment. Furthermore, it requires potentially more RAM than Hive does, with slightly below 60 GB maximum. The best performance regarding the runtime was achieved with Impala. Applying our approach to the cost-of-service segmentation on 205,656 customers took less than 15 minutes, making it not only the fastest solution but also scaling best out of the examined solutions. Compared to Spark, Impala is about 70% faster for 200k customers, which is a considerable advantage. Writes on the disk are stable and proceed in an exponential manner. Yet, RAM usage follows no clear struc-ture and results in huge variations (Figure 4c). A first analysis concerning a caching strategy, which may occur before restarting the services in the last step of the experimental setup, did not give new insights due to the few number of runs. Due to the architecture of Impala, the processed data will be stored in memory during the execution. If the data size becomes too large to store in memory, it may be swapped to the hard disk which causes different performance measurements, i.e. runtime and hard disk usage.
Implication on System Operations for Utilities
As shown in Albert and Rajagopal (2014) and Albrecht et al. (2017), cost-of-service analytics can provide insights for utilities’ portfolio optimization. However, the underlying data processing is far from trivial as shown in our experiments. In this section, we discuss the implications in regards to utilities’ ICT systems.
Implications on Resource Requirements
The experiments suggest a linearly increasing resource allocation with an increasing number of customers for all tested solutions. However, computation time for the traditional database (PostgreSQL) grows signif-icantly faster than for big data solutions, despite the fact PostgreSQL ran on more expensive hardware (i.e. a 6,907 € server) than the big data solutions (i.e. 3,780 € in total for seven commodity PCs). The difference in hardware cost is a consequence of the underlying design principles of traditional databases and big data solutions. The latter are, by design, built to scale out across multiple machines, while traditional databases are designed to run on a single machine. That is, relational databases favor scale-up as scaling strategy while big data solutions inherently support scale-out strategies. As the results show, the processing time for ana-lyzing a moderate number of customer (i.e. approx. 150k) over a limited amount of time (i.e. 1 season model building and 1 season for testing) amounts to several hours with PostgreSQL, despite the use of powerful 20 CPU core server and options to further scale up. Hence, the economic feasibility of using such a database for larger utilities and for analysis of longer time-frames is questionable. Comparably, the best performing big data solutions finished the analysis for about 200k customers in 14.76 minutes – a runtime improve-ment of factor 11.3 compared to PostgreSQL latest test series. Furthermore, scaling out by adding more low-cost computing resources is well supported, if the analysis must cover more customers or longer timeframes. In summary, our experiments show that the big data solutions outperform the tested database with regards to technical properties. When using a query-based approach to analyze (an increasing amount of) time-dependent data, the big data solutions used in our experiment clearly outperform classical RDBMS.
Implications on System Operations
Our experiments show that a cost efficient and scalable solution for cost-of-service segmentation is hard to achieve with traditional relational database technology. In contrast, implementation on top of the tested big data platforms shows out-of-the-box good performance on overall cheaper hardware. This implies that big data platforms are a superior technology choice for this use case. However, additional factors may im-pact the technology selection for utilities. Small and medium-sized utilities with small IT departments may not have the required expertise in-house to operate a big data platform. In many cases, staff is more expe-rienced with existing solutions set up on relational database technology. To exploit the benefits of a big data platform, cloud-based solutions can help to clear obstacles, by taking away the burden of operating a big data cluster in-house. This concept has been embraced for instance in the PeerEnergyCloud project (Oberdorf 2012) with a cloud-enabled complex analysis of energy data, without burdening the IT depart-ment of the corresponding utility. A similar solution for cost-of-service segdepart-mentation can be a viable option for utilities that lack big data expertise in-house. Due to the faster processing of the experiments, using NoSQL solutions on a cloud-based environment tend to be more cost-effective than using classical RDBMS.
Conclusion
In this research paper, we investigated how electric utilities may implement a cost-of-service segmentation to optimize procurement on spot markets with big data solutions. More precise procurement strategies eventually help preventing excess energy generation like the activation of the operation reserve. For this purpose, we created database queries to be executed by PostgreSQL, Hive, Impala and Spark. The latter three solutions ran on a cluster consisting of low cost commodity hardware, whilst PostgreSQL was running on a single powerful – albeit more expensive - computing node. We utilized smart meter data and spot market prices to instantiate our model. Said model was applied on a steadily increasing number of custom-ers. In particular, we created synthetic households based on actual smart meter data, ranging from 10,824 to 205,656 customers in different test series. Thereby we measured the runtime of the cost-of-service seg-mentation for a varying number of consumers as the main criterion for further evaluations.
The result indicates that classical RDBMS systems like PostgreSQL are not well suited for realizing a cost-of-service approach due to the runtime of the query. Big data solutions like Impala or Spark, exhibit shorter runtimes due to the underlying data parallelism paradigm implemented in the software architecture. Con-sequently, the cost-of-service segmentation for about 200k customers can be executed in less than 15 minutes using Impala. The usage of the hard disk is stable for all technical solutions, whereas the RAM usage tends to variate quite significantly for Spark and Impala. The experiment was executed on four pro-cessing platforms at default settings. Modifying settings might yield differing results of the experiment. For instance, Spark and Impala were tested with different resource managers. Quantifying the effect of tuning the settings is subject to future work. Regarding future projects, we aim to field test our approach within the infrastructure of a small or utility. Further, we aim to quantify the impact of the streamlined procure-ment on market-specific CO2 savings. This research suggests a significant potential for big data solution as
an environment for business analytics in the forthcoming digitalized energy sector by demonstrating the use case of cost-of-service segmentation. Along this case, we quantify the benefits of big data solutions over traditional databases and thereby provide a reference for big data in energy informatics. Large utilities, expected to manage extensive amounts of data, are advised to invest in the implementation of big data solutions like Spark or Impala. However, small and medium-sized utilities, recognizing the necessary inno-vation but still reluctant to undertake major investments in big data technology, may consider the imple-mentation of a cloud-based solution as a first step towards a digitalized utility.
References
Aichele, C., and Doleski, O. D. 2013. “Einführung in den Smart Meter Rollout,” in Smart Meter Rollout, Wiesbaden: Springer Fachmedien Wiesbaden, pp. 3–42 (doi: 10.1007/978-3-8348-2440-0_1). Albert, A., and Rajagopal, R. 2014. “Cost-of-service segmentation of energy consumers,” Power Systems,
IEEE Transactions on (29:6), IEEE, pp. 2795–2803.
Albrecht, S., Fritz, M., Strüker, J., and Ziekow, H. 2017. “Targeting customers for an optimized energy pro-curement - A Cost Segmentation Based on Smart Meter Load Profiles,” Computer Science - Research and Development (32:1), pp. 225–235 (doi: 10.1007/s00450-016-0303-x).
BMWi. 2015. “Ein Strommarkt für die Energiewende - Ergebnispapier des Bundesministeriums für Wirtschaft und Energie (Weißbuch),” Berlin, p. 102.
BMWi. 2016. “Pressemitteilung: Erneuerbare Energien auf einen Blick,” (http://www.bmwi.de/DE/Themen/Energie/Erneuerbare Energien/erneuerbare-energien-auf-einen-blick.html; retrieved August 22, 2016).
Codd, E. F. 1970. “A relational model of data for large shared data banks,” Communications of the ACM (13:6), ACM, pp. 377–387.
Crnkovic, G. D. 2010. “Constructive research and info-computational knowledge generation,” in Studies in Computational Intelligence (Vol. 314), Springer Heidelberg, pp. 359–380 (doi: 10.1007/978-3-642-15223-8_20).
Dean, J., and Ghemawat, S. 2004. “MapReduce: Simplified Data Processing on Large Clusters,” Proceed-ings of 6th Symposium on Operating Systems Design and Implementation (51:1), ACM, pp. 137–149. Diamantoulakis, P. D., Kapinas, V. M., and Karagiannidis, G. K. 2015. “Big Data Analytics for Dynamic
Energy Management in Smart Grids,” Big Data Research (2:3), pp. 94–101 (doi: 10.1016/j.bdr.2015.03.003).
EEX. 2016. “Annual Report 2015”,(www.eex.com/blob/16500/ff13c25a4813320ff521bf67ac397e73/eex-gb-2015-en-data.pdf; retrieved August 10, 2016).
EnWG. 2016. “Gesetz über die Elektrizitäts-und Gasversorgung (Energiewirtschaftsgesetz -EnWG) - No-velle 2011,” (available at www.juris.de).
EPEX Spot. 2016. “EPEX SPOT and ECC to reduce Intraday lead time on all markets Trading up to 30 minutes before delivery –Austrian lead time decreases by 45 minutes.,”
Fritz, M. 2016. “Erstellung und Auswertung von Kundenprofilen auf Basis von Smart Meter Daten,” Furtwangen University of Applied Sciences.
Irish Social Science Data Archives. 2009. “CER Smart Metering Project,” (available at http://www.ucd.ie/issda/data/commissionforenergyregulationcer/; retrieved March 20, 2016). Konstantin, P. 2013. Praxisbuch Energiewirtschaft: Energieumwandlung, -transport und -beschaffung im
liberalisierten Markt, Heidelberg: Springer Vieweg, Springer Fachmedien ISSN 978-3662498224 . Kornacker, M., Behm, A., Bittorf, V., Bobrovytsky, T., Ching, C., Choi, A., Erickson, J., Grund, M., Hecht,
D., Jacobs, M., Joshi, I., Kuff, L., Kumar, D., Leblang, A., Li, N., Pandis, I., Robinson, H., Rorke, D., Rus, S., Russell, J., Tsirogiannis, D., Wanderman-Milne, S., and Yoder, M. 2015. “Impala: A Modern, Open-Source SQL Engine for Hadoop”, in Proceedings of CIDR 2015.
Laney, D. 2001. “3D data management: Controlling data volume, velocity and variety,” META Group Re-search Note (6), p. 70.
Leonardi, A., Ziekow, H., Strohbach, M., and Kikiras, P. 2016. “Dealing with Data Quality in Smart Home Environments—Lessons Learned from a Smart Grid Pilot,” Journal of Sensor and Actuator Networks (5:1), Multidisciplinary Digital Publishing Institute, p. 5.
Liu, X., Golab, L., Golab, W. M., and Ilyas, I. F. 2015. “Benchmarking Smart Meter Data Analytics,” in In-ternational Conference on Extending Database Technology (EDBT), pp. 385–396.
Marz, N., and Warren, J. 2015. Big Data: Principles and best practices of scalable realtime data systems, Manning Publications Co, ISSN 978-1617290343.
Oberdorf, I. P. K. M. 2012. “KIT-Peer Energy Cloud,” Oberdorf, Iris (PKM), (http://www.kit.edu/kit/eng-lish/11934.php).
Patel, S., Sevlian, R., Zhang, B., and Rajagopal, R. 2013. “Pricing Residential Electricity Based on Individual Consumption Behaviors,” arXiv preprint arXiv:1312.1243.
Simon, M. 2012. Strombörsen im Vergleich: Liquidität und Preise im Spothandel, ISSN 978-3848206025. Stonebraker, M., Madden, S., Abadi, D. J., Harizopoulos, S., Hachem, N., and Helland, P. 2007. “The End of an Architectural Era: (It’s Time for a Complete Rewrite),” VLDB ’07 Proceedings of the 33rd inter-national conference on Very large data bases (12:2), pp. 1150–1160.
The Apache Software Foundation. 2016. “APACHE HIVE” (available at http://hive.apache.org/; retrieved August 20, 2016).
White, T. 2012. “Hadoop: The definitive guide”, O’Reilly Media, ISSN 978-1449311520.
Zaharia, M., Chowdhury, M., Franklin, M. J., Shenker, S., and Stoica, I. 2010. “Spark: Cluster Computing with Working Sets,” Proceedings of the 2nd USENIX conference on Hot topics in cloud computing, USENIX Association, p. 10.
Ziekow, H., Doblander, C., Goebel, C., and Jacobsen, H.-A. 2013. “Forecasting household electricity demand with complex event processing: insights from a prototypical solution,” in Proceedings of the Industrial