Life cycle assessment of supermarket carrier
bags: a review of the bags available in 2006
The Environment Agency is the leading public body
protecting and improving the environment in England and
Wales.
It’s our job to make sure that air, land and water are looked
after by everyone in today’s society, so that tomorrow’s
generations inherit a cleaner, healthier world.
Our work includes tackling flooding and pollution incidents,
reducing industry’s impacts on the environment, cleaning up
rivers, coastal waters and contaminated land, and i
wildlife habitats.
mproving
This report is the result of research commissioned and
funded by the Environment Agency.
Published by:
Environment Agency, Horizon House, Deanery Road, Bristol, BS1 5AH
www.environment-agency.gov.uk © Environment Agency
February 2011
ISBN: 978-1-84911-226-0
All rights reserved. This document may be reproduced with prior permission of the Environment Agency.
The views expressed in this document are not necessarily those of the Environment Agency.
This report is printed on Cyclus Print, a 100% recycled stock, which is 100% post consumer waste and is totally chlorine free. Water used is treated and in most cases returned to source in better condition than removed.
Further copies of this report are available from:
The Environment Agency’s National Customer Contact Centre by emailing enquiries@environment-agency.gov.uk or by
telephoning 08708 506506.
Author(s): Dr. Chris Edwards Jonna Meyhoff Fry Dissemination Status: Publicly available Keywords:
Carrier bags, life cycle assessment, LCA Research Contractor:
Intertek Expert Services Cleeve Road
Leatherhead, KT22 7SB Tel 01372 370900
Environment Agency project manager: Dr Joanna Marchant
Environment Agency Kings Meadow House Kings Meadow Road Reading, RG 1 8DQ Tel 0118 9535346
Product Code:SCHO0711BUAN-E-E
Evidence at the Environment
Agency
Evidence underpins the work of the Environment Agency. It provides an up-to-date understanding of the world about us, helps us to develop tools and techniques to monitor and manage our environment as efficiently and effectively as possible. It also helps us to understand how the environment is changing and to identify what the future pressures may be.
The work of the Environment Agency’s Evidence Directorate is a key ingredient in the partnership between research, guidance and operations that enables the Environment Agency to protect and restore our environment.
This report was produced by the Research, Monitoring and Innovation team within Evidence. The team focuses on four main areas of activity:
• Setting the agenda, by providing the evidence for decisions;
• Maintaining scientific credibility, by ensuring that our programmes and projects are fit for purpose and executed according to international standards;
• Carrying out research, either by contracting it out to research organisations and consultancies or by doing it ourselves;
• Delivering information, advice, tools and techniques, by making appropriate products available.
Miranda Kavanagh Director of Evidence
Advisory Board
This project was informed and assisted by an Advisory Board set up by the
Environment Agency.
Iris Anderson
Department of Energy and Climate Change
(DECC)
Peter Askew
Department for Business, Innovation and skills
(BIS)
1Jane Bickerstaffe
Industry Council for Packaging and the
Environment (Incpen)
Terry Coleman (Chair) Environment Agency
Jeff Cooper
Environment Agency
2Julia Faria
Local Environmental Quality Division,
Department for Environment, Food and Rural
Affairs (Defra)
2Bob Gordon
British Retail Consortium (BRC)
3Keith James
Waste & Resources Action Programme
(WRAP)
4Marlene Jannink
Department for Business, Enterprise &
Regulatory Reform (BERR)
5Charlotte Lee-Woolf
Sustainable Consumption and Production,
Department for Environment, Food and Rural
Affairs (Defra)
3Joanna Marchant
Environment Agency
Rob Mynard
Waste Strategy Division, Department for
Environment, Food and Rural Affairs (Defra)
2Julie Osmond
Welsh Assembly Government
3Marc Owen
Waste Strategy, Department for Environment,
Food and Rural Affairs (Defra)
3Gerry Newton-Cross Environment Agency
6Julian Parfitt
Waste & Resources Action Programme
(WRAP)
7Nigel Smith
British Retail Consortium (BRC)
21 From January 2007. 2 Until April 2007. 3 From December 2009. 4 From December 2006. 5 Until December 2006. 6 Until April 2007. 7 Until November 2006.
Stakeholder Consultation Group
In addition to the Advisory Board, a Stakeholder Consultation Group was set
up to support the project. Membership of the Stakeholder Consultation
Group was by invitation. The purpose of the Stakeholder Consultation Group
was to provide a two-way communication platform.
Executive Summary
This study assesses the life cycle environmental impacts of the production, use and disposal of different carrier bags for the UK in 2006.
In recent years, the relative environmental impacts of lightweight carrier bags and other options has been debated. By the Spring of 20098 leading supermarkets had halved the
number of single use carrier bags used. However, questions still remain about the environmental significance of lightweight carrier bags, especially with regard to the wider debate on global warming.
The report considers only the types of carrier available from UK supermarkets9. It does
not examine personal bags nor carriers given out by other high street retailers. The report does not consider the introduction of a carrier bag tax, the effects of littering, the ability and willingness of consumers to change behaviour, any adverse impacts of degradable polymers in the recycling stream, nor the potential economic impacts on UK business.
The following types of carrier bag were studied:
• a conventional, lightweight carrier made from high-density polyethylene (HDPE);
• a lightweight HDPE carrier with a prodegradant additive designed to break the down the plastic into smaller pieces;
• a biodegradable carrier made from a starch-polyester (biopolymer) blend;
• a paper carrier;
• a “bag for life” made from low-density polyethylene (LDPE);
• a heavier more durable bag, often with stiffening inserts made from non woven polypropylene (PP); and
• a cotton bag.
These types of carrier bag are each designed for a different number of uses. Those intended to last longer need more resources in their production and are therefore likely to produce greater environmental impacts if compared on a bag for bag basis. To make the comparison fair, we considered the impacts from the number of bags required to carrying one month’s shopping in 2006/07.
We then calculated how many times each different type of carrier would have to be used to reduce its global warming potential to below that for conventional HDPE carrier bags where some 40 per cent were reused as bin liners. Finally the carriers were compared for other impacts: resource depletion, acidification, eutrophication, human toxicity, fresh water aquatic ecotoxicity, marine aquatic ecotoxicity, terrestrial ecotoxicity and photochemical oxidation (smog formation).
8Based on 2006 baseline figures.
The study found that:
• The environmental impact of all types of carrier bag is dominated by resource use
and production stages. Transport, secondary packaging and end-of-life management generally have a minimal influence on their performance.
• Whatever type of bag is used, the key to reducing the impacts is to reuse it as
many times as possible and where reuse for shopping is not practicable, other reuse, e.g. to replace bin liners, is beneficial.
• The reuse of conventional HDPE and other lightweight carrier bags for shopping
and/or as bin-liners is pivotal to their environmental performance and reuse as bin liners produces greater benefits than recycling bags.
• Starch-polyester blend bags have a higher global warming potential and abiotic
depletion than conventional polymer bags, due both to the increased weight of material in a bag and higher material production impacts.
• The paper, LDPE, non-woven PP and cotton bags should be reused at least 3, 4,
11 and 131 times respectively to ensure that they have lower global warming potential than conventional HDPE carrier bags that are not reused. The number of times each would have to be reused when different proportions of conventional (HDPE) carrier bags are reused are shown in the table below.
• Recycling or composting generally produce only a small reduction in global
warming potential and abiotic depletion.
Type of carrier HDPE bag (No
secondary reuse) HDPE bag (40.3% reused as bin liners) HDPE bag (100% reused as bin liners) HDPE bag (Used 3 times) Paper bag 3 4 7 9 LDPE bag 4 5 9 12 Non-woven PP bag 11 14 26 33 Cotton bag 131 173 327 393
The amount of primary use required to take reusable bags below the global warming potential of HDPE bags with and without secondary reuse
Contents
CONTENTS ...6
Abbreviations ...10
1 INTRODUCTION... 11
1.1 Project background... 11
1.2 The different types of carrier bags ... 11
1.2.1 Supermarket carrier bags studied ...12
1.2.2 Other options...13
2 GOAL DEFINITION...15
2.1 Goal of the study ...15
2.2 Critical review ...16
2.3 Use of the study and target audience...16
3 SCOPE...17
3.1 Function of the product system and functional unit...17
3.2 Reference flow...17
3.3 System boundaries ...18
3.3.1 Excluded processes and cut-off criteria...21
3.4 Allocation and system expansion...22
3.5 Data requirements and data quality ...23
3.5.1 Data requirements...23
3.5.2 Data quality ...23
3.6 Modelling and calculation of inventories and impacts ...24
3.7 Impact assessment ...24
3.8 Sensitivity analysis ...25
3.9 Reporting ...25
4 INVENTORY ANALYSIS ...26
4.2 Bag production processes ...27
4.3 Transport...28
4.4 Reuse, recycling & end-of-life ...30
5 IMPACT ASSESSMENT ...32
5.1 Global warming potential...33
5.2 Other impact categories ...35
6 SENSITIVITY ANALYSIS...46
6.1 Secondary use of lightweight bags ...46
6.2 An increase in recycling and composting at end-of-life ...48
6.3 Changing the impact assessment method employed ...51
7 DISCUSSION ...53
7.1 Comparison with other studies ...53
7.2 Discussion of results ...55
8 CONCLUSIONS...59
8.1 Conclusions related to individual carrier bags...59
8.2 General conclusions ...60
9 REFERENCES...62
ANNEX A - A SUMMARY OF SELECTED LIFE CYCLE ASSESSMENTS OF CARRIER BAGS...62
ANNEX B - A STUDY OF CARRIER BAG WEIGHT, VOLUME AND ITEM CAPACITY 77 ANNEX C - DESCRIPTION OF INVENTORY DATA...85
ANNEX D - DESCRIPTION OF IMPACT CATEGORIES...102
Abbreviations
BRC British Retail Consortium
DEFRA Department for the Environment, Food and Rural Affairs GWP Global Warming Potential
HDPE High density polyethylene
IPCC Intergovernmental Panel on Climate Change ISO International Organization for Standardization LCA Life cycle assessment
LCI Life cycle inventory
LCIA Life cycle impact assessment LDPE Low density polyethylene LLDPE Linear low density polyethylene PA Polyamide
PE Polyethylene
PET Polyethylene terephthalate PLA Polylactic Acid
PP Polypropylene
PVC Polyvinyl chloride EfW Energy from Waste
WRAP Waste and Resources Action Programme
1 Introduction
1.1
Project background
This study was commissioned by the Environment Agency and assesses the life cycle environmental impacts of the production, use and disposal of different carrier bags for the UK in 2006.
In 2008, approximately 10 billion lightweight carrier bags were given away in the UK which equates to around 10 bags a week per household (DEFRA 2009). In recent years, a debate about the relative environmental impacts of these lightweight carrier bags and their alternatives has emerged. This debate has arisen due to a combination of public, media and legislative pressure to reduce the environmental and social impacts of food packaging. In response the UK government, the British Retail Consortium (BRC) and leading supermarkets agreed to cut the number of single use carrier bags used by 50% by the spring of 2009 based on 2006 baseline figures. In July 2009, the Waste and Resources Action Programme (WRAP) announced that this initiative had achieved a reduction of 48% across the UK (WRAP 2009). However, lightweight carrier bags are still seen as an important media and legislative issue and questions still remain on their environmental significance, especially to the wider debate on global warming.
Life Cycle Assessment (LCA) is a standard method for comparing the environmental impacts of providing, using and disposing of a product or providing a service throughout its life cycle (ISO 2006). In other words, LCA identifies the material and energy usage, emissions and waste flows of a product, process or service over its entire life cycle to determine its environmental performance.
Previous studies in several countries have looked at the environmental impacts of different carrier bag options. Their findings are interesting but are not directly applicable to the UK because of their geographical coverage and the assumptions made about the use and disposal of carrier bags by consumers.
This report considers only carriers available from UK supermarkets. It does not examine personal bags nor carriers given out by other high street retailers. The report does not consider the consequences of introducing a carrier bag tax, the effects of littering, the ability to and willingness of consumers to change behaviour, any adverse impacts of degradable polymers in the recycling stream, nor the potential economic impacts on UK industry.
New types of bags have been introduced since the data was collected for this study and these may have different environmental performance.
1.2
The different types of carrier bags
The main function of a carrier bag is to carry groceries and goods from the shop to the home. The bag therefore needs to be robust enough to hold a certain quantity of
shopping, but at the same time provide a convenient option for the consumer to carry or transport the shopping home. The scope and findings of recent LCA studies of carrier
1.2.1 Supermarket carrier bags studied
Supermarket carrier bags used in the UK have generally been categorised as disposable (i.e. single use) or reusable. However, these descriptions are increasingly becoming blurred as ‘disposable’ plastic carrier bags are now encouraged to be reused both as carrier bags (primary reuse) and also to replace other products such as bin liners (secondary reuse).
Most UK supermarkets offer several types of carrier bag, generally including a
conventional, lightweight, HDPE9 carrier bag (often termed disposable) and a heavy duty LDPE10 plastic bag often referred to as a ‘bag for life’. These carrier bags vary in terms of
weight, capacity and recycled content. Supermarkets now also offer other, more durable, carrier bags, generally made from woven, natural fibres, such as hemp or cotton. Carrier bags recorded as being used in the main UK supermarkets and included in this study are shown in Table 1.1 and are described below. Several of these were not available in UK supermarkets during the reference period of the study but were included because of their potential future use.
Conventional High-density polyethylene (HDPE) bags
This is the lightweight, plastic, carrier bag used in almost all UK supermarkets and often provided free of charge. It is a vest-shaped bag and has the advantage of being thin-gauged and lightweight. It has been termed “disposable” and “single use”
High-density polyethylene (HDPE) bags with a prodegradant additive
This type of lightweight, plastic, carrier bag is made from HDPE with a prodegradant additive that accelerates the degradation process. These polymers undergo accelerated oxidative degradation initiated by natural daylight, heat and/or mechanical stress, and embrittle in the environment and erode under the influence of weathering. The bag looks like the conventional HDPE bag being vest-shaped and thin-gauged.
Low-density polyethylene (LDPE) bags
These are thick-gauged or heavy duty plastic bags, commonly known as ‘bags-for-life’, and are available in most UK supermarkets. The initial bag must be purchased from the retailer but can be replaced free of charge when returned. The old bags are recycled by the retailer.
Non-woven polypropylene (PP) bags
This type of bag is made from spunbonded non-woven polypropylene. The non-woven PP bag is stronger and more durable than a bag for life and is intended to be reused many times. To provide stability to the base of the bag, the bag comes with a semi-rigid insert.
Cotton bags
This type of bag is woven from cotton, often calico, an unbleached cotton with less processing, and is designed to be reused many times.
9 HDPE is high density polyethylene. 10 LDPE is low density polyethylene.
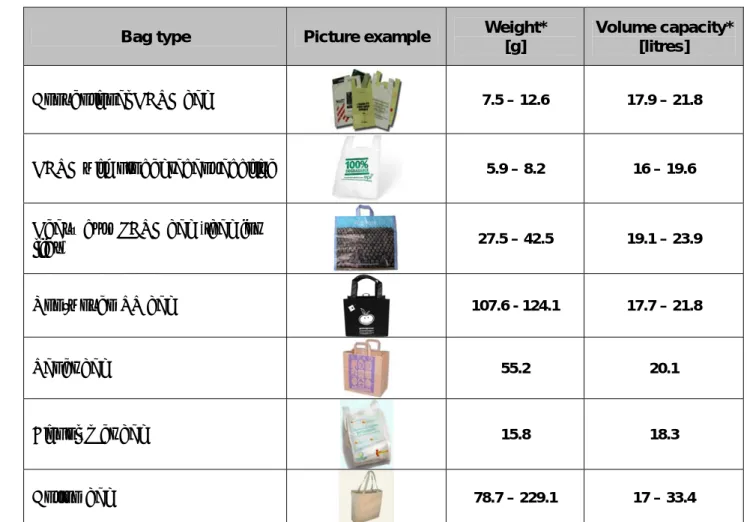
Table 1.1 Carrier bag types used in UK supermarkets included in this study.
Bag type Picture example Weight*
[g]
Volume capacity* [litres]
Conventional HDPE bag 7.5 – 12.6 17.9 – 21.8
HDPE with prodegradant additive
5.9 – 8.2 16 – 19.6
Heavy duty LDPE bag (‘bag for
life’) 27.5 – 42.5 19.1 – 23.9 Non-woven PP bag 107.6 - 124.1 17.7 – 21.8 Paper bag 55.2 20.1 Biopolymer bag 15.8 18.3 Cotton bag 78.7 – 229.1 17 – 33.4
* Some supermarkets have supplied data, others are based on measurements by the authors (see annex B).
Paper bags
These are generally no longer used in UK supermarkets, although they are available from other retail shops. The paper bag was in effect the first “disposable” carrier bag, but was superseded in the 1970s by plastic carrier bags which were seen as the perfect alternative, as they did not tear when wet.
Biopolymer bags
Biopolymer carrier bags are a relatively recent development. They are only available in a few UK supermarkets. The biopolymers are usually composed of either polylactic acid (PLA), made from the polymerisation of lactic acids derived from plant-based starch, or starch polyester blends, which combine starch made from renewable sources such as corn, potato, tapioca or wheat with polyesters manufactured from hydrocarbons (Murphy
et al 2008). These biodegradable polymers decompose to carbon dioxide, methane,
water, inorganic compounds or biomass (Nolan-ITU2003).
1.2.2 Other options
There are several other types of carrier, none of which have been considered in this study. These include woven polypropylene bags, jute or hemp bags and plastic boxes. Figure 1.1 below shows some examples.
Figure 1.1 Examples of a vacuum formed box, a woven PP bag, a hemp bag, and a jute bag.
Polypropylene (PP) vacuum formed boxes
An alternative to the carrier bag is a rigid box made from vacuum formed polypropylene with separate detachable rigid handles. This is used by one supermarket in store but by many for home deliveries. It is intended to be reused many times.
Woven polypropylene (PP) bags
This type of bag is produced from woven polypropylene “fibres”. Similarly to the non-woven PP and LDPE bags, it is strong and durable and intended to be reused many times. To provide stability to the base of the bag, the bag comes with a semi-rigid insert.
Jute bags
Jute bags are made from jute fibres spun into coarse strong strands making a strong and durable carrier bag. The jute bag is intended to be reused many times.
2 Goal definition
The international standard on lifecycle assessment ISO 14040 (ISO 2006) requires that the goal of an LCA study states the intended application, the reasons for carrying out the study, the intended audience, and whether the results are intended to be used in
comparative assertions intended to be disclosed to the public.
2.1
Goal of the study
The goal of this study is to assess the potential life cycle environmental impacts of various current and potential supermarket carrier bags in the UK.
The goal of the study has been split into the following objectives:
• To compile a detailed life cycle inventory of the environmental burdens associated with the production, use and disposal of lightweight plastic carrier bags and three to five other options;
• To use the life cycle inventory data to compare the environmental impacts arising from lightweight plastic carrier bags and the alternatives under the various
scenarios considered; and
• To compare the results of this study with other key life cycle studies in this area and identify the main reasons for any significant differences.
The types of carrier bag studied were agreed by the project board, based partly on the market representation in supermarkets, and partly on new materials that were receiving increased attention. A carrier bag is defined in this study as a bag with a capacity of over 15 litres, that could be used at a supermarket checkout. Therefore, this does not include other bags available in supermarkets such as ‘deli’ bags.
The following types of carrier bag were studied:
• conventional high-density polyethylene (HDPE);
• high-density polyethylene (HDPE) with a prodegradant additive; • starch-polyester (biopolymer) blend;
• paper;
• low-density polyethylene (LDPE); • non woven polypropylene (PP); and • cotton.
2.2
Critical review
The study has been critically reviewed in accordance with ISO 14040. The review panel consisted of:
• Mark Goedkoop (chairman), PRé Consultants, Amersfoort, the Netherlands. • Keith Elstob (co-reviewer), Bunzl Retail, Manchester.
• Jane Bickerstaffe (co-reviewer), INCPEN, Reading.
The chairman of the review panel has been involved in the project from the start by reviewing and commenting on the goal and scope. The co-reviewers were involved at the end of the project. The panel’s report as well as the consultants’ responses to the
reviewers’ comments are included in Annex E.
In addition to the critical review, the project was also followed by a Project Advisory Board and a Stakeholder Consultation Group. Membership of both groups was by
invitation. The members of the board and the stakeholder group were kept informed about the
project at regular intervals and were invited to comment and provide information.
2.3
Use of the study and target audience
The results of this life cycle study are intended to provide an independent, unbiased, objective assessment of the environmental impacts of various carrier bags. It should provide evidence for government and supermarkets in devising policies to reduce the environmental impacts of carrier bags. The study also provides a potential baseline to measure the degree of success by supermarkets in reducing the environmental impacts of supermarket carriers.
The target audience for the report is:
• Interested parties such as supermarkets and other retailers, environmental organisations, consumer organisations as well as consumers themselves. • Public authorities, in particular the Department for Environment, Food and Rural
Affairs (DEFRA) responsible for national, environmental policy in England, the Welsh Assembly Government (WAG) who have parallel responsibilities for Wales and WRAP, the Waste and Resources Action Programme.
3 Scope
3.1
Function of the product system and functional unit
A comparison of life cycle environmental impacts should be based on a comparable function (or ‘functional unit’) to allow a fair comparison of the results. The carrier bags studied are of different volumes, weights and qualities. The Environment Agency commissioned a survey11 which found that, over a 4 weeks period, supermarket
shoppers purchased an average of 446 items. The functional unit has therefore been defined as:
Carrying one month’s shopping (483 items) from the supermarket to the home in the UK in 2006/07.
3.2
Reference flow
The reference flow is the number of carrier bags required to fulfil the functional unit (as described in section 3.1). This depends on the volume of the bag, its strength and consumer behaviour when filling and using the bags. Consumer behaviour determines how many items are put into each bag, the number of times a bag is reused (primary reuse), whether the bag is subsequently used to perform an alternative function (secondary reuse), and in part the way they are managed as waste.
The primary12 reuse of carrier bags was excluded from the reference flow due to a lack
of independent data available on the reuse of each type of bag. However, as several types are designed to be reused, we have calculated the primary reuse required to reduce the global warming potential of each reusable bag to below that of the
conventional, lightweight HDPE bag The inclusion of primary reuse is detailed in section .7
9.1 litres and the average volume of a “bag for life” (LDPE) carrier bag was 21.5 litres.
the major supermarkets co-operated with the survey which showed that shoppers put an
3
The number of bags required to carry one month’s shopping (483 items) depends whether weight or volume is the limiting factor in carrier bag use, Pira International compared the volume and weight capacity of several carrier bags (detailed in Annex B). We found that the weight capacity of the bags studied was 18 to 19 kg., which is more than an average person can carry. Therefore, volume was selected as the limiting factor for bag use. The average volume of a conventional lightweight (HDPE) carrier bag was 1
The consumer survey commissioned by the Environment Agency13 provided data on the
number of items purchased and the number of bags required to carry those items. All
11 Based on a 2007 survey by TNS Market Research specialists
12Primary reuse in this study means reuse for the original purpose – to carry shopping from the
supermarkrt to the home. This is distinct from secondary reuse which here meansd reuse to replace
another product, e.g. a bin liner.
13 ibid
average 5.88 items in the conventional HDPE carrier bag and an average 7.96 items into the heavy duty LDPE carrier bag
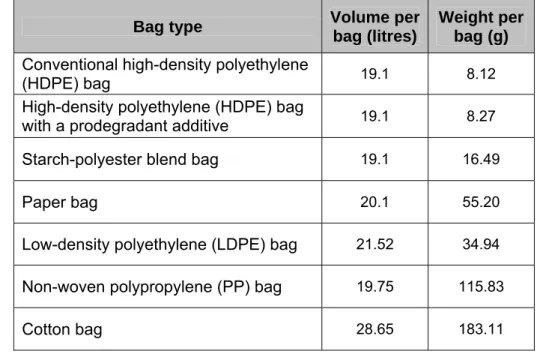
The average weight, volume and item capacity for each carrier bag type included in this study was then calculated. The material weights of the HDPE prodegradant and starch-polyester bags were adjusted pro-rata to match the average volume of the conventional lightweight HDPE bag (19.1 litres carrying 5.88 items). For the paper, LDPE, non-woven PP and cotton bags, the item capacities were adjusted according to their volumes. These revised bag capacities were then used to calculate the reference flow14 for each
type of bag as shown in table 3.1. The initial reference flows shown do not include any primary reuse of carrier bags.
Table 3.1 The assumed volume, weight, items per bag and required reference flow for each carrier bag (excluding primary reuse).
Supermarket policies and consumer behaviour have changed since the reference period (2006/07) but there is no evidence to suggest the capacities of HDPE and LDPE bags have changed significantly. However, while data used for starch polyester blend bags were provided by the manufacturer, since the reference period the weight of some of these bags may have been reduced and the effect of this is discussed in section 7.2
3.3
System boundaries
The study is a ‘cradle to grave’ life cycle assessment. Therefore, the carrier bag systems investigated include all significant life cycle stages from raw material extraction, through manufacture, distribution use and reuse to the final management of the carrier bag as waste. The system boundaries are defined so that all inputs and outputs from the system
14 The reference flow is the number of each type of bag required to fulfil the functional unit (483 items of
shopping in one month).
Bag type Volume per
bag (litres) Weight per bag (g) Items per bag Refflow – No. bags Conventional high-density polyethylene
(HDPE) bag 19.1 8.12 5.88 82.14
High-density polyethylene (HDPE) bag
with a prodegradant additive 19.1 8.27 5.88 82.14
Starch-polyester blend bag 19.1 16.49 5.88 82.14
Paper bag 20.1 55.20 7.43 64.98
Low-density polyethylene (LDPE) bag 21.52 34.94 7.96 60.68
Non-woven polypropylene (PP) bag 19.75 115.83 7.30 66.13
are either elemental flows15 or materials or energy entering another product life cycle
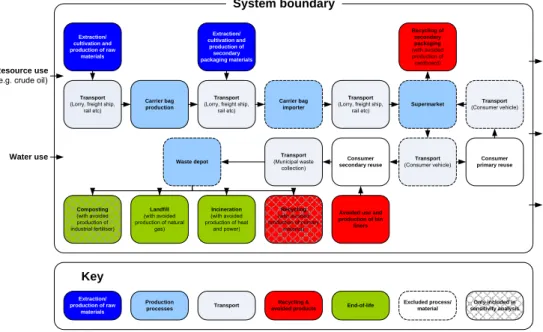
through recycling or energy recovery respectively. Therefore, the study quantifies all energy and materials used, traced back to the extraction of resources, and the emissions from each life cycle stage, including waste management. Recycled content and recycling and composting at end-of-life were excluded from the system boundaries. This was due to the large proportion of bags that contained no recycled content and the wide variation in the amount of bag recycling and composting. The recycled content in carrier bags has increased since the reference period and therefore the results of this study may be worse than the current practice. The inclusion of recycling and composting at end-of-life is considered during the sensitivity analysis. Figure 3.1 shows a simple flow diagram which defines the system boundaries for the study.
Extraction/ cultivation and production of raw
materials
Transport
(Lorry, freight ship, rail etc) Carrier bag production Excluded process/ material Key End-of-life Recycling & avoided products Extraction/ production of raw materials Transport
(Lorry, freight ship, rail etc) Extraction/ cultivation and production of secondary packaging materials Carrier bag importer Transport
(Lorry, freight ship,
rail etc) Supermarket
Transport
(Consumer vehicle) primary reuseConsumer Transport
(Consumer vehicle)
Consumer secondary reuse
Avoided use and production of bin liners Transport (Municipal waste collection) Recycling of secondary packaging (with avoided production of cardboard) Waste depot Landfill (with avoided production of natural gas) Incineration (with avoided production of heat and power) Recycling (with avoided production of primary material) Composting (with avoided production of industrial fertiliser) Transport Production processes Resource use
(e.g. crude oil)
Water use Emissions to air Discharges to water and soil Radiation System boundary Only included in sensitivity analysis
Figure 3.1 System boundaries applied in this study (simplified flow diagram). The study includes the following life cycle stages:
Extraction/production of raw materials
The extraction of resources, as well as any forestry, agriculture and the processing of resources to produce materials such as HDPE, LDPE, PP, paper, cotton and starch-polyester blend included in the study. The study covers material and energy resources, emissions and waste. Where production data were not available, flows were estimated from similar products.
Packaging
Primary packaging is included. Some secondary packaging (used for the distribution of the bags from the importer to the supermarket distribution centre) has been excluded due to consignments generally being a mix of different supplies depending on the needs of the supermarket. Pallets have also been excluded due to lack of precise data about
15 An elemental flow is material or energy entering the system being studied that has been drawn from the
environment without previous human transformation, or material or energy leaving the system being studied that is released into the environment without subsequent human transformation (ISO 14040).
their material and reuse rates. However, due to their high reuse, this is not considered to have any significant effect on the results.
Bag production processes
The conversion of the raw materials into carrier bags is included in the study.
Transport
The transport of materials from their producer to the carrier bag manufacturer, and the distribution of the finished carrier bag from the manufacturer to the importer and then to supermarket is included. Transportation by a municipal waste collection vehicle to a waste management facility has also been included.
End-of-life
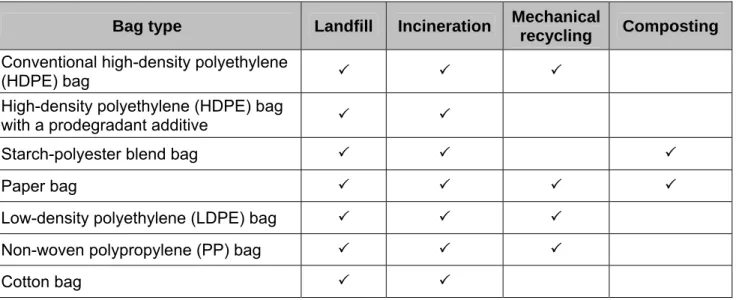
The management of wastes is included in the study. The choice of end-of-life process reflects the realistic options for each type of bag. The options considered for each bag are shown in table 3.2. Recycling and composting are considered in the sensitivity analysis. The recycling of cotton bags has not been included as no evidence was found to support this. The recycling of HDPE bags with a prodegradant additive has also been excluded due to their negative impact on the quality of recycled HDPE.
Table 3.2 End-of-life processes considered for the different carrier bags investigated.
Bag type Landfill Incineration Mechanical
recycling Composting
Conventional high-density polyethylene
(HDPE) bag 3 3 3
High-density polyethylene (HDPE) bag
with a prodegradant additive 3 3
Starch-polyester blend bag 3 3 3
Paper bag 3 3 3 3
Low-density polyethylene (LDPE) bag 3 3 3
Non-woven polypropylene (PP) bag 3 3 3
Cotton bag 3 3
Recycling, reuse & avoided products
Composting at the end of life has been excluded from the system boundaries. The expansion of the system boundaries of the study to include avoided products
(described in section 3.4) has been used to model both recycling and secondary reuse. If a material is recycled or reused in another application it can avoid the production of virgin materials. Therefore the benefit of this process is shown by subtracting from the lifecycle inventory the burdens associated with the amount of this product that is avoided by that recycling or reuse.
Avoided products have been included for materials that are recycled during production. Recycling and composting at end-of-life has been included in the sensitivity analysis. It has
also been assumed that 40 per cent of the lightweight carrier bags (i.e. the HDPE, HDPE prodegradant and starch-polyester bags) are reused in secondary applications as bin liners and therefore avoids their production. Paper bags were assumed not to be reused as bin liners, as there was no evidence that they could successfully be reused for this purpose.
During the reference period of the study there was no evidence of paper carrier bag use in the main UK supermarkets but we have included them because of interest in their use as a “green” alternative to conventional HDPE carrier bags.
The primary reuse of paper carrier bags was considered alongside other bags such as LDPE, non-woven PP and cotton that are regularly reused to carry shopping. However, the inclusion of reuse for paper carrier bags is intended to illustrate how many times a paper carrier bag would have to be reused to perform better than other bags, it is not a statement that this reuse occurs or that it is feasible. In fact information related to primary reuse for paper bags in the Republic of Ireland indicates that supermarket paper carriers are not reused for shopping16.. When the primary reuse of any carriers as shopping bags
has been included in the study, the required reference flow (as described in section 3.2) has correspondingly reduced.
The primary and secondary data used to model the systems considered in this study are further described in Chapter 4.
3.3.1 Excluded processes and cut-off criteria
Certain elements of the lifecycle have been excluded to ensure the scope of the study remains feasible, although no specific cut-off criteria have been applied. The following materials and processes have been excluded:
Inks and dyes
These materials are used to print the design/brand on each carrier and have been excluded from the study due to a lack of information about the inks and dyes used and the small quantities required.
Retail storage of the carrier bags
Any environmental impacts associated with storage activities at the bag importers and supermarkets have been excluded.
Transport from the supermarket to the consumer
Consumer transportation to and from the supermarket with the carrier bags has been excluded from the study, because the weight of a carrier bag would have little or no effect on vehicle emissions and fuel efficiency.
Capital equipment
16 Personal communication from Marks & Spencer plc to the Environment Agency showing an increase in
The environmental impacts linked with the construction and demolition of buildings and the manufacture of machines, equipment and vehicles should in effect be depreciated over the whole of their period of use. These annualised impacts are negligible when compared to the operational burden. Therefore, the construction, maintenance and demolition of industrial buildings and the manufacture of machines, equipment and vehicles have been excluded from the primary data used in this study.
3.4
Allocation and system expansion
Product life cycle systems occasionally yield other products or services as well as the functional unit. The international standard ISO 14044 (ISO, 2006) gives a stepwise procedure for the allocation of material and energy flows as well as environmental releases when this occurs. Allocation should preferably be avoided either through an increase in system detail or through system expansion, where the product system is credited with the avoided burdens delivered by its co-products. Where the system is not expanded, mass should be used to allocate the burdens of shared processes and materials to the product and co-products.
We have used system expansion to show the potential benefits of secondary reuse, recycling, landfill and incineration in this study. System expansion is therefore used for the following processes:
• The avoided production of primary materials when HDPE based materials, LDPE, PP, cardboard and paper are recycled.
• The avoided production of any energy produced from incinerating or landfilling any of the carrier bags.
• The avoided production of bin liners when lightweight carrier bags (i.e. HDPE, HDPE prodegradant and starch polyester bags) are reused in other applications. We have assumed the recycling of material waste from production and at end-of-life avoids the use of virgin material, which is subtracted from the system. We have also assumed that the avoided material is the same as the input material, although in practice this is not always the case. For example, Schmidt and Strömberg (2006) state that
demand and not supply determines the recycling rate of plastics. Therefore, due to the oversupply of post-consumer plastics, recycled material is used in low grade applications which avoid the use of other materials such as wood or concrete. The amount of avoided material included is dependent on performance loss from the recycling process, which is detailed in section 4.5. In the case of post-consumer plastic recycling, the performance loss is greater than post industrial recycling and this is reflected in the study.
Due to the lack of reliable data on recycled content and because of the use of the avoided burden approach to recycling, no recycled content was included in any of the bag types to avoid the double counting of recycling benefits. Although some bags contained recycled content during the reference period, this was not a significant proportion of the carrier bag market.
The generation of electricity from both landfill and incineration are accounted for through the avoided production of grid electricity. None of the bags considered were produced using UK grid electricity and therefore no double counting of the energy benefits of incineration or landfill occurred.
The avoided production of bin liners was also used to reflect the benefits that result from secondary reuse. It was assumed that 40 per cent of the lightweight carrier bags (i.e. the HDPE, HDPE prodegradant and starch-polyester bags) are reused as bin liners and therefore avoid their production and disposal.
In some cases where secondary data are used, allocation has been applied and these are highlighted in the text.
3.5
Data requirements and data quality
3.5.1 Data requirements
A detailed product LCA requires primary data on the materials, energy, waste and emissions specific to the production, use and disposal of the product. The primary data used in this project include the material types and weights to produce carrier bags and primary packaging, the production of carrier bags, transport modes and distances and waste management operations. Secondary data were used for the production of raw materials and waste process emissions (where specific data were not available), electricity generation, fuel production, vehicle emissions and other more minor processes. The data used in this study are described in Chapter 4 and Annex C.
3.5.2 Data quality
Data sources
Most data used in this study are from ecoinvent™ v2. Any other sources are described in the text.
Geographical coverage
The goal of this study is to assess the life cycle environmental impacts of carrier bags used in the UK. In most cases carrier bags are imported from Asia: conventional HDPE, HDPE prodegradant, LDPE and PP bags are produced in China, Indonesia, Malaysia or Turkey. The production of polymers for these bags normally occurs in the same region. However, no datasets were identified for Asia-specific polymer production and European average data have been used instead for all plastic carrier bag systems by adapting the electricity production to the country of origin. However, the amount of electricity used and the efficiency of these production processes is still based on European data.
The paper fibres and the paper bags are assumed to be produced in Europe, due to the high cost of importation from further afield. These are modelled using a European average dataset for paper production. The material used for the biopolymer bags is produced in Italy. The majority of the conversion of biopolymer material into carrier bags
takes place in Norway, and the data used also reflect this. Data for cotton grown
conventionally17 in China have been used for the production of cotton. This is considered
appropriate as most cotton bags available in supermarkets are generally produced in China, India or other Far East countries.
Data used to model transportation methods are based on European transport efficiencies.
Time-related coverage
At the start of the project a time-related coverage of the year 2005/2006 was set for core datasets and assumptions and a reference period of 10 years for literature datasets. The literature datasets covering polymer production date from the late 1990s to the early part of this decade. The dataset for Kraft paper production represents the production processes in 2003. The dataset for starch-polyester blend production represent the production processes in 2006. The dataset for cotton represents the period from 2000 to 2005. The datasets used for the production of carrier bags are from 2003 to 2006.
The datasets for transport are representative of the year 2005 for road transport and 2000 for all other forms of transport. The datasets for energy generation represent the period 2004/2005. The datasets for recycling, composting, landfill and incineration have been taken from the WRATE© database and are representative of the current UK waste management options, generally for the period 2003 to 2006.
Technology coverage
The specific data collected for this study reflect current process configurations, operation and performance. The generic data used reflect process configurations, operation and performance at the time of data collection. However, much of the generic data used represent European rather than region-specific technologies.
3.6
Modelling and calculation of inventories and impacts
For the modelling, generation of inventories and calculation of environmental impacts the LCA software tools SimaPro and WRATE© have been used. SimaPro is a software tool specifically designed for LCA (SimaPro 2009). WRATE (Waste and Resources
Assessment Tool for the Environment) is a software tool designed for the life cycle assessment of waste management options (WRATE 2009).
3.7
Impact assessment
The impact assessment is divided into two stages:
1. In the first stage we used the IPCC 2007 characterisation factors over a 100 year time horizon (IPCC, 2007) to calculate the global warming potential (GWP) for each carrier bag without any primary reuse, but including secondary reuse as bin
liners for lightweight bags. The IPCC method used excludes the impact of biogenic carbon dioxide. Therefore, a zero characterisation factor is assigned to the GWP of biogenic carbon dioxide and carbon dioxide absorbed from the air. The GWP of the conventional HDPE bag was then used as a baseline and the number of times each heavy duty bag would have to be used for their respective GWPs to drop below this baseline was calculated.
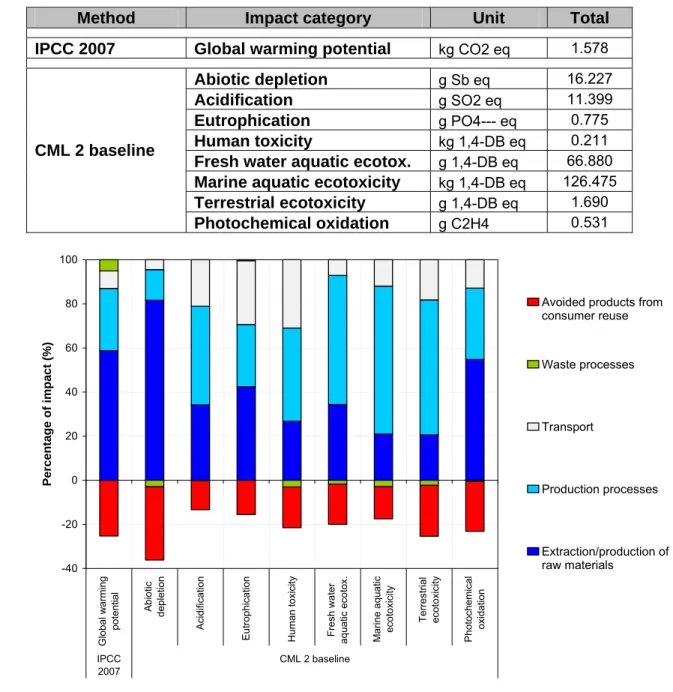
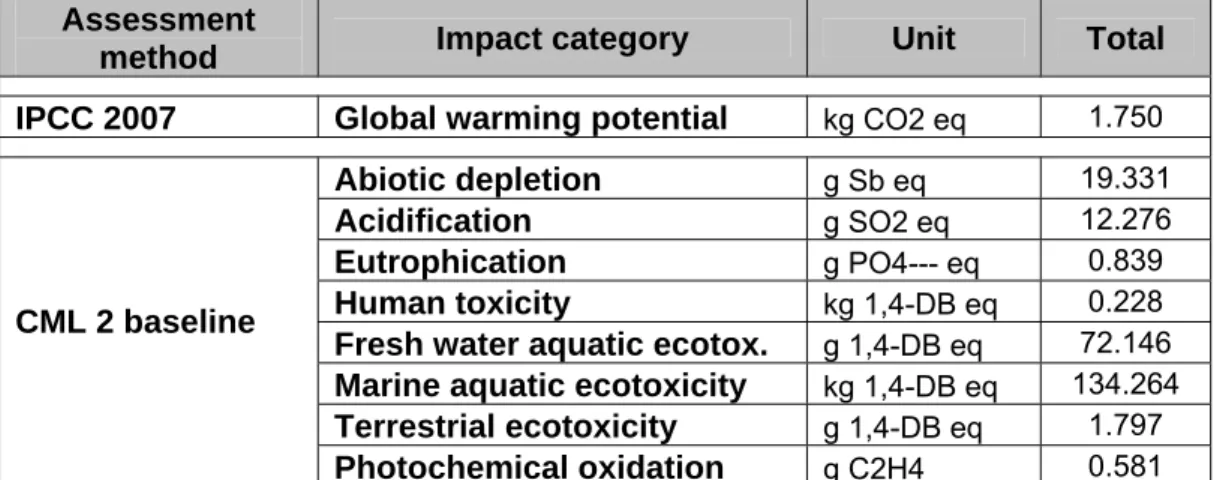
2. For the second stage we used the CML 2 baseline 2000 method (CML, 2001) to calculate the following environmental impact categories:
• Depletion of abiotic resources • Photo-oxidant formation; • Eutrophication;
• Acidification; • Human toxicity; and
• Aquatic and terrestrial toxicity.
The impact categories included are further described in Annex D.
3.8
Sensitivity analysis
A sensitivity analysis allows key variables and assumptions to be changed to test their influence on the results of the impact assessment. We assessed:
• Changing the secondary reuse of the bags;
• an increase in recycling and composting at end-of-life and; • Using a different impact assessment method.
3.9
Reporting
This report fulfils the requirements of the ISO standard for a third party report supporting comparative assertions intended for publication.
4 Inventory analysis
The following sections outline the data and assumptions used to model the materials, production, transport and end-of-life of the carrier bags considered. Unless otherwise stated, inventory data were taken from the ecoinvent™ database version 2. The
lifecycles of each carrier bag system are described in Annex C together with a detailed description of the secondary data used.
4.1
Extraction/production of raw materials
The weight and raw material composition of carrier bags vary depending on the requirements set by the supermarkets and the processing methods used by the producer. The bag weight used here for each carrier bag type is an average based on individual supermarket bag weights and market share (see Annex B) and table 4.1. Table 4.1 The assumed volume, weight, items per bag and required reference
flow for each carrier bag.
The materials used for each carrier bag and its packaging are detailed in Annex C. The material composition of all oil-based polymer bags is based on a combination of data provided by the bag producers and estimates provided by Bunzl Retail18. The material
composition of the paper bag is based on CEPI Eurokraft & Eurosac data for paper sacks (Weström & Löfgren 2005). The material composition of the starch-polyester blend bag is based on data provided by the bag producer. Inventory data for the starch-polyester blend was collected and compiled by technical experts from the manufacturers, Novamont S.p.A.
18 Bunzl plc is a multinational distribution and outsourcing business. Bunzl Retail, a division of Bunzl plc, is
one of the largest suppliers of carrier bags to the UK.
Bag type Volume per
bag (litres)
Weight per bag (g) Conventional high-density polyethylene
(HDPE) bag 19.1 8.12
High-density polyethylene (HDPE) bag
with a prodegradant additive 19.1 8.27
Starch-polyester blend bag 19.1 16.49
Paper bag 20.1 55.20
Low-density polyethylene (LDPE) bag 21.52 34.94
Non-woven polypropylene (PP) bag 19.75 115.83
Several substitute materials were also used when existing data on bag materials were not available. For example, limestone data were substituted for those of chalk and the prodegradant additive was assumed to be cobalt stearate with the impacts of 10 per cent cobalt and 90 per cent stearic acid.
Carrier bags are generally supplied in corrugated boxes or, for conventional HDPE bags, in either corrugated boxes or vacuum packed film. It was estimated that approximately 50 per cent of conventional HDPE bags are supplied in corrugated boxes and 50 per cent in vacuum packed film (Elstob 2007). The film is assumed to be composed of two-thirds polyethylene (PE) and one third polyamide (PA). The weights of the corrugated boxes reported by bag producers fluctuated widely, with some producers reporting the box to be heavier than its content. Consequently, we have estimated the weight of corrugated packaging based on discussions with Bunzl Retail and Simpac (Elstob 2007 and Young 2006). For the starch-polyester blend bag, the corrugated box weight reported by the producer was used, although this was heavier than conventional carrier bag packaging.
4.2 Bag production processes
All plastic bags are produced from plastic melt. This is generally blown and sealed to form a bag, except for the non-woven PP bag which is produced from a molten filament using a spun bonded process. The energy demand for these processes is mainly met by grid electricity and this energy consumption depends on the polymer type, density, production equipment and capacity. The energy consumption and waste generated by the production of 1000 bags is shown in table 4.2.
Based on conversations with industry experts we have estimated that 90 per cent of LDPE bags are produced in Turkey and Germany and 10 per cent in China and Malaysia (Elstob 2007) and that all conventional HDPE, HDPE prodegradant and PP bags are imported from the Far East. Therefore, data on conversion of HDPE, HDPE
prodegradant, PP and LDPE into carrier bags was provided by bag producers in China and Turkey and modelled based on production in these locations. Data on the production of starch-polyester blend into carrier bags was provided by a bag producer in Norway. All grid electricity use was modelled according to the relevant country (China, Turkey and Norway).
The heat used to produce the LDPE bags was assumed to be generated by natural gas in a non-modulating boiler. The heat used to produce the PP bags was assumed to be generated from burning heavy fuel oil in an industrial furnace based on supplier
information. Waste generated during the production of the HDPE, HDPE prodegradant, starch-polyester, LDPE and PP bags is recycled and was in most cases based on data from bag producers. The modelling of the recycling process is discussed in section 4.5. None of the cotton bag producers contacted provided any data on cotton bag production and data on conversion of cotton fabric into carrier bags were estimated. We assumed that the bags were produced in China, using electric sewing machines, and the electricity use was therefore based on previous projects (ERM 2009) and was modelled using Ecoinvent data. All production waste was assumed to be landfilled.
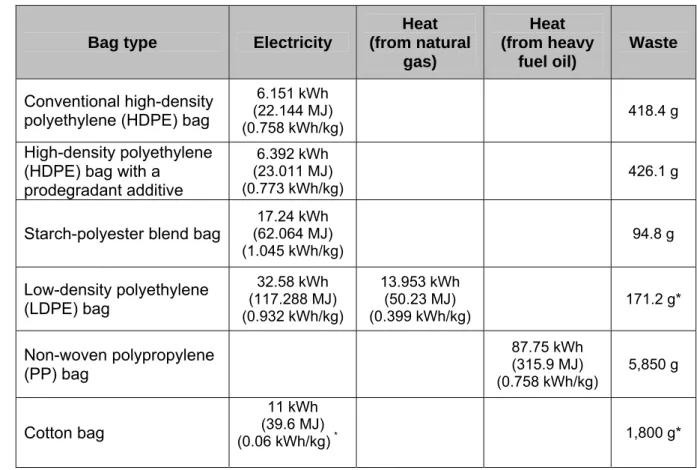
Table 4.2 Energy consumption and waste generation for film and cotton bags (per 1000 bags)
Bag type Electricity
Heat (from natural gas) Heat (from heavy fuel oil) Waste Conventional high-density polyethylene (HDPE) bag
6.151 kWh (22.144 MJ)
(0.758 kWh/kg) 418.4 g
High-density polyethylene (HDPE) bag with a
prodegradant additive
6.392 kWh (23.011 MJ)
(0.773 kWh/kg) 426.1 g
Starch-polyester blend bag (62.064 MJ) 17.24 kWh
(1.045 kWh/kg) 94.8 g Low-density polyethylene (LDPE) bag 32.58 kWh (117.288 MJ) (0.932 kWh/kg) 13.953 kWh (50.23 MJ) (0.399 kWh/kg) 171.2 g* Non-woven polypropylene (PP) bag 87.75 kWh (315.9 MJ) (0.758 kWh/kg) 5,850 g Cotton bag 11 kWh (39.6 MJ) (0.06 kWh/kg) * 1,800 g*
Data used for the conversion of Kraft paper into carrier bags were part of paper sack inventory data published by CEPI Eurokraft and Eurosac (Weström & Löfgren 2005). The data for the production of Kraft paper and the production of paper sacks were aggregated and could not be separated.
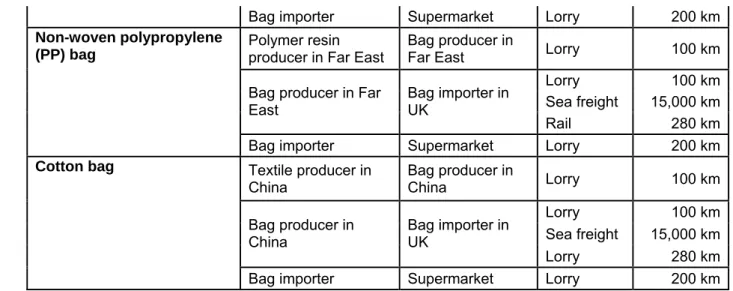
4.3 Transport
The transport of raw materials to each bag production site and the delivery of the finished bag from those sites to the UK supermarkets are shown in tables 4.3 and 4.4.
Transport distances were based on estimated production locations from industry experts (Elstob 2007). More than 98 per cent of HDPE and PP bags imported into the UK are produced in Far East countries such as China, Indonesia and Malaysia. Approximately 90 per cent of LDPE bags are produced in Turkey and Germany with the remainder being produced in the Far East. For this study, we assumed that all HDPE and PP bags were produced in the Far East and 90 per cent of the LDPE bags were produced in Turkey and the remainder in China. Transportation by lorry was based on a 16-32 tonne vehicle.
Table 4.3 The transport scenarios for carrier bags.
Bag type From To Transport
modes Distance
Lorry 100 km
Polymer resin
producer in Far East Bag producer in Far East Sea freight 500 km
Lorry 200 km
Titanium oxide and chalk producer in Far East
Bag producer in
Far East Sea freight 500 km
Lorry 100 km
Sea freight 15,000 km Bag producer in Far
East Bag importer in UK
Rail 280 km
Conventional high-density polyethylene (HDPE) bag
Bag importer Supermarket Lorry 200 km
Lorry 65 km
Polymer resin
producer in Far East Bag producer in Far East Sea freight 500 km
Lorry 200 km
Titanium oxide and chalk producer in Far East
Bag producer in
Far East Sea freight 500 km
Lorry 100 km
Sea freight 15,000 km Bag producer in Far
East Bag importer in UK
Rail 280 km
High-density polyethylene (HDPE) bag with a
prodegradant additive
Bag importer Supermarket Lorry 200 km Polymer resin
producer in Italy Bag producer in Norway Lorry 3,500 km Titanium oxide
producer in Europe Bag producer in Norway Lorry 200 km
Lorry 100 km
Sea freight 1,200 km Bag producer in
Norway Bag importer in UK
Rail 200 km
Starch-polyester blend bag
Bag importer Supermarket Lorry 200 km
Bag type From To Transport
modes Distance
Bag producer in
Europe Bag importer in UK Lorry 1,000 km
Paper bag
Bag importer Supermarket Lorry 200 km Polymer resin
producer in Europe Bag producer in Turkey Lorry 300 km Sea freight 5,000 km
Bag producer in
Turkey Bag importer in UK Rail 280 km
Lorry 100 km
Polymer resin
producer in Far East Bag producer in Far East Sea freight 500 km
Lorry 200 km
Titanium oxide
producer in Far East Bag producer in Far East Sea freight 500 km
Lorry 100 km
Sea freight 15,000 km
Low-density polyethylene (LDPE) bag
Bag producer in Far
East Bag importer in UK
Bag importer Supermarket Lorry 200 km Polymer resin
producer in Far East Bag producer in Far East Lorry 100 km
Lorry 100 km
Sea freight 15,000 km Bag producer in Far
East Bag importer in UK
Rail 280 km
Non-woven polypropylene (PP) bag
Bag importer Supermarket Lorry 200 km Textile producer in
China Bag producer in China Lorry 100 km
Lorry 100 km
Sea freight 15,000 km Bag producer in
China Bag importer in UK
Lorry 280 km
Cotton bag
Bag importer Supermarket Lorry 200 km
4.4 Reuse, recycling & end-of-life
The secondary use of lightweight plastic carrier bags (i.e. the conventional HDPE bag, the prodegradant HDPE bag and the starch-polyester bag) was modelled using the avoided production of bin liners. A study on lightweight carrier bag usage (WRAP 2005) found that 59 per cent of respondents reused all carrier bags, 16 per cent reused most of them, 7 per cent reused around half of them and 7 per cent reused some of them.
Overall it was estimated that 76 per cent of single use carrier bags were reused. The study also asked respondents how they reused carrier bags and found that 53 per cent of respondents said that they used carrier bags as a replacement for kitchen bin liners, as shown in table 4.5.
Table 4.5 The reuse of lightweight carrier bags (WRAP 2005).
Reuse applications Percentage of respondents that reuse single
use carrier bags in each application
Use as a bin liner in kitchen 53%
Use as a bin liner in other rooms 26%
Put rubbish into it then throw it away 43%
For dog / cat / pet mess 11%
Garden refuse 1%
Reuse for supermarket shopping 8%
Reuse for other shopping 10%
To store things at home 14%
For packed lunches 8%
Carry other things in when going out 4%
Put football / Wellington boots in 1%
Give to charity shops 1%
Keep bottles / cans in for recycling 1%
Other uses 2%
We therefore calculated that 40.3 per cent (53 per cent of 76 per cent) of all lightweight carrier bags avoided the use of bin liners. The volume and weight of an average HDPE bin liner was calculated to be 29.3 litres and 9.3 grams, using the same measurement methods applied to the carrier bags in this study (see annex B). Therefore, for every 19.1 litre lightweight plastic carrier bag that was reused, an avoided burden of 6.1grams of HDPE bin liner was subtracted from the system.
The avoided production of virgin materials through recycling during production was also included in the study, adjusted for any loss in material performance due to the recycling process19. In practice, performance loss is often compensated for by the use of an extra
amount of recycled material in a product, making it heavier than one produced only from virgin materials. This means that the virgin material avoided is less than the amount of waste material entering the recycling process. The performance loss for recycled production waste was estimated to be 10 per cent for plastic and 20 per cent for paper. Therefore, 90 per cent of the plastic and 80 per cent of the cardboard entering the
recycling process is included as avoided product and subtracted from the system. Waste recycled during the production of HDPE, LDPE and PP was estimated to consume 0.6kWh of grid electricity per kilogram recycled. Primary packaging cardboard was assumed to be processed to produce recycled board.
The waste collection and end-of-life scenarios for the all carrier bags (including recycling and composting) were modelled using the Environment Agency LCA software tool
WRATE. The assumptions made for end-of-life processing are given in Annex C. At the end-of-life 86 per cent of all bags were assumed to be landfilled and 14 per cent
incinerated (DEFRA 2008). Statistics for paper recycling in England (DEFRA 2007) were also used to model the recovery of primary packaging cardboard in supermarkets with 77.3 per cent of cardboard assumed to be recycled. The remaining card was assumed to be split between landfill and incineration as for the carrier bags. Since the reference period (2006/07), in-house supermarket recycling has increased significantly. However, the recycling figures for that period were provided by DEFRA and were not substantially different to general in-house recycling figures reported by supermarket corporate social responsibility reports at that time.
The inclusion of recycling and composting (for the paper and starch-polyester bags) at end-of-life were also studied in a sensitivity analysis which is detailed in section 5.3.2.
When bag recycling at end-of-life was included, it was assumed that all the plastic carrier bags collected at end-of-life for recycling were exported for recycling to China. In the UK in 2005, 65 per cent of plastic film collected for recycling was exported overseas, mainly to China and other Far East countries (BPI 2007). However, carrier bags, whose main recycling route is currently through in-store collection, are likely to end up as back-of-store supermarket waste, of which more than 95 per cent is exported (Maxwell 2007). The inclusion of HDPE bags with prodegradant additive in the HDPE recycling stream is recognised by industry as potentially reducing recyclate quality. Although prodegradant additives were a small proportion of the polyethylene film being recycled, their separation from conventional HDPE is viewed as highly desirable and the recycling of HDPE
prodegradant bags at end-of-life has been excluded from the study.
5 Impact assessment
The first stage of this impact assessment uses IPCC 2007 characterisation factors to provide the Global Warming Potential (GWP or ‘carbon footprint’) for each carrier bag option. This assesses the GWP impact of the lifecycles detailed in the inventory analysis and includes secondary reuse (i.e. reuse of lightweight bags as a bin liner) but excludes the primary reuse for any bag. The number of times each heavy duty bag has to be used for its GWP to drop below this baseline figure for the conventional HDPE bag was then calculated. As discussed in section 3.2, apart from the secondary reuse of conventional HDPE carrier bags, there were no reliable data on the primary reuse of bags. This approach only shows the number of times each heavy duty bag would hypothetically have to be used to reduce its GWP below that of the conventional carrier bag. Actual reuse is governed by consumer use, bag strength and durability. Therefore, some reuse figures are unrealistic. For example, information on the use of paper bags at a major food retailer in the Republic of Ireland, shows no evidence of any reuse20.
The second stage of the impact assessment calculates impacts for each carrier bag using the CML baseline method and is based on the hypothetical use calculated in stage one. All results and charts shown refer to the functional unit, i.e. the carrier bags required to carry one month’s shopping (483 items) from the supermarket to the home in the UK in 2006/07. The majority of the bar charts show the contribution of each lifecycle stage for each type of carrier bag to an impact category. These lifecycle stages include:
• The extraction/production of raw materials (HDPE, LDPE, PP, paper, starch-polyester blend, etc)
• The production processes (Energy use during the production of the carrier bag) • Transport (The movement of raw materials to the production site and the finished
carrier bag to the supermarket)
• End-of-life (Including collection, landfill and incineration)
• Avoided products and recycling (The avoidance of virgin materials through secondary reuse or recycling)
Positive values represent an adverse impact. Negative values resulting from ‘recycling & avoided products’ lifecycle stages represent a benefit and reduce the overall impact by the amount shown
A sensitivity analysis is also included in chapter 6 to determine the influence of key variables on the results of the impact assessment. The variables assessed in the sensitivity analysis are:
• Changing consumer behaviour with regards to secondary use of the bags; • An increase in recycling and composting at end-of-life and;
• Using a different impact assessment method.
5.1
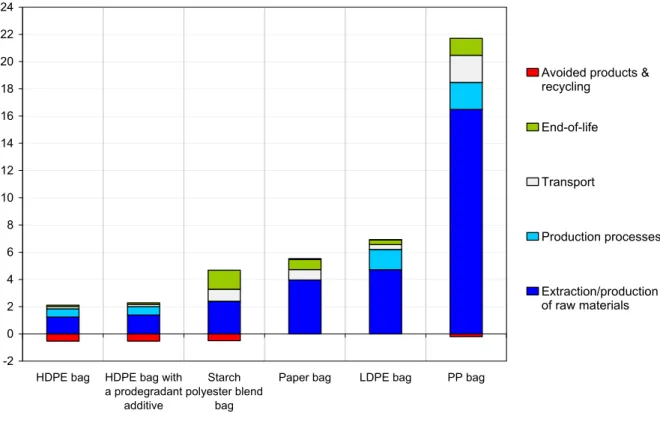
Global warming potential
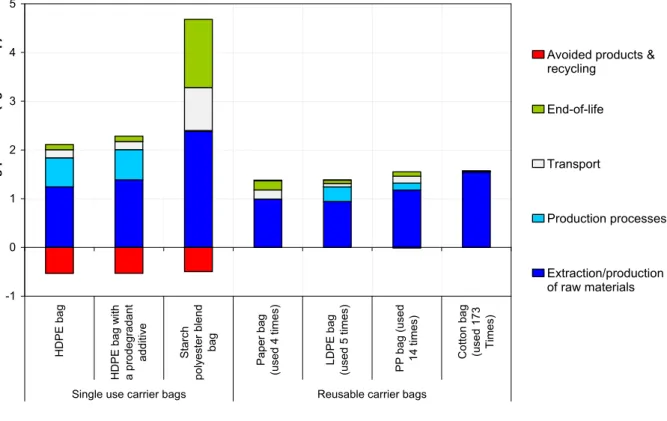
The GWP (excluding primary reuse) for each lifecycle stage of each carrier bag is shown in figure 5.1. The cotton carrier bag is not shown in figure 5.1, because its GWP is more than ten times that of any other carrier bag. Figure 5.2 includes the cotton bag and shows the results based on the number of times each heavy duty bag would have to be used to reduce its GWP below that for the conventional HDPE bag. In round numbers these are: paper bag - 4 times, LDPE bag - 5 times, non-woven PP bag - 14 times and the cotton bag - 173 times.
-2 0 2 4 6 8 10 12 14 16 18 20 22 24
HDPE bag HDPE bag with a prodegradant
additive
Starch polyester blend
bag
Paper bag LDPE bag PP bag
G lobal w a rmin g pot en ti al (kg CO 2 eq.
) Avoided products &
recycling End-of-life Transport Production processes Extraction/production of raw materials
Figure 5.1 The lifecycle impacts of each carrier bag on global warming potential (excluding primary reuse).
The GWP of all of the carrier bags studied is dominated by raw material extraction and production which ranges from 57 per cent of the impact for the starch polyester bag to 99 per cent for the cotton bag. This impact is normally due to the production of the most prevalent material with 64 per cent of the HDPE bag impact generated directly from the extraction and production of HDPE. .
The avoided production of virgin material due to the recycling of post-production waste and primary packaging has a relatively small net effect due to the low proportion of scrap material reprocessed and due to the impacts of cardboard recycling being of similar size to the benefits of avoided production.
Packaging materials generally contribute between 0.4 per cent and 4 per cent of the overall global warming impact for each type of carrier. The GWP from grid electricity used to produce carrier bags varies from 38 per cent of the overall impact for HDPE bags to
0.4 per cent for the starch polyester bag, although the proportion was influenced by the impact of other lifecycle stages such as raw material extraction and production as well as the electricity mix in the country of origin: the HDPE bag is assumed to be produced in China, which relies heavily on electricity generated from burning coal, whereas the starch polyester blend bag is assumed to be produced in Norway where 99 per cent of the grid electricity is generated through hydropower.
The impact of transportation on the total GWP is generally between 0.8 per cent and 14 per cent and is heavily dependent on the road transport distance. The transportation of the starch polyester bag has the highest impact of all carrier transport and transport is also more significant in its lifecycle (21 per cent of total impact) because the starch-polyester blend is carried by road from Italy to Norway and the finished product by road/sea to the UK. In the case of the HDPE, HDPE prodegradant, PP and cotton bags, where bags are shipped from the Far East, the impact of that shipping is between 60-70 per cent of the transport impact.
-1 0 1 2 3 4 5 HDPE bag HDPE bag wi th a prodegradant additi ve St ar ch polyester bl end bag Paper bag (used 4 times) LDP E bag (used 5 times) PP b ag (u se d 14 ti m es )
Cotton bag (used 173 Time
s)
Single use carrier bags Reusable carrier bags
G lobal w a rmi ng po ten ti a l (kg CO2 eq .)
Avoided products & recycling End-of-life Transport Production processes Extraction/production of raw materials
Figure 5.2 The global warming potential impacts of each type of carrier bag assuming each is reused to outperform a conventional HDPE bag with no reuse).
The end-of-life impacts of all bags contribute between 0.2 per cent and 33 per cent to overall GWPs. The end-of-life of the plastic carrier bags (the conventional HDPE, HDPE prodegradant, LDPE and PP bags) is generally between 5 per cent and 7 per cent and is dominated by the GWP of plastic incineration. However, the end-of-life of the paper bag and the starch polyester bag is dominated by landfill which contributes over 18 per cent and 29 per cent respectively to the overall impact. Incineration does provide a 5 per cent