Cold Storage: Why Doha Failed
David Vanzetti and Ralf Peters1
Australian National University and UNCTAD
Contributed paper at the 53rd AARESAnnual Conference, Cairns, Queensland, 11-13th February 2009
Abstract
The WTO negotiations on agriculture were placed in cold storage in July 2008 although 18 of the 20 major agenda items had been agreed. The sticking point was the safeguard measures to control import surges, while the final issue, relating to domestic support for US cotton, was not addressed. Quantitative analysis of the numbers on the table indicate that improvements in market access in the European Union and Japan drive changes in exports and welfare, whereas special safeguard measures, export subsidies, domestic support and special products appear to be of lesser importance. Many developing countries, including most LDCs, would enjoy export gains but experience welfare losses because of higher import prices.
JEL subject codes F13, Q17. Key words: agriculture, trade, WTO
1
Crawford School of Economics and Government, Australian National University, Canberra and Trade Negotiations and Commercial Diplomacy Branch, UNCTAD, Geneva. The views expressed are those of the authors, and do not necessarily represent the views of the United Nations or its member states. Contact: [email protected].
Introduction
Many observers were surprised when the ongoing Doha Round of multilateral trade negotiations collapsed in July 2008. In the contentious agricultural negotiations, 18 of the 20 major agenda items had been agreed, and the tariffs cuts on the table, which would lead to reductions in bound tariffs of around 60 per cent, seemed substantial. It appeared little could be gained by negotiating further. The stumbling block seemed to be safeguard measures to control import surges, with China and India asking for additional safeguards, and the USA insisting that such measures be limited. The final unresolved issue relates to domestic support for US cotton producers. This is a long-running concern, particularly for several West African cotton producing countries.
Had the issues of cotton and safeguard measures been resolved, there is no guarantee of success. Within the single undertaking procedure agreed upon for the Doha Round, whereupon nothing is agreed until all is agreed, any proposal put forward by the major countries must to acceptable to the wider WTO membership, which now includes 150 countries. Many developing countries within the G77, and particularly the G33 with defensive interests, may not have agreed to the tariffs cutting proposals. Analysis presented here illustrates that, in terms of number at least, the majority of developing countries and LDCs would not benefit from the proposals on the table, primarily because they would be required to pay higher prices for agricultural imports, such as wheat.
Members have made significant progress since the previous suspension of the Round in 2006. (See WTO (2008a) for the latest proposal). They agreed that tariff reductions shall be linear cuts within four bands, with the higher tariffs attracting greater reductions. The specific thresholds and tariff reductions have generally been agreed, as has the approach to the selection and broad treatment of exemptions for sensitive and special products. Developed and developing country groups would have different thresholds and linear reductions, plus there would be differentiated treatment for various groups such as LDCs, recently acceded members (RAMs) and small and vulnerable economies (SVEs). Sensitive products will not be totally exempted from tariff reductions, and countries that make use of such exemptions will be required to provide additional access in some
alternative fashion such as increasing the import or tariff rate quota where these exist. A formula for increasing the quota as compensation for a lesser tariff reduction has been discussed but it is not clear how this would work.
The proposed tariff cuts tend to overstate the impact because of the gap in developing countries between bound tariff rates, which are negotiated with the WTO, and the rates actually applied. For many countries the reductions in bound rates would not affect the applied rates, and there would be no economic impact. The major effect of the Round would be to squeeze water out of the tariff, or more technically, remove the binding overhang. However, this does not apply to developed countries, and changes in tariffs in the European Union and Japan could provide opportunities to developing country exporters. However, the scope for increased imports is limited somewhat by the exemptions for sensitive products.
Numerous potential conflicts exist between WTO members. Although the global gains from multilateral liberalisation are likely to be positive, the major effects are distributive, with changes in terms of trade benefiting some countries at the expense of others. Agricultural exporters tend to favour further liberalisation whereas importers tend not to. There is also conflict between countries with preferential access into developed country markets and those without. The current Doha Round of multilateral trade negotiations could results in average agricultural tariff reductions of 60 per cent. This would seriously erode the value of preferential access.
Many developing countries have been pushing for substantial reductions in tariffs on tropical products. Many of the products on the tropical products list (Annex G of WTO 2008a), overlap with products on the preference erosion list (Annex H of WTO 2008a), setting up a conflict in the negotiations between countries that have preferential access and those that do not. This is one of the stumbling blocs in the ongoing Doha negotiations.
South-south trade is a potential avenue for export growth where the quality requirements may not be so demanding. However, LDCs face higher barriers in other developing country markets, in spite of the existence of GSTP, a preferential system among developing countries.
In addition to the ongoing issues of multilateral and regional trade liberalisation, emerging issues impinging on agricultural trade and development include recent commodity price increases and the policy response to climate change. Export taxes to suppress domestic prices had the effect of raising international prices in 2008. Bio-fuel subsidies and mandates are one response to climate change. These appear also to have contributed to rising prices of feedstock on international markets. Rising food and feed prices in 2007 and 2008 appear to have raised concerns about food security, and with it protectionist sentiment.
With a variety of real and potential conflicts, it is not surprising a negotiated outcome is proving difficult.
The purpose of this paper is to review the current proposal on agriculture and attempt to quantify the likely impacts o the proposal if implemented. The outline of the paper is as follows. In the next section current trade flows are presented, followed by a description of impediments to trade. The fourth section outlines the latest proposal, followed by a description of the model and data. Quantitative estimates of the tariff changes and changes in trade flows, government revenue and welfare are presented in the penultimate section. Implications and conclusions are drawn in the final section.
2. Current agricultural trade patterns
The Doha Development Agenda is not limited to developing countries obtaining access to agricultural markets in developed countries. While developing countries as a group are net exporters, more than half the countries are net importers. Although LDCs are considered to be predominantly agrarian societies, 36 of the 50 are net importers of agricultural products. These countries stand to lose from the rising prices likely to follow further liberalisation, particularly if they don't reduce their own applied tariffs.
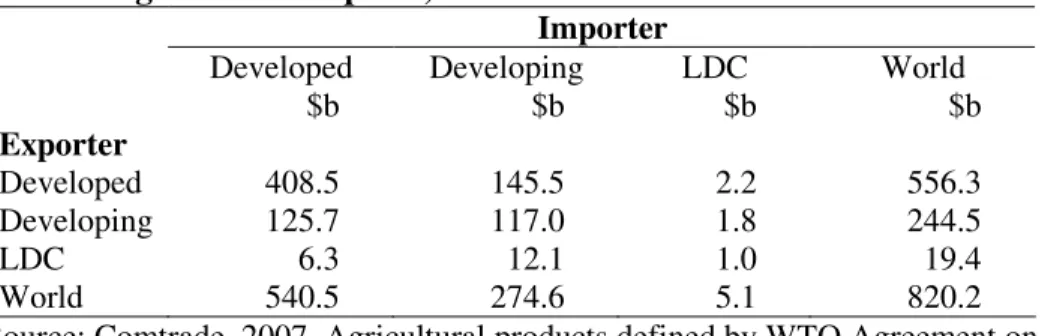
Nonetheless, developing countries as a group tend to export agricultural products to developed countries. $126 billion out of total agricultural exports of $244 billion was sent to developed countries in 2007, whereas $117 billion involved South - South trade (table 1). Developed countries also tend to trade among themselves, $408 billion out of $556 billion. LDCs trade very little with themselves, exporting $12 billion to developing countries and $6 billion to developed countries.
Table 1 Agricultural exports, 2007
Importer
Developed Developing LDC World
$b $b $b $b Exporter Developed 408.5 145.5 2.2 556.3 Developing 125.7 117.0 1.8 244.5 LDC 6.3 12.1 1.0 19.4 World 540.5 274.6 5.1 820.2
Source: Comtrade, 2007, Agricultural products defined by WTO Agreement on Agriculture. Excludes some industrial crops such as rubber.
Agricultural trade is dominated by a handful of countries, United States, Brazil, the European Union, Australia, Canada and China. Total exports of agricultural goods amount to around $820 billion. The developed country exporters tend to be major importers as well, with the notable exception of Australia and New Zealand. Developing countries as a group are net agricultural exporters, as are about half of the individual countries, with Brazil, Argentina, Thailand, Ecuador and Ivory Coast the leading five. This list excludes China, which as well as being a leading exporter is also a major importer. LDCs as a group are net importers, as are 14 of the 50 countries in the group. The leading countries are Myanmar, Uganda, Malawi, Ethiopia and Tanzania. The largest net importers are Bangladesh, Nigeria, Yemen, Angola and Senegal.
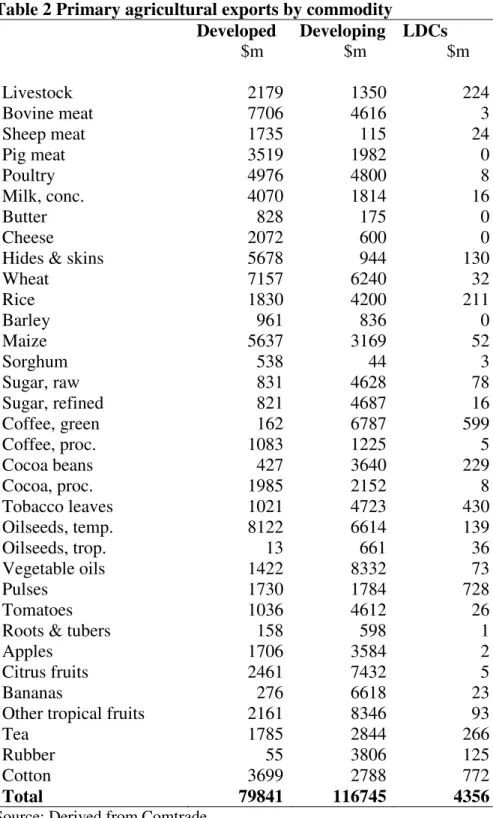
When considering the impact of changes in trade policies or changes in prices, the specific commodities are important. Developed countries tend to export temperate products such as oilseeds, beef, wheat, hides & skins, and maize (table 2).2
2
Table 2 Primary agricultural exports by commodity Developed Developing LDCs $m $m $m Livestock 2179 1350 224 Bovine meat 7706 4616 3 Sheep meat 1735 115 24 Pig meat 3519 1982 0 Poultry 4976 4800 8 Milk, conc. 4070 1814 16 Butter 828 175 0 Cheese 2072 600 0
Hides & skins 5678 944 130
Wheat 7157 6240 32 Rice 1830 4200 211 Barley 961 836 0 Maize 5637 3169 52 Sorghum 538 44 3 Sugar, raw 831 4628 78 Sugar, refined 821 4687 16 Coffee, green 162 6787 599 Coffee, proc. 1083 1225 5 Cocoa beans 427 3640 229 Cocoa, proc. 1985 2152 8 Tobacco leaves 1021 4723 430 Oilseeds, temp. 8122 6614 139 Oilseeds, trop. 13 661 36 Vegetable oils 1422 8332 73 Pulses 1730 1784 728 Tomatoes 1036 4612 26
Roots & tubers 158 598 1
Apples 1706 3584 2
Citrus fruits 2461 7432 5
Bananas 276 6618 23
Other tropical fruits 2161 8346 93
Tea 1785 2844 266
Rubber 55 3806 125
Cotton 3699 2788 772
Total 79841 116745 4356
Source: Derived from Comtrade.
For developing countries the major exports are sugar, tropical fruits, vegetable oils, citrus fruits, green coffee and bananas. LDCs tend to export tropical products cotton, pulses, tobacco and coffee. Most of the protection is on temperate products in developed
countries, but for several products tropical and temperate products are good substitutes. This includes oilseeds, rice and sugar.
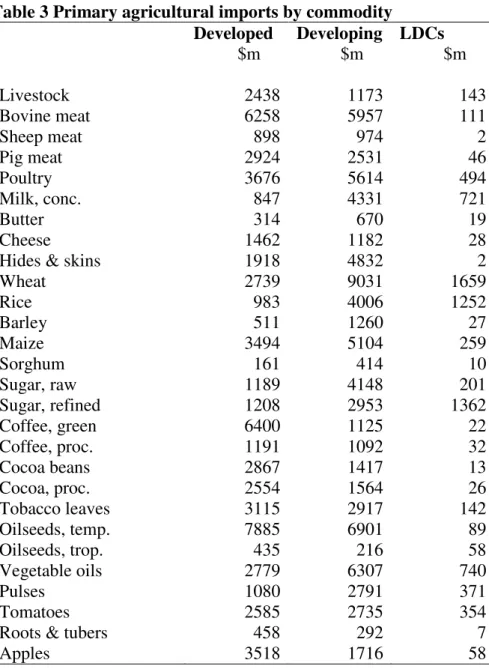
On the import side the major developed country imports are oilseeds, coffee, beef, other tropical fruits, citrus fruits and bananas (table 3). The major developing country imports are wheat, temperate oilseeds, vegetable oils, beef and poultry. Maize and rice are also important, particularly in view of rising cereal prices in 2007 and 2008, which are not reflected in these valuations. Wheat, refined sugar and rice are the major imports for LDCs.
Table 3 Primary agricultural imports by commodity Developed Developing LDCs $m $m $m Livestock 2438 1173 143 Bovine meat 6258 5957 111 Sheep meat 898 974 2 Pig meat 2924 2531 46 Poultry 3676 5614 494 Milk, conc. 847 4331 721 Butter 314 670 19 Cheese 1462 1182 28
Hides & skins 1918 4832 2
Wheat 2739 9031 1659 Rice 983 4006 1252 Barley 511 1260 27 Maize 3494 5104 259 Sorghum 161 414 10 Sugar, raw 1189 4148 201 Sugar, refined 1208 2953 1362 Coffee, green 6400 1125 22 Coffee, proc. 1191 1092 32 Cocoa beans 2867 1417 13 Cocoa, proc. 2554 1564 26 Tobacco leaves 3115 2917 142 Oilseeds, temp. 7885 6901 89 Oilseeds, trop. 435 216 58 Vegetable oils 2779 6307 740 Pulses 1080 2791 371 Tomatoes 2585 2735 354
Roots & tubers 458 292 7
Citrus fruits 5681 4144 73
Bananas 5191 1707 18
Other tropical fruits 6231 4183 187
Tea 2097 2593 206
Rubber 2339 1640 7
Cotton 2277 4833 149
Total 89704 102350 8888
Source: Derived from Comtrade.
3. Current tariff protection
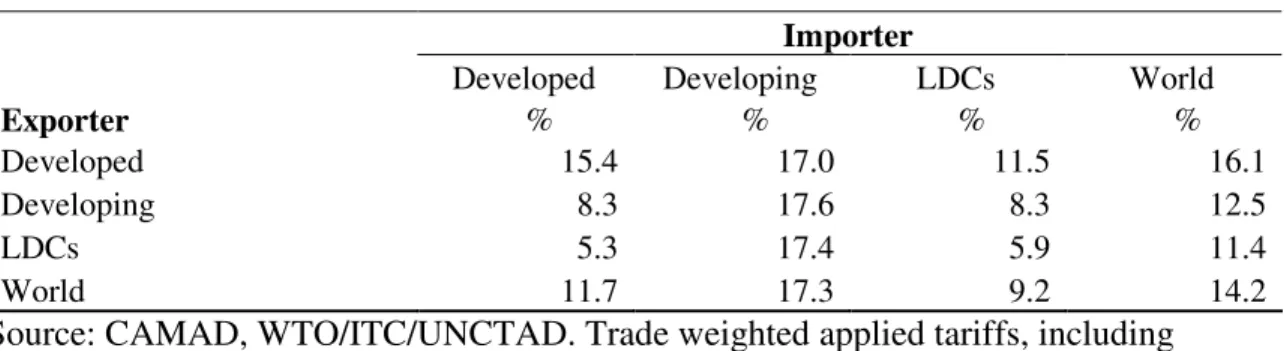
As a generalisation, in developed countries tariff protection is applied predominantly against temperate products grown in other developed countries with similar agronomic and climatic conditions. Typical developing country products such as coffee and tropical fruits are not particularly substitutable with temperate products. Exceptions include sugar (cane and beet sugar are substitutes), vegetable oils, tobacco and cotton. Many tropical products, such as coffee, attract little protection in developed countries. With preferential access provided to developing countries and LDCs, developed countries impose lesser tariffs, on average, on their agricultural imports from LDCs and developing countries, as indicated in table 4. LDCs gain some advantage, but by no means enjoy duty free access. This reflects the composition of trade, with developing countries tending to export commodities that attract high tariffs. On their exports, developed countries tend to face lower tariffs in developing countries and LDCs than they impose on imports from those groups of countries. Developing countries have substantial tariffs on tropical commodities, but on average impose similar levels of tariffs on imports from all groups, in spite of preferential arrangement between developing countries such as the GSTP. LDCs impose lower tariffs on imports from other LDC countries. The LDC global average agricultural tariff, at 9 per cent, is lower than the average for the richer countries. As exporters, LDC face tariffs averaging 11 per cent.
Table 4 Existing agricultural average tariffs
Importer
Developed Developing LDCs World
Exporter % % % %
Developed 15.4 17.0 11.5 16.1
Developing 8.3 17.6 8.3 12.5
LDCs 5.3 17.4 5.9 11.4
World 11.7 17.3 9.2 14.2
Source: CAMAD, WTO/ITC/UNCTAD. Trade weighted applied tariffs, including preferences.
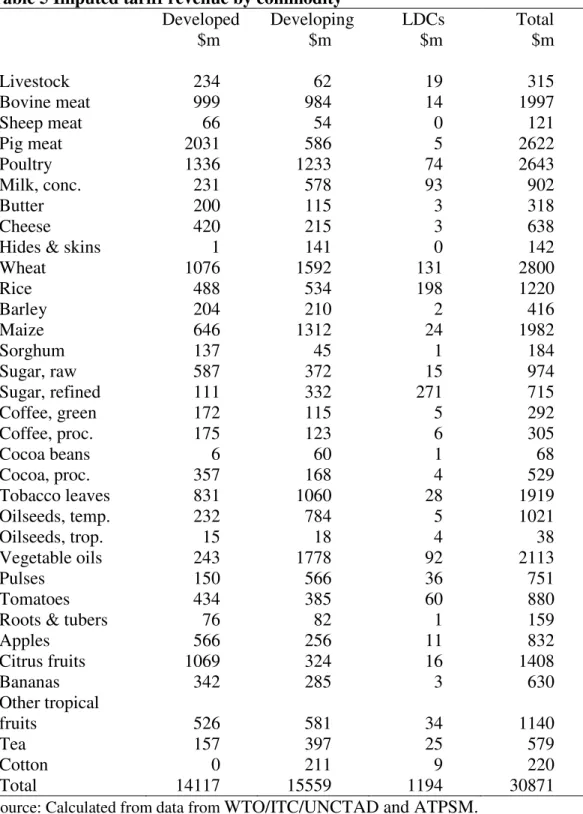
While developing country applied tariffs are around 17 per cent, the average bound rate is 60 per cent. It is bound rates that are negotiated within the WTO. Coupled with exemptions for special and sensitive products, there will be little reduction in applied rates in developing countries, and none in LDCs. Therefore, it is useful to focus on tariff revenue in developed countries. What is important to know is whether it is on exports from developed or developing countries where the reform is likely to occur. Given the importance of exemptions for sensitive and special products, it is useful to examine trade flows and tariffs by sector. One indication is given by the imputed tariff revenue, the value of imports multiplied by the average applied tariff. This is shown in table 5, and illustrates the importance of trade flows when looking at the impacts of reducing high tariffs. Total imputed tariffs revenues on primary agricultural imports are $30 billion, around 15 per cent of global trade for these products. This is evenly divided between developed and developing countries, with LDCs making little contribution to the total. The data also suggests that tariff barriers to developing country imports are of a similar magnitude to developed country barriers. It would be wrong to conclude that agricultural liberalisation is a task for developed countries only. By contrast, while LDCs have some high tariffs, their trade flows are sufficiently small to have only a minimal impact on global exports. They are small enough to be safely ignored by exporters.
At a commodity level, the data in table 5 suggest that rather than rice, sugar and bananas, of greater significance are livestock products (pig meat, poultry, beef), wheat and vegetable oils.
Table 5 Imputed tariff revenue by commodity
Developed Developing LDCs Total
$m $m $m $m Livestock 234 62 19 315 Bovine meat 999 984 14 1997 Sheep meat 66 54 0 121 Pig meat 2031 586 5 2622 Poultry 1336 1233 74 2643 Milk, conc. 231 578 93 902 Butter 200 115 3 318 Cheese 420 215 3 638
Hides & skins 1 141 0 142
Wheat 1076 1592 131 2800 Rice 488 534 198 1220 Barley 204 210 2 416 Maize 646 1312 24 1982 Sorghum 137 45 1 184 Sugar, raw 587 372 15 974 Sugar, refined 111 332 271 715 Coffee, green 172 115 5 292 Coffee, proc. 175 123 6 305 Cocoa beans 6 60 1 68 Cocoa, proc. 357 168 4 529 Tobacco leaves 831 1060 28 1919 Oilseeds, temp. 232 784 5 1021 Oilseeds, trop. 15 18 4 38 Vegetable oils 243 1778 92 2113 Pulses 150 566 36 751 Tomatoes 434 385 60 880
Roots & tubers 76 82 1 159
Apples 566 256 11 832 Citrus fruits 1069 324 16 1408 Bananas 342 285 3 630 Other tropical fruits 526 581 34 1140 Tea 157 397 25 579 Cotton 0 211 9 220 Total 14117 15559 1194 30871
Source: Calculated from data from WTO/ITC/UNCTAD and ATPSM.
4. The latest proposal
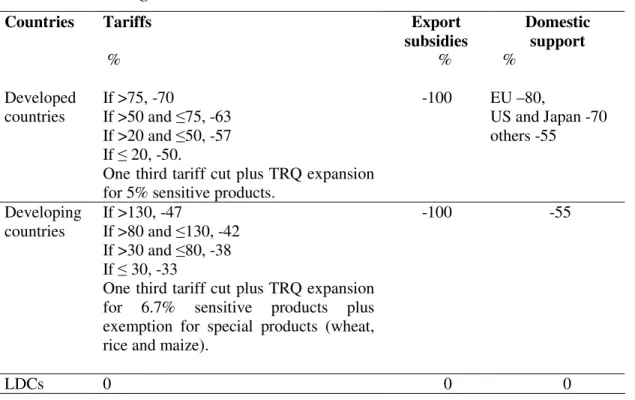
To analyse the likely impact of a Doha Round outcome the draft modalities text (WTO 2008a) is taken as a benchmark. The standard scenario is described in table 6.
Table 6 Standard agricultural liberalisation scenario
Countries Tariffs Export
subsidies Domestic support % % % Developed countries If >75, -70 If >50 and ≤75, -63 If >20 and ≤50, -57 If ≤ 20, -50.
One third tariff cut plus TRQ expansion for 5% sensitive products.
-100 EU –80, US and Japan -70 others -55 Developing countries If >130, -47 If >80 and ≤130, -42 If >30 and ≤80, -38 If ≤ 30, -33
One third tariff cut plus TRQ expansion for 6.7% sensitive products plus exemption for special products (wheat, rice and maize).
-100 -55
LDCs 0 0 0
The exemptions are selected by tariff levels at the 6-digit level, with the assumption being that the most sensitive industries attract the highest tariffs.3 In developing countries the percentage difference between applied and bound rates was takes as the criteria with products having the lowest difference being selected as sensitive products. This reflects the likely approach that developing countries apply the flexibilities in such a way to make as little changes in their applied rates as possible. The sensitive products in developing countries were not selected among maize, rice and wheat because these products were in all scenarios determined as special products (SP) which were totally exempted from any tariff cuts or quota expansions.4
3
The draft text (WTO 2008a) proposes a four per cent limit for sensitive products. However, five per cent has been chosen here because Japan and Canada have expressed doubts about their ability to meet the four per cent limit. In selecting sensitive products, an alternative approach is to use tariff revenue as a criterion, which combines the tariff and the trade flows, following Anderson et al. (2006). However, a possible anomaly with this approach is that sensitive products with prohibitive tariffs, such as Japanese rice, have low tariff revenue and are not selected.
4
Special products can be designated by developing countries only but their selection is most likely subject to criteria related to food security, livelihood security and rural development. The draft text proposes 12 per cent of tariff lines may be designated as exempt, with 5 per cent requiring no cut (paragraph 129) but several countries have expressed reservations about these numbers.
The expansion of TRQs is an important issue that received little discussion at the July 2008 Ministerial. The draft text (WTO 2008a) suggests that where products are declared sensitive, the tariffs cuts may be one third, one half or two thirds of the specified formula cuts for the specific band. To compensate the required expansion of the TRQ for developed countries would be between two and four per cent, depending on the size of the tariff reduction and the initial ratio of the quota to domestic consumption. The maximum expansion, four per cent, applies where the cut is one third of the formula and the TRQ is less than ten per cent of consumption. The required expansion of TRQs is shown in table 7. For developing countries the expansion of TRQs would be two thirds of the developed country rate. Not resolved was whether TRQs could be formed where they did not exist pre-Doha (WTO 2008b). In the simulation it has been assumed they could not.
Table 7 Developed country TRQ expansion
Exemptions as proportion of formula cuts
TRQ/consumption One third Half
Two thirds % % % <10% 4 3.5 3 10-30% 3.5 3 2.5 >30% 3 2.5 2
Source: Calculated from WTO (2008a).
The draft text specifies that the expansion of the quota shall occur on an mfn basis (WTO 2008a paragraph 79), although it is not clear how this might be interpreted. This implies that the quota rent, the difference between the inquota and outquota tariffs multiplied by the value of imports), does not accrue to exporters because competition between them drives out the rent. For rent to be captured by exporters the quotas need to be allocated bilaterally. Many important quotas, such as EU sugar and beef, are allocated on in this manner, with rent going to exporters. The expansion of quotas will in fact be new quotas, with the old ones left in place and retaining their method of administration. It is assumed here that changes in quota rent are allocated to exporters according
to their initial shares. Rents will not increase in proportion to the expansion of quota because of the reduction in outquota tariffs.5
The expansion of quotas is not equivalent to the expansion of imports. The quotas may not be filled, in which case they are not binding and the rent disappears. This implies that consumers are more likely to be paying the lower price rather than a price determined by the outquota tariff.
It is useful to look at the existing TRQs and the likely impact of an expansion. Table 8 shows the change in imports for selected sensitive products. For EU bovine meat for example, the bound tariff of 77 per cent attracts an exemption and the final tariff is 36 rather than 24 per cent. The cuts and exemptions are applied at the HS6 level and aggregated. Not all tariff lines in the bovine meat sector are designated as sensitive so the final tariff appears lower than if the two thirds exemption was applied to every product. The notified TRQ, aggregated over several tariff lines, is 164 kt. This is less than ten per cent of consumption so the four per cent expansion applies. The four per cent is reduced to 1.4 per cent to take account of the tariff lines in the bovine meat category that are not exempt. The TRQ is expanded by 58 kt, which is 1.4 per cent of consumption. This appears to be an overestimate because consumption, 4184 kt, includes product that doesn't relate to the exempted TRQs, such as sausages. However, Annex C of the draft text includes an option that consumption for the whole product category is taken as the base (WTO 2008a).
5
Quota rents are calculated as the quota times the world price times the difference between the inquota and outquota tariffs. An expansion of the quota may be offset by the fall in the outquota tariff, leading to a reduction in rent.
Table 8 TRQ expansion for selected sensitive products Bound tariff Final tariff without exemp-tion Final tariff with exemption Initial TRQ Consump -tion Final TRQ % % % kt kt kt European Union Bovine meat 77 24 36 164 4184 222 Sheep meat 61 20 23 137 1383 142 Rice 51 19 23 84 1340 94 Sugar, refined 76 24 30 1390 20824 1532 United States Sugar, refined 77 25 53 1117 8342 1347 Oilseeds, trop. 17 7 10 53 221 57 Japan Milk, conc. 173 52 71 56 321 59 Rice 503 151 333 495 8044 744 Canada Poultry 145 43 87 45 1158 75 Milk, conc. 127 38 76 0 110 3 Cheese 123 37 43 20 370 22
Source: Calculated from data from WTO/ITC/UNCTAD and ATPSM.
5. The model and data
To assess the impact of WTO agricultural trade policy reform we use ATPSM, a static, partial equilibrium, global agricultural trade model jointly developed by UNCTAD and FAO. The model distinguishes between bound and applied tariffs and includes tariff rate quotas (where the tariff rate depends on whether imports exceed a specified quota), two important features of the post Uruguay Round tariff structure. The model results are driven by changes in policy variables (tariffs, export subsidies, domestic support and tariff rate quotas) which determine changes in domestic prices, consumption and production. This in turn leads to a change in imports and exports, which feed into world prices. The model solves by finding a set of world prices that equate global imports and exports. Intersectoral effects are captured through cross-elasticities, but there are no constraints on the use of resources such as capital, labour or water. Nor is there account
of changes in stocks. Imports are assumed to be homogeneous, with consumers and importers indifferent to the source of their products.6 The results indicate the effects of the policy changes assuming a constant base, 2002-2004. There is no account of exogenous growth over the implementation period. The model is well-documented (Peters and Vanzetti 2004) and is downloadable from the UNCTAD website.7 One limitation is the model commodity coverage, which emphasizes primary commodities but does not include all the products covered by the Agreement on Agriculture. For example, wool and rubber are not included.
Price and production data are an average of 2002 to 2004 and are compiled from FAO statistics.8 Elasticities are from FAO's World Food Model. These are based on a trawling of the literature and are not econometrically estimated specifically for the model. Some of the elasticities were modified by the authors to reflect homogeneity, symmetry and other conditions. The WTO/ITC/UNCTAD World Tariff Profile database is the source of information on applied and bound tariffs. For the quad countries plus Norway and Switzerland ad valorem equivalents have been calculated based on the guidelines agreed to at the Mini-Ministerial in Paris in May 2005. Global quotas, notified to the WTO, are obtained from the AMAD database where available and aggregated to the ATPSM commodity level, as shown in table 2. Export subsidy data are notified to the WTO and modified by UNCTAD (Peters 2006). Bilateral trade flow data relate to 2004 and are from the United Nations Comtrade database.
The present version of the model covers 150 individual countries plus two regions, the European Union, which includes 25 countries, and the Rest of World, which includes those countries, mostly small island economies, not covered explicitly. Developing countries, self-designated with the WTO, include the Republic of Korea, and Taiwan, Province of China. A third group is the 50 least developed countries. There are 34 commodities in the ATPSM data set, including meat, diary products, cereals, sugar,
6
An Armington approach is used on the demand side to differentiate domestic and foreign products, but there is no differentiation between imports from different sources.
7
The standard version of ATPSM is downloadable from www.unctad.org/tab.
8
World prices for many commodities rose sharply in 2007 and 2008. By not taking more recent data into account, the modelling underestimates the positive and negative impacts.
edible oils, vegetables, fruits, beverages, tobacco and cotton. This includes many tropical commodities of interest to developing countries, although many of these have relatively little trade by comparison with some of the temperate products.
Some markets include production quotas. These include EU raw sugar and dairy products, Canadian dairy and poultry and Japanese rice and dairy. In the absence of better information, in most cases the rent is assumed to be 20 per cent, with the exception of EU sugar (30 per cent).9 These quotas are quite significant, with implicit rent (quantity times price times assumed percentage rent) on these products alone amounting to $13 billion. The significance of production quota rents is that changes in domestic prices driven by tariff changes may have no effect on production until all the rent has been eroded.
6. The results Changes in tariffs
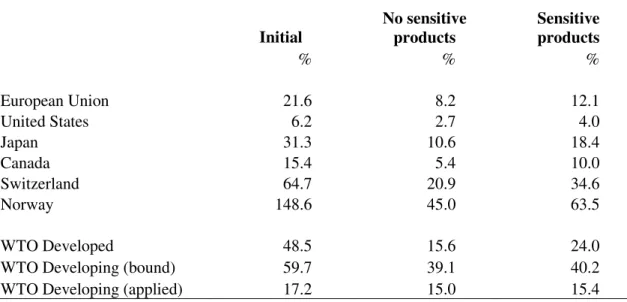
The initial and final bound and applied tariffs are shown in table 9. To illustrate the impact of the sensitive products, the middle column of the table shows average final tariffs in the absence of exemptions. For example, EU tariffs, initially at 22 per cent, would be reduced to an average of 8 per cent under the formula cuts but this average increases to 12 per cent with exemptions for the five per cent highest tariffs. For the EU, a cut in the average tariff of 62 per cent is reduced to 44 per cent. Note that this is not the same as an (unweighted) average cut. The parties agreed to a minimum average cut of 54 per cent.
There is a substantial cut in developing country bound rates, from 60 to 39 per cent, although the change in applied rates is minimal, from 17 to 15 per cent. The addition of sensitive products does little to change the average tariff because many of the higher tariffs are exempted under the special product provisions that relate to staples, such as wheat, rice and maize.
9
The EU dairy quota rent estimate of 20 per cent is supported by Requillart, V., INRA
Table 9. Initial and final tariffs with exemptions for sensitive products Initial No sensitive products Sensitive products % % % European Union 21.6 8.2 12.1 United States 6.2 2.7 4.0 Japan 31.3 10.6 18.4 Canada 15.4 5.4 10.0 Switzerland 64.7 20.9 34.6 Norway 148.6 45.0 63.5 WTO Developed 48.5 15.6 24.0
WTO Developing (bound) 59.7 39.1 40.2
WTO Developing (applied) 17.2 15.0 15.4
Source: Simple averages derived from WTO/ITC/UNCTAD World Tariff Profiles 2006, with WTO CoA method used to calculate ad ad valorem equivalents. Data in table 9 based on entire tariff universe of agricultural products; analysis below based on ATPSM coverage of primary agricultural products.
Changes in prices
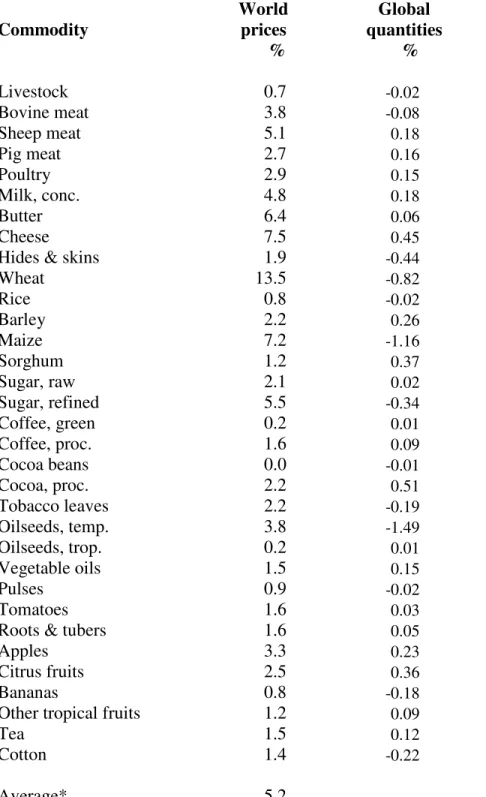
Given the changes in tariffs as specified by the formula cuts and the likely exemptions, domestic prices will fall in those countries where tariffs are reduced. This leads to a fall in production, a rise in consumption and an increase in imports. To satisfy the requirement that global imports equal global exports, it is necessary that prices received by exporters will rise. The market clearing price changes are shown in table 10. The (export weighted) average world price change is 5.2 per cent. The largest changes are for wheat, maize, sugar and livestock products. These are the products with large changes in tariffs associated with large trade flows. The changes of major importance occur in the European Union and Japan.
The large change in the price of wheat is driven by a change in the tariff in the European Union from 56 to 21 per cent and the 80 per cent reduction in domestic support. Wheat is not selected as a sensitive product because it is not among the 5 per cent highest tariffs.
The changes in global quantities are trivial exceeding one per cent in only two cases. Quantities depend on the responses of producers to price changes in different countries. Trade liberalisation is not a solution to the supply shortages and prices rises observed in 2007 and 2008. In many cases production falls because of the removal of support to producers.
Table 10. Estimated changes in world prices and quantities relative to base Commodity World prices Global quantities % % Livestock 0.7 -0.02 Bovine meat 3.8 -0.08 Sheep meat 5.1 0.18 Pig meat 2.7 0.16 Poultry 2.9 0.15 Milk, conc. 4.8 0.18 Butter 6.4 0.06 Cheese 7.5 0.45
Hides & skins 1.9 -0.44
Wheat 13.5 -0.82 Rice 0.8 -0.02 Barley 2.2 0.26 Maize 7.2 -1.16 Sorghum 1.2 0.37 Sugar, raw 2.1 0.02 Sugar, refined 5.5 -0.34 Coffee, green 0.2 0.01 Coffee, proc. 1.6 0.09 Cocoa beans 0.0 -0.01 Cocoa, proc. 2.2 0.51 Tobacco leaves 2.2 -0.19 Oilseeds, temp. 3.8 -1.49 Oilseeds, trop. 0.2 0.01 Vegetable oils 1.5 0.15 Pulses 0.9 -0.02 Tomatoes 1.6 0.03
Roots & tubers 1.6 0.05
Apples 3.3 0.23
Citrus fruits 2.5 0.36
Bananas 0.8 -0.18
Other tropical fruits 1.2 0.09
Tea 1.5 0.12
Cotton 1.4 -0.22
Average* 5.2
Changes in trade flows
Changes in trade flows are shown in table 11 for country groups. The most obvious point from the table is the increase in imports into developed countries and the comparable increase in exports from developing countries. On the other hand, developing country imports increase only marginally as do developed country exports. These are net trade flows for the group and obviously hide large differences for individual countries. The explanation for the absence of any increase in developing country imports is the minimal change in applied tariffs, shown in table 9. For LDCs, there is no reduction in tariffs, and imports are reduced in response to the higher world prices. LDC exports do increase, however, as higher prices reduce consumption, increase production and lead to a greater exportable surplus.
Table 11. Estimated absolute and relative change in imports and exports
Change in imports Change in exports
$m % $m %
Developed 20479 23 1525 2
Developing 270 0 17960 15
LDCs -475 -5 1381 32
Total 20275 10 20866 10
Source: ATPSM simulations.
Some $18 billion of the increase in developed country imports comes from the European Union ($14 billion) and Japan ($4 billion) (table 12). For the European Union the major increases in imports are wheat, sugar, citrus, tomatoes and apples.10 For Japan the major changes in imports are in pig and poultry meat, beef and dairy products. There is a marginal increase in rice imports.
10
Table 12. Estimated absolute change in EU and Japanese imports
European Union Japan
$m $m Livestock 4 265 Bovine meat 884 274 Sheep meat 620 2 Pig meat 0 1380 Poultry 30 880 Milk, conc. 9 99 Butter 12 0 Cheese 91 83
Hides & skins 12 1
Wheat 4174 225 Rice 54 10 Barley 3 17 Maize 796 114 Sorghum 0 24 Sugar, raw 387 70 Sugar, refined 1280 -1 Coffee, green 25 -7 Coffee, proc. 7 24 Cocoa beans -3 0 Cocoa, proc. 35 23 Tobacco leaves 333 0 Oilseeds, temp. 578 47 Oilseeds, trop. -1 2 Vegetable oils 66 11 Pulses 39 24 Tomatoes 1194 100
Roots & tubers 56 3
Apples 1011 83
Citrus fruits 1258 118
Bananas 571 30
Other tropical fruits 388 78
Tea 20 23
Cotton -45 3
Total 13888 4006
Source: ATPSM simulations.
The major suppliers of the additional imports into the European Union, Japan and other developed countries are Brazil, China, India, Argentina and Australia. Exports by sector are shown in table 13. Much of the additional wheat, not shown in the table, is supplied by Russia and the Ukraine. China produces around 90 million tonne of wheat most of which it consumes. An increase in world prices can tip the balance towards excess
production, leading to a significant increase in exports. India produces around 70 million tonne and exports 4 million. The increase in exports represents about one per cent of production.
Brazil is the major supplier of sugar and citrus (mainly oranges), with tomatoes and apples coming from China. Brazil also provides a quantity of the additional pig and poultry meat imported into Japan, although most of it comes from the European Union ($515 million) and the United States ($300 million). Finally, the major suppliers of dairy products are Australia and New Zealand.
Table 13. Estimated absolute change in exports by sector for selected countries
Brazil China India Argentina Australia
$m $m $m $m $m Livestock 129 471 19 18 33 Bovine meat 447 281 103 172 167 Sheep meat 5 1 48 8 92 Pig meat 121 184 15 0 17 Poultry 361 21 35 47 41 Milk, conc. 3 2 7 17 46 Butter 0 0 0 5 18 Cheese 0 14 0 72 101
Hides & skins 8 0 0 6 12
Wheat 1 473 833 292 381 Rice 0 -29 87 1 -8 Barley 0 0 2 1 -19 Maize 181 388 99 118 4 Sorghum 0 0 5 2 0 Sugar, raw 210 0 179 11 41 Sugar, refined 309 36 374 32 31 Coffee, green 6 0 0 0 0 Coffee, proc. 5 0 2 0 0 Cocoa beans 0 0 0 0 0 Cocoa, proc. 9 1 0 1 2 Tobacco leaves 45 93 21 8 0 Oilseeds, temp. 362 13 156 278 18 Oilseeds, trop. 0 0 -1 0 0 Vegetable oils 23 0 1 29 1 Pulses 0 4 1 1 7 Tomatoes 79 569 165 0 0
Apples 20 488 22 27 3
Citrus fruits 551 2 78 66 12
Bananas 35 0 90 0 1
Other tropical fruits 75 -290 280 11 4
Tea 10 19 1 11 0
Cotton 3 2 0 0 15
Total 3002 2742 2630 1235 1019
Source: ATPSM simulations.
Government revenues
Developing countries are commonly concerned about tariff revenues, particularly where these are a significant source of government revenues. One of the advantages of tariffs as a source of revenue is that they are relatively easy to administer. Like any tax, a fall in the rate may lead to an increase in revenues if the volume increase more than offsets it. The changes in tariff revenues are shown in table 14. These exclude expenditure on export subsidies and domestic support. Tariff revenue fall only marginally in developed countries as a group even though the average tariff cut is around 60 per cent.11 This is because there is a 23 per cent increase in imports (table 11). In developing countries as a group tariff revenues rise slightly although there is little change in average applied tariffs and only a small increase in imports. Most of the increase is attributable to Korean imports of maize. Nonetheless, more than half the developing countries modelled reveal a loss in tariff revenue.
Table 14. Estimated tariff revenues
Initial Final Change
$m $m %
Developed 14117 13504 -4.3 Developing 15559 16325 4.9 Least Developed 1194 1132 -5.2
Total 30871 30962 0.3
Source: ATPSM simulations.
Welfare
Static annual welfare gains are shown in table 15. Welfare includes government revenues and gains or losses (surpluses) to producers and consumers. It also includes quota rents received by exporters. These rents are eroded when importing countries reduce their MFN tariffs. Welfare is a
11
superior measure to export growth in assessing various proposals because it takes into account the costs of producing additional exports. Not taken into account here are intersectoral effects, dynamic gains associated with investment, competition and technology, employment effects and the cost of moving resources between sectors.
The first observation is that the bulk of the welfare gains go to developed countries, in spite of the round being focused on development. This is not only because it is the developed countries that provide the bulk of the protection but also because it is these countries that are making the bulk of the cuts. Developing countries have high agricultural tariffs, but relatively low trade flows. They may become worse off for three reasons: (i) rising world price of imports; (ii) elimination of export subsidies; and (iii) erosion of quota rents received on preferential exports. Among the developing countries, the major beneficiaries in terms of welfare are South Korea (maize), Morocco (livestock and sheep meat), India (wheat) and Argentina (wheat). The major losers are temperate product (wheat and sugar) importers China, Mexico, Russia, Algeria and Egypt. About 90 developing countries are worse off in welfare terms, in spite of the fact that gross agricultural exports increase in all these countries.
Table 15. Estimated annual welfare impacts Change in welfare $m European Union 6592 United States 416 Japan 3424 Developed 13056 Developing -173 Least Developed -497 Total 12386
Source: ATPSM simulations.
5. Implications
The value of modelling is to separate the important from the trivial, the wheat from the chaff. Initially in the Doha negotiations emphasis was placed on the removal of export subsidies and domestic support, yet the analysis indicates that it is market access that is by far the most important. More recently much discussion has focused on special
products and the special safeguard mechanism, yet these factors are far less important than sensitive products for developed countries. Little attention has been paid to quota administration, yet the distribution of rents associated with tariff rate quotas is an important factor.
An important consideration made obvious by the modelling is that the major effects of trade liberalisation are distributional. While there are global allocative efficiency gains, calculated here at $12.4 billion per year, these are swamped by gains and losses to consumers, producers and governments. For example, in the European Union total welfares gains are $6.6 billion, but meanwhile producers lose $27.1 billion while consumers benefit by $15.8 billion and taxpayers $17.9 billion. Managing such change is a difficult problem for governments.
The results highlight the importance of the European Union and, to a lesser extent, Japan in the negotiations. These countries combine large trade flows with high protection. China and the United States have large trade flows but relatively low tariffs. India has high bound tariffs but much lower applied tariffs. Countries such as Norway and Switzerland, with high support but low trade flows, are small enough to be ignored.
Ironically, given the apparent conflict between China and the United States on the issue of safeguards at the July WTO meeting, these two countries are not obvious beneficiaries or potential losers in agriculture. China has little or no gap between its bound and applied tariffs, and has little room to move in response to an import surge if it were unable to lift tariffs above pre-Doha rates. However, it stands to gain more than any other developing country in terms of expansion of exports. India also has to consider the livelihoods of a large number of small farmers, but in contrast to China it has room to move in responding to import surges because of the large gap between bound and applied rates.
An important result here is that although all countries appear to gain from increasing exports, these benefits are offset by the higher price of imports for many countries. Coupled with the cost of producing additional exports, around 90 developing countries
appear likely to experience a welfare loss. This implies they need to be compensated elsewhere, in NAMA or services perhaps, to bring the negotiations to a satisfactory outcome.
With respect to individual commodities, of importance is the exemptions chosen by the large developed countries. A simple rule of thumb (i.e. tariffs) is used here, but this ignores other political considerations, such as regional employment. Further, it is likely that countries will choose to spread their exemptions across a wider range of products, weakening the ambition even further.
Unresolved in the negotiations are the special safeguard mechanism and cotton. There is also uncertainty about how the additional tariff rate quotas are to be administered. The means by which the quotas are allocated and the distribution of rents appears to be a hidden yet significant issue to be resolved.
Current developed country policies appear to have only modest effect on developing countries as a group. By holding down prices marginally, many small food importing countries benefit. On the other hand, the lower prices have a negative impact on producer returns in most developing countries, and these outweigh the positive effects of lower consumer prices in food exporting countries. The main beneficiaries among the developing countries are the larger producers of temperate products, Brazil, Argentina, India and China.
The effects of trade liberalisation on high food prices would most likely be minimal. The potential impacts on global supplies are small, of the order of plus or minus two per cent. On the other hand, trade liberalisation has an important role to play in smoothing out price fluctuations caused by domestic supply shocks, caused by drought, floods or frost. It is not surprising that the recent spike in commodity prices was most evident in the rice market, which is very thin, with less than five per cent of production traded internationally. Thinning the market even further through the use of export controls was an understandable response, yet it only exacerbated the problem.
References
Anderson, K., Will Martin and Dominique van der Mensbrugghe, 2006, "Market and Welfare Implications of Doha Reform Scenarios", in Agricultural Trade Reform and the Doha Development agenda, ed. Kym Anderson and William J. Martin, World Bank, Washington, D.C.
AMAD (Agricultural Market Access Database) www.amad.org ATPSM www.unctad.org/tab.
Comtrade (database) 2008, United Nations Statistics Division http://comtrade.un.org/db/default.aspx.
Peters, R. 2006, ‘Roadblock to Reform: The Persistence of Agricultural Export Subsidies’. UNCTAD, Geneva.
Peters, R. and Vanzetti, D. 2004, User Manual and Handbook on Agricultural Trade Policy Simulation Model, UNCTAD, Geneva.
UNCTAD 2008, ‘UNCTAD Handbook of Statistics 2008’, Geneva. WITS www.wits.worldbank.org.
WTO/ITC/UNCTAD 2007, ‘World Tariff Profiles 2006’, Geneva.
WTO 2005, Hong Kong Ministerial Declaration (WT/MIN(05)/DEC), Geneva, 18th December. http://www.wto.org/english/thewto_e/minist_e/min05_e/final_text_e.htm.
WTO 2008a, ‘Revised draft modalities for agriculture’, Geneva, 6 December (TN/AG/W/4/Rev.4).
WTO 2008b, ‘Revised draft modalities for agriculture. Sensitive products: Tariff quota creation’, Geneva, 6 December (TN/AG/W/4/6).