AIP Conference Proceedings 1982, 020004 (2018); https://doi.org/10.1063/1.5045410 1982, 020004 © 2018 Author(s).
Multilayer perceptron, generalized
regression neural network, and hybrid model
in predicting the spatial distribution of
impurity in the topsoil of urbanized area
Cite as: AIP Conference Proceedings 1982, 020004 (2018); https://doi.org/10.1063/1.5045410 Published Online: 30 July 2018Irina E. Subbotina, Alexander G. Buevich, Andrey V. Shichkin, Alexander P. Sergeev, Dmitry A. Tarasov, Andrey G. Tyagunov, Marina V. Sergeeva, and Elena M. Baglaeva
ARTICLES YOU MAY BE INTERESTED IN
Comparison of artificial neural network, random forest and random perceptron forest for forecasting the spatial impurity distribution
AIP Conference Proceedings 1982, 020005 (2018); https://doi.org/10.1063/1.5045411
Chromium distribution forecasting using multilayer perceptron neural network and multilayer perceptron residual kriging
AIP Conference Proceedings 1978, 440019 (2018); https://doi.org/10.1063/1.5044048 A method for language attribution based on assessment of text irregularity
Multilayer Perceptron, Generalized Regression Neural
Network, and Hybrid Model in Predicting the Spatial
Distribution of Impurity in the Topsoil of Urbanized Area
Irina E. Subbotina
2, a), Alexander G. Buevich
1, 2, b), Andrey V. Shichkin
1, 2, c),
Alexander P. Sergeev
1, 2, d), Dmitry A. Tarasov
1, 2, e), Andrey G. Tyagunov
1, f),
Marina V. Sergeeva
2, g), Elena M. Baglaeva
1, 2, h)1Ural Federal University, Mira str., 19, Ekaterinburg, RUSSIA 620002
2Institute of Industrial Ecology UB RAS, S. Kovalevskoy str., 20, Ekaterinburg, RUSSIA 620990. a)iesub@mail.ru b)Corresponding author:bagalex3@gmail.com c)and@ecko.uran.ru d)alexanderpsergeev@gmail.com e)datarasov@yandex.ru f)adi8@yandex.ru g)marin@ecko.uran.ru h)sem@ecko.uran.ru
Abstract. The study is based on the data obtained as a result of soil screening in the city of Noyabrsk, Russia. A comparison of two types of neural networks most commonly used in this type of research was carried out: multi-layer perceptron (MLP), generalized regression neural network (GRNN), and a combined MLP and ordinary kriging approach (MLPRK) for predicting the spatial distribution of the chemical element Chromium (Cr) in the surface layer of the urbanized territory. The model structures were developed using computer modeling, based on minimizing of a root mean squared error (RMSE). As input parameters, the spatial coordinates were used, and the concentration of Cr - as the output. The hybrid MLPRK approach showed the best prognostic accuracy.
INTRODUCTION
For predicting the spatial distribution of impurities on the basis of a limited sample, geostatistics methods (e.g., kriging) is most widely used [1], [2]. Nevertheless, for a number of reasons it is often impossible to collect the number of samples necessary for correct prediction. This is especially true for places with a strong heterogeneity of the simulated environment. Modeling under such conditions requires a more efficient method.
One of these methods is prediction based on artificial neural networks (ANN). The main advantage of this approach is the ability to train the network for a specific task, which makes this approach very flexible. The most widely used learning method is the Levenberg-Marquardt algorithm [3]. In studies [4], [5] the high universality of ANN is shown. Nowadays, this method has been used to create models for solving environmental problems [6]–[9].
Among the various types of ANN, multilayer perceptron (MLP) is most often used in studies related to environmental pollution [10]–[13]; most of them show the superiority of MLP over geostatistical and deterministic methods.
Generalized regression neural networks (GRNNs) are also often used in similar studies. GRNNs are used as interpolators and are known as universal function approximants that can approximate any continuous nonlinear
ANN-based models perfectly identify trends, but hardly distinguish between small variations in the simulated trait [15]. The combination of different approaches makes it possible to improve the accuracy of forecasting. For example, hybrids ANN and kriging have been used successfully in studies [16]–[18].
In this paper, we compare a hybrid model combining ANN and kriging (MLPRK) and two models based on ANN (MLP, GRNN) to predict the concentrations of the chemical element Cr in the upper soil layer of the city of Noyabrsk, Russia.
MATERIALS AND METHODS
Data for the study were obtained from the results of the soil survey in Noyabrsk (N63.1926°, E75.5066°), Yamalo -Nenets Autonomous Okrug (YNAO), Russia (Fig. 1). The area of sampling was approximately 16.5 km2. The spatial location of sampling points is shown in (Fig. 1). In total, 237 topsoil samples at a depth of 0.05 m were collected. Cr concentration was obtained by a chemical analysis.
FIGURE 1. The sampling area: Noyabrsk city
Preparation of the soil specimens and chemical analysis were conducted in compliance with actual standard requirements. The chemical laboratory involved with soil sample preparation and analysis passed through the Russian Federal Certification System. The laboratory meets the general requirements for the competence of testing and calibration laboratories ISO/IEC 17025:2005.
MLPRK is a three-step algorithm combining two different interpolation techniques in one ensemble. The first step implies estimating large-scale nonlinear trends using neural networks (MLP).The second step is the analysis of the stationary residuals by ordinary kriging (exponential model), which is able to provide local estimates. The final step is estimation produced as a sum of ANN predictions and ordinary kriging estimates of the residuals. The hybrid approach algorithm is shown on Fig. 2. In the work, the ANNs were carried out in MATLAB; the ArcGIS application was performed to predict the values by kriging.
FIGURE 2. The hybrid approach algorithm
All the samples were randomly split into independent training and test data sets. The training data set (165 samples) was used for training the networks and for interpolating the surface pollutant distribution. The test data set (72 samples) was used for testing the models only.
To identify differences in spatial structure, depending on the direction, experimental variograms in various directions were applied. In this case, the pairs were selected from the corresponding sector with a given direction, the angle of the solution and (at the discretion) the width of the strip, which narrows the search field at great distances. To detect anisotropy, it is possible to construct variograms in 4-6 directions (directional variogram). A tool that gives an idea on the behavior of the spatial structure is the variogram surface. In case of dependence on the spatial orientation of pairs of points on the variogram surface, it may indicate the presence of anisotropy in the data.
As first ANN type, a feed-forward multi-layer perceptron (MLP) with the Levenberg-Marquardt training method was used. The network structure was determined during computer simulation. The input layer of MLP was compiled with sampling points; the hidden layer consists of a several neurons, and the output layer represents the element concentration in the relevant sample. The selection of the number of neurons in the hidden layer was carried out by the lower total root mean squared error (RMSE) (7) of prediction of the element (Cr) concentration for the training (165 samples), test (72 samples), and a complete set of data (237 samples). The number of neurons was varied from 2 to 20. Each network was trained 500 times and the best of them was selected. Network education quality was checked by the Spearman’s correlation coefficient, mean absolute error (MAE) (6), and RMSE between the results of the
network predictions and the training data set.
As second ANN, GRNN was choosing. The first layer in the GRNN resembles the RBF with the amount of neurons that equivalent to the quantity of input vectors. Choosing the SPREAD parameter of the RBF, which is known as a smoothing parameter, determines the width of the input area, to which each basis function responds. It is the distance from the center of a Gaussian where the value is one-half of the peak value. GRNN network had 165 input neurons according to 165 sampling points formed the training data set. During the simulation, the SPREAD parameter varies from 0.01 to 0.30 with step 0.01; in total, 300 simulations were done.
The starting procedure for the residual kriging is the prediction of residual values by the neural network in the test points. Residuals in the neural network can be defined as follows:
ݎሺݔሻ ൌ ܼሺݔሻ െ ܼேேሺݔሻ, (1)
where r(xi) are the residuals of data set xi, Z(xi) are the measured values, ZANN(xi) are the values estimated by the
neural network. The resulting residuals were estimated using kriging. Evaluation in ordinary kriging (OK) is constructed as a linear combination of input data:
ݎைሺݔሻ ൌ σ ߣݎሺݔሻ, (2)
where rOK is the estimated value at the point xusing OK, λi(x) are the optimal weights with the condition Σλi = 1,
predict the research field’s residuals. The final evaluation of the pollutant content Y(xi) was obtained as the sum of the
neural network evaluation and residuals evaluation by kriging:
ܻሺݔሻ ൌ ܼேேሺݔሻ ݎைሺݔሻ. (3)
The methods proposed in the study were verified by comparison with a stochastic interpolation method cokriging. We also compared the accuracy of predictions.
The performance of prediction models was based on the model error statistics. The predictive accuracy of each
selected approach was verified by the Spearman’s rank correlation coefficient r, MAE (6) and RMSE (7) between the prediction and raw data from the training data set.
ܯܣܧ ൌσసభȁ௭ሺ௫ሻି௭ሺ௫ሻȁ
, (4)
ܴܯܵܧ ൌ ටσసభሺ௭ሺ௫ሻି௭ሺ௫ሻሻమ
, (5)
where zmod(xi) is a predicted concentration (ANNs, cokriging), z(xi) is a measured concentration, n is a number of
points.
RESULTS AND DISCUSSION
The descriptive statistics of Cr concentration are shown in the Table 1.TABLE 1. Descriptive statistics of the modeled element (Cr), mg/kg.
Element Min Max Mean SD CV Skewness Kurtosis Median
Cr 16.6 140 62.4 24.2 0.39 0.81 0.44 58.8
Table1 shows that Cr concentration has a positively skewed and platykurtic distribution type. The Cr
concentrations in all sampling points were from 16.6 to 140 mg/kg, with an average value of 62.4 mg/kg and a standard deviation of 24.2 mg/kg. Due to the skewness of the distribution, the median value (58.8 mg/kg) is more representative of the average Cr content in the study area than the arithmetic mean. The result of the Chi-Square test shows that this variable is close to normal distribution (p=0.18).
Direction variograms are constructed in six directions (0°, 30°, 60°, 90°, 120° and 150°) (Fig. 3a) to demonstrate differences in the spatial structure. In all these directions the anisotropy of the raw data is invisible on the variograms (Fig. 3(a)) and on the variogram surface (Fig. 3(b)).
(a) (b)
FIGURE 3. Variograms in six directions (a); variogram surface for Cr concentration (b)
The final configuration of the MLP network was 2-6-1, what means that the hidden layer contains 6 neurons (see Fig. 4). For networks training 165 sampling points formed the training data set that was applied.
During the simulation for GRNN building, the SPREAD parameter varies from 0.01 to 0.30 with step 0.01; in total, 300 simulations were done. The minimal RMSE was achieved with SPREAD parameter of 0.035 (see Fig. 5).
FIGURE 4. MLP framework selection based on RMSE minimization: root mean square error (RMSE) of the neural network for test, training and overall data under different neuron number in the hidden layer for Cr
FIGURE 5. GRNN framework selection based on RMSE minimization: root mean square error (RMSE) of the neural network for test data under different spread parameter of the network for Cr
TABLE 2. Accuracy assessment indices of the Cr concentration.
Method correlation coefficient Spearman’s rank RMSE, mg/kg MAE, mg/kg
MLP 0.41 19.0 14.7
GRNN 0.09 20.0 15.0
MLPRK 0.42 18.8 14.8
Table 2 shows the parameters used to compare the performance of the different methods (the best values demonstrated by MLP-based models are in bold). MLP and MLPRK have shown increase in modeling accuracy comparing to GRNN. MLP-based models had smaller RMSE and MAE than GRNN (about 5% and 2% improvement). The basic GRNN model demonstrated an unexpectedly low correlation coefficient. This means that the method cannot be applied for modeling in our case. Application of the hybrid approach (MLPRK) gives an increase in the accuracy of prediction, which corresponds to [19].
The MLPRK model reproduces the spatial structure of the Cr distribution quite well. Well-trained MLP neural network model all structured information. Directional variograms for the residuals demonstrate a pure nugget-effect that is the absence of a spatial correlation (Fig. 6)
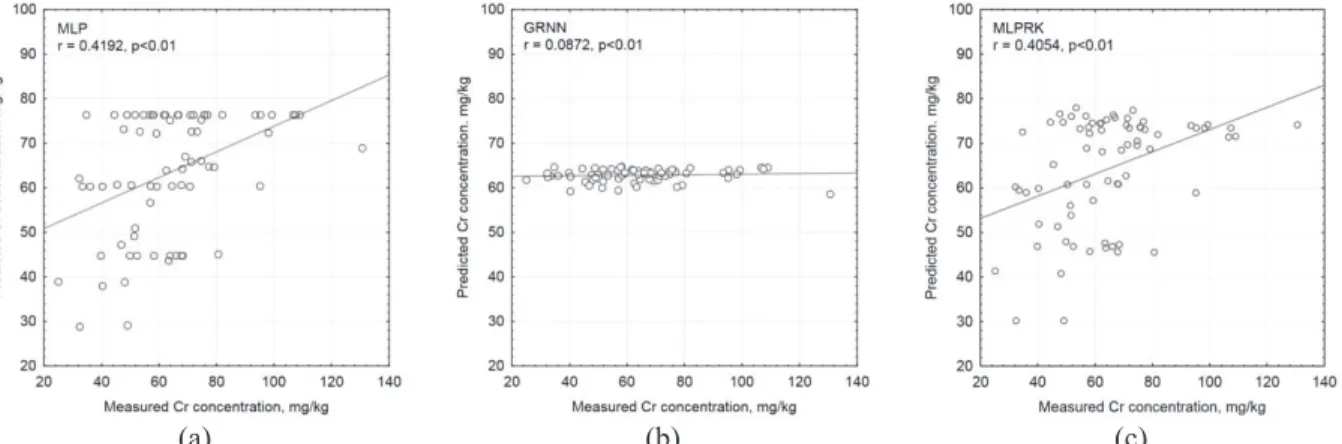
Estimated values at the respective sample sites are shown by various methods and linear regressions with Spearman rank correlation coefficients r (Fig. 7). Evaluation of ANN residues by ordinary kriging allows smoothing high and low values of chemical element concentrations, which allows to improve the accuracy of forecasting.
FIGURE 6. Variograms for residuals in directions for MLPRK
(a) (b) (c)
FIGURE 7. Comparison of different prediction approaches; r is a Spearman’s rank correlation coefficient; (a) MLP, (b) GRNN, (c) MLPRK
CONCLUSION
Comparison of different types of ANN for predicting the distribution of Cr concentration in the surface layer of the soil of an urbanized area revealed the advantage of models based on MLP. Evaluation of ANN residuals using ordinary kriging reduces ANN prediction errors and improves the accuracy of models.
The results confirm the possibility of hybrid ANN-kriging methods, which can be used to increase the accuracy of modeling in areas that are characterized by high heterogeneity. We assume that the use of additional variables (not just spatial coordinates) that have a significant correlation with the predicted variable, for example, the concentration of joint elements, geographic data, etc., can improve the predictive ability of ANN-based models.
REFERENCES
1. E. A. Yfantis, G. T. Flatman, J. V. Behar, Efficiency of kriging estimation for square, triangular, and hexagonal grids, Math. Geol., 19, 183-205 (1987).
2. P. Goovaerts, Geostatistics in soil science: State of the art and perspectives, Geoderma, 89, 1–45 (1999). 3. A. J. Shepherd, Second-Order Methods for Neural Networks: Fast and Reliable Training Methods for
Multi-Layer Perceptrons, Springer-Verlag, p 145 (1997).
4. C. Bishop, Neural networks for pattern recognition, Clarendon, Oxford, p 504 (1995)
5. D. Graupe, Principles of artificial neural networks.2nd Ed, Advanced series of circuits and systems, World Scientific Publishing Co: Singapore (2007).
6. M. Leuenberger, M. Kanevski, Extreme Learning Machines for spatial environmental data, Computers &
Geosciences. Vol. 85, Part B, 64-73 (2015).
7. F. Liu, X. He, L. Zhou, Application of generalized regression neural network residual kriging for terrain surface interpolation. Proc. SPIE 7492, International Symposium on Spatial Analysis, Spatial-Temporal Data Modeling, and Data Mining, 74925F. (2009).
8. R. Shaker, L. Tofan, M. Bucur, S. Costache, D. Sava, T. Ehlinger, Land cover and landscape as predictors of groundwater contamination: a neural-network modelling approach applied to Dobrogea, Romania. Journal of Environmental Protection and Ecology, 11(1), 337-348 (2010).
9. R. R. Shaker, T. J. Ehlinger, Exploring non-linear relationships between landscape and aquatic ecological condition in southern Wisconsin: A GWR and ANN approach, International Journal of Applied Geospatial
Research, 5(4), 1-20 (2014).
10. K. Koike, S. Matsuda, T. Suzuki, M. Ohmi, Natural Resources Research, 11, (2), 135–156 (2002). 11. B. Samanta, S. Bandopadhyay, R. Ganguli, Exploration and Mining Geology Journal, 11, 69–76 (2004). 12. B. Samanta, R. Ganguli, S. Bandopadhyay, Transactions of the Institution of Mining and Metallurgy, 114, 129–
139 (2005).
13. A.P. Sergeev, A.G. Buevich, A. N. Medvedev, I.E. Subbotina, M. V. Sergeeva, Artificial neural network and kriging interpolation for the chemical elements contents in the surface layer of soil on a background area, 15th International Multidisciplinary Scientific GeoConference SGEM 2015, Conference Proceedings, 2015, Book 3 Vol. 2. 49–56 (2015).
14. K. Mohanty, T. J. Majumdar, Using artificial neural networks for synthetic surface fitting and the classification of remotely sensed data, International Journal of Applied Earth Observation and Geoinformation, 1(1), 78–84 (1999).
15. M. Kanevski, A. Pozdnoukhov, V. Timonin, Machine Learning for Spatial Environmental Data. Theory, Applications and Software. EPFL Press (2009).
16. V. Demyanov, M. Kanevsky, S. Chernov, E. Savelieva, V. Timonin, Neural Network Residual Kriging Application for Climatic Data, Journal of Geographic Information and Decision Analysis, 2, 215–232 (1998). 17. T. Lakes, D. Müller, C.Krüger, Cropland change in southern Romania: A comparison of logistic regressions and
artificial neural networks, Landscape Ecology, 24(9), 1195–1206 (2009).
18. D. A. Tarasov, A. G. Buevich, A. P. Sergeev, A.V. Shichkin, High Variation Topsoil Pollution Forecasting in the Russian Subarctic: Using Artificial Neural Networks Combined with Residual Kriging. Applied
Geochemistry, doi.org/10.1016/j.apgeochem.2017.07.0070, (2017) In Press.
19. F. Dai, O. Zhoua, Z. Lva, X. Wang, G. Liu, Spatial prediction of soil organic matter content integrating artificialneural network and ordinary kriging in Tibetan Plateau, Ecological Indicators 45, 184–194 (2014).