2-1-2018
Subjectivity in Failure Mode Effects Analysis (FMEA) Severity
Subjectivity in Failure Mode Effects Analysis (FMEA) Severity
Classification within a Reliability Centered Maintenance (RCM)
Classification within a Reliability Centered Maintenance (RCM)
Context
Context
Marc Banghart
ERAU, [email protected]
Kari Babski-Reeves
Mississippi State University, [email protected]
Linkan Bian
Mississippi State University, [email protected]
Lesley Strawderman
Mississippi State University, [email protected]
Follow this and additional works at: https://commons.erau.edu/ijaaa
Part of the Industrial Engineering Commons, Other Engineering Commons, Risk Analysis Commons, Systems Engineering Commons, and the Systems Engineering and Multidisciplinary Design Optimization Commons
Scholarly Commons Citation Scholarly Commons Citation
Banghart, M., Babski-Reeves, K., Bian, L., & Strawderman, L. (2018). Subjectivity in Failure Mode Effects Analysis (FMEA) Severity Classification within a Reliability Centered Maintenance (RCM) Context. International Journal of Aviation, Aeronautics, and Aerospace, 5(1). https://doi.org/10.15394/ ijaaa.2018.1191
Customer needs must be translated through identifiable activities into a useful and practical product, to attain high quality and reliability. The collection of activities employed goes by several names, to include the discipline of Systems Engineering, or more commonly the Quality Function in a Quality Engineering environment (Gryna, Chua, & DeFeo, 2007). Customer utilization of a system or product must also be sustained throughout the life-cycle. Failure management strategies must be developed to ensure systems are available and safe for customer use. These activities are crucial to ensure reliable, cost-effective and sustainable products both in the commercial and government sector.
The U.S. Department of Defense (DoD) has recognized alarming trends in the acquisition of new products or systems. First, the percentage of new acquisitions failing to meet reliability requirements is increasing. Second, the percentage of fielded systems that have decreasing durability and reliability performance is also increasing (McLeish, 2010). These trends were expressed in a memorandum to the DoD community from the Director of Systems Engineering in the Office of the Secretary of Defense in 2010. The memo stated that over a 25-year period a staggering 25 percent of defense systems were not found suitable for operational testing. The memo further stated that “there is no question the systems emerging from our design and development efforts are often not reliable” (Gilmore, 2010). More recently, a panel as part of the Committee on National Statistics released a report echoing that problems within DoD acquisition remain since the 2010 Gilmore memo (Panel on Reliability Growth Methods for Defense Systems, 2015). The report states that progress has been made in solving DoD reliability and suitability issues, however, sustained focus on earlier recommendations must continue to reverse the trend.
Resultant poor performance has been illustrated with several examples, including the Early-Infantry Brigade Combat Team (E-IBCT) unmanned aerial system which only achieved 1/10th of its mean time between system aborts requirement (Gilmore, 2010), and more recently the F-35 aircraft (Gilmore, Michael, 2015). As a result, the DoD has instituted several initiatives aimed at reversing the trend. These initiatives include strengthening of oversight and accountability through the Weapon Systems Acquisition Reform Act of 2008, reduction of risk through revitalized Systems and Reliability Engineering processes, standardization of reliability best practices in new programs through a reliability scorecard, and a shift to Physics of Failure (PoF) based reliability prediction (McLeish, 2010).
Additionally, a report from the Defense Science Board (DSB) Task Force on Developmental Test and Evaluation concluded that: “The single most important
step necessary to correct high suitability failure rates is to ensure programs are formulated to execute a viable systems engineering strategy from the beginning, including a robust RAM program, as an integral part of design and development. No amount of testing will compensate for deficiencies in RAM program foundation” (McLeish, 2010).
As stated in the DSB Task Force report (McLeish, 2010), development of a robust RAM program must be accomplished early in design resulting in reduced life-cycle cost while achieving performance objectives. For a product or system to achieve RAM goals the following activities must be performed adapted from (Pulido, 2013) as part of a RAM program:
• Identification of reliability, availability and maintainability goals or requirements,
• Iteratively forecast, measure and verify that these requirements are met, and
• Ensuring quality problems are not induced by manufacturing and assembly procedures.
One significant aspect of a RAM program measures progress towards requirements, which is intrinsically coupled with risk assessment. The risk assessment must identify both technical and programmatic risks to successfully meeting or exceeding these requirements. These must then be further decomposed into high, medium and low risks – and addressed early in design. Identification of these technical risks is not a trivial task and requires both pro-active thinking and rigorous analysis tools or processes. Risk assessment continues after fielding of systems. Field data within structured processes such as Reliability Centered Maintenance (RCM) is typically utilized to assess and refine failure management strategies to include preventative maintenance. Critical to the assessment process is identification and rating of failure modes anticipated during the design or emerging during sustainment.
This paper investigates the role of human subjectivity in rating of failure modes, specifically within the FMECA process, which is one of the most widely utilized risk management and design improvement tool. We explicitly consider severity selection as part of a more extensive Reliability Centered Maintenance (RCM) analysis, which is widely utilized within the DoD community. Severity selection is investigated by varying the amount of input information specific to a failure mode while assessing severity levels as selected by participants. The quantity and relevance of the input information were varied to replicate typical scenarios encountered during FMECA analysis. Additionally, the amount and relevance of the input information may be a contributing factor in inadequate risk
analysis. For example, in new acquisition very little (or no information) is available to analysts, while large amounts of work order (field data) information are available once the system enters sustainment. However, within sustainment environments, there may raise significant quality concerns with the data as discussed by Banghart, Solomon, and Comstock (Banghart, Comstock, & Solomon, 2017).
The paper is organized as follows. The first section provides pertinent background information regarding risk assessment in a reliability engineering context. This is followed by a literature review of identified problems and proposed solutions within the FMECA process to provide the necessary context to the reader. Next, the method of this study is presented followed by results and discussion. Finally, we present areas for future work.
FMEA and FMECA as a Risk Management Tool
Application of risk assessment during the product concept phase, when little or no data is available, is problematic. At this stage in the design, testing has not been performed nor does a physical design exist; however, this is a crucial time to incorporate RAM. In this phase, FMEA or FMECA are frequently utilized, mainly since data is not available to develop failure modes based on the proposed design. The resulting analysis can then be utilized to evaluate weak areas of the design and compare other design alternatives. FMECA is typically considered as an extension to FMEA, with the addition of Criticality Analysis. The reader is referred to Carlson for a complete description of each analysis (Carlson, 2012). Regardless of the analysis process, the variables within FMEA/FMECA are largely quantified by individuals and teams in a qualitative manner.
Risk management consists of several elements, to include assessment, management and risk communication (Pulido, 2013). FMEA/FMECA cradle all parts of this risk management framework. For example, failure modes are identified, along with probability and severity classifications, all of which forms part of risk assessment. However, mitigation strategies for failure modes form part of risk management, while the process itself facilitates risk communication. At the heart of FMEA/FMEC, A are failure modes that are scored. For example, an analysis team may identify 25 different failure modes for a hydraulic system. Failure modes may include items such as internal pump failure, pump cavitation or worn/torn seals. Each failure mode includes a description of the effects. For example, the effects may include reduced pressure or fluid leaks. Failure modes are also traceable to systems and overall functions (such as maintaining system pressure). Each failure mode is scored, with several scales available.
FMEA/FMECA is widely considered as a proactive method to establish a risk management policy (Tay & Lim, 2006; Segismundo & Miguel, 2008; Claxton & Campbell-Allen, 2017). FMEA/FMECA is one of the most widely utilized tools since it is a well-defined process and can be tailored to domain-specific processes or systems. Furthermore, expert opinion can be incorporated, and the analysis can be performed with little or no data.
FMEA has shown success across many industries (Arabian-Hoseynabadi, Oraee, & Tavner, 2010; Welborn, 2010; Chang, Liu, & Wei, 2001; Chang, Wei, & Lee, 1999; Chen, 2007). One benefit of FMEA/FMECA as an analysis tool is that it is structured and usually includes a diverse group of people from different background and experiences. This potentially allows different viewpoints to be incorporated leading to a more robust analysis. The analysis is accomplished by analyzing failure modes, or technical risks that are reasonably likely to occur, along with their associated consequences (or severity). In methodologies such as Reliability Centered Maintenance (RCM), it is further extended to develop mitigation strategies (Bozdag, Asan, Soyer, & Serdarasan, 2015).
FMEA/FMECA also has problems. These problems have received extensive attention in the literature, with several changes proposed to address possible identified shortfalls within the methodology. The research community has firmly established that humans make subjective decisions (Fox & Rottenstreich, 2003). However, this subjectivity has not been extensively studied within RCM. Thus, the reliability or the “extent to which … any measuring procedure yields the same results on repeated trials” (Carmines & Zeller, 1979) is mostly unknown for RCM. This subjectivity is driven by internal biases and has been shown to occur during probability estimation in tools such as fault trees (Fox & Rottenstreich, 2003). Additionally, the subjectivity occurs in most (if not all people) to include experts and novice users (Fox & Rottenstreich, 2003).
FMEA/FMECA requires several variables to be quantified by either individuals, teams or experts and be a complex task. The task complexity is rooted in many related variables (for example, failure mode one influencing the probability of failure mode two), undefined variables (data not available) and that several possible solutions exist (Pohl, 2006). Human bias within tasks has been recognized and a plethora of techniques adapted from evidence theory, grey theory and fuzzy logic have emerged (Song, Ming, Wu, & Zhu, 2014; Yang, Huang, He, Zhu, & Wen, 2010; Chang, Liu, & Wei, 2001; Chang & Cheng, 2010; Chang, Wei, & Lee, 1999). Recent research has also indicated that our biases and behavior is closely tied to our genetic make-up and the underlying cognitive processes (Forgas, Haselton, & Hippel, 2007). Decision making in a clinical setting was explored by
Smith et al. (Smith, Higgs, & Ellis, 2008). In their research, they highlighted that understanding of the problem at hand, and contextual factors are both important in determining outcomes. Thus, they recommend that both the individual’s attributes, as well as context, must be considered.
However, as noted by Bozdag et al. (2015) very little research has been focused on understanding uncertainty and variations ratings amongst experts (Bozdag, Asan, Soyer, & Serdarasan, 2015). Bozdag et al. (2015) further develop a failure mode assessment and prioritization model based on fuzzy logic that both incorporates individual and consensus judgment into a risk rating (Bozdag, Asan, Soyer, & Serdarasan, 2015). As innovative as this model is, there is almost no literature available that illustrates wherein FMEA/FMECA human variability is most prevalent. The healthcare community has performed a few small studies to probe this question, which are detailed in the next section (Franklin, & Barber, 2012, Shebl, Franklin, & Barber, 2009; Shebl). Understanding where variation is most prevalent will aid in developing models that can be validated and ultimately improve the process.
Literature Review
The efforts to strengthen RAM activities early in design emphasize various Design for Reliability (DfR) tools such as FMEA/FMECA. DfR embraces the customer needs and is a process through which customer satisfaction is maximized. The process utilizes numerous integrated tools to support a product (and design) from the cradle to the grave while ensuring the highest reliability at the lowest life-cycle cost. FMEA is used extensively throughout the industry to improve system reliability and aid in risk assessment and is a well-recognized DfR tool. It was utilized as early as the 1960s by the U.S. National Aeronautics and Space Administration (NASA) on programs such as the Apollo, Viking, Voyager and Skylab explorations. The process was also adopted early on by the Society for Automotive Engineers (SAE) in 1967. The use of FMEA spread rapidly to other industries during the 1970s and subsequent years and is now utilized in a variety of industries including military, semiconductors, and the foodservice industry. More recently FMEA has been adopted within the healthcare industry to assess the high-risk process of care (Franklin, Shebl, & Barber, 2012). FMEA is useful in understanding the failure modes of systems or products, qualifying the effects of failure, and aiding in the development of mitigation strategies. It is a useful tool in improving quality, reliability, and the maintainability of designs, and is a critical analysis component in risk management. FMEA can be applied to almost any system or process and thus universally valuable.
The literature is structured as follows. First, we discuss relevant research regarding the validity of FMEA as a risk assessment process (to include comparisons to other tools), followed by a review of scales both in industry and academia. Next, various issues with the Risk Priority Number is discussed, followed by an overview of how FMEA/FMECA is utilized within Reliability Centered Maintenance and military applications.
FMEA Outputs, Rating Scales, and Validity
There are two critical outputs from an FMEA. The first is the associated risk ranking, which aids in the identification of high priority failure modes. The second is the associated mitigation strategy. Methodologies such as RCM have utilized FMEAs along with criticality assessment to develop cost-effective maintenance programs. RCM compares the associated risk and cost of failure with the cost of preventive maintenance or redesign. This comparison is then utilized to determine cost-effective mitigation strategies. In cases where safety is a concern, failure modes should always include some form of mitigation.
While some of the available literature does evaluate the FMEA process and explore possible sources of error, research-based validation of FMEA value and effectiveness severely lacks, as are specific recommendations for improvement of the process, regarding the human factor. Some work has been done within the healthcare community, which previously relied largely upon retroactive risk management, with the goal of quantifying the reliability and validity of FMEA as a technique of risk analysis. Specifically, results from recent studies demonstrated little reliability and validity within the healthcare setting of FMEA. The researchers did not disregard the potential value or conclude that the FMEA process offered no benefit whatsoever, but did apparently reveal flaws which necessitate process refinement (Shebl, Franklin, & Barber, 2009; Phipps, Meakin, Beatty, Nsoedo, & Parker, 2008; Konstandinidou, Nivolianitou, Kiranoudis, & Markatos, 2006; Apkon, Probst, Leonard, DeLizio, & Vitale, 2004; Lyons, Adams, Woloshynowych, & Vincent, 2004). These studies highlighted the discrepancies between the severity ratings selected by different groups as well as the lack of correlation of risks identified. Shebl et al. found that the two different participant groups not only identified different risks, but also rated overlapping risks differently (Shebl, Franklin, & Barber, 2009). Differences were also found between conditions which used consensuses to determine an overall severity rating and those that merely averaged individual ratings (Ashley & Armitage, 2010).
Potts et al. (2014) investigated the validity of structured risk analysis methods. They were specifically interested in comparing the resultant outcomes of
two conditions: analysis using different techniques, and if different groups can replicate risk analysis results using the same technique. They investigated the Structured What If Technique (SWIFT) and HFMEA (FMEA tailored to the healthcare industry) in a workshop setting (Potts et al., 2014). Teams of five participants per group worked together to make decisions using each of the two techniques. Additionally, all the participants were new to risk and task analysis with no experience in either technique. The participants were also provided with a hierarchical task analysis diagram previously developed. First, the risks identified in each technique were compared for overlap (both regarding the actual risk and the associated severity rating) as well as overlap with current risk management processes. The participants identified 61 total risks, with three deemed critical when utilizing the SWIFT approach. The HFMEA resulted in a total of 72 risks, with 12 deemed high risk. The researchers compared the identified risks and concluded that 33 (54.1 percent) risks identified by SWIFT were not identified by HFMEA. In turn, HFMEA had 42 (58.3 percent) risks that were not identified by SWIFT. Additionally, the researchers concluded that there was little overlap of high risks items between the two analyses techniques (Potts et al., 2014).
Various scales have been proposed for both the occurrence, detection, and severity measures. Scales of 1 to 10 are prevalent in the literature. However, five-point scales have also been presented. RCM processes frequently utilize four-five-point scales within the military community (NAVAIR, 2005; Department of Defense, 2012). The reader is referred to Aguilar and Salomon for a comparison of different scales (Aguiar, de Souza, & Salomon, 2010).
Risk Priority Number (RPN) Calculation
The Risk Priority Number (RPN) that is utilized within FMEA is a method aimed at ranking and prioritizing failure modes – to develop mitigation strategies and reduce the overall consequences of the failure mode occurring. The higher the RPN, the higher the possible risk. The goal of the analysis is threefold. First, it provides a way to measure which failure modes pose a significant risk and should be removed or mitigated from the system. Second, it provides insight into which failure modes can be corrected or mitigated. Finally, it provides a basis to determine which failure modes can be ignored (and allowed to occur) with no adverse safety or cost implications (Bowles, 2003).
Depending on the approach followed, there are slight deviations in how the RPN is calculated. If the RCM methodology is followed, criticality is calculated by only including the severity rating and probability of occurrence. Detectability calculations, though not utilized in the RCM methodology, are included in other
methods. Bowles (Bowles, 2003) points out in his mathematical analysis of the RPN that there are significant flaws in that approach. In the case where the RPN is calculated by multiplying Severity (S) with a probability of occurrence (O) and detectability (D), and assuming a range of 1 to 10 for each factor a resulting RPN range from 1 to 1000 is obtained. As explained by Bowles, three factors within the RPN are ordinal scales where items are ranked in series; however, the interval size between measurements are not specified (Bowles, 2003). Siegel (1956) further states that the intervals are determined subjectively and not identical to each other (Siegel, 1956). Thus, conducting multiplication utilizing these factors violates basic mathematical principles (Bowles, 2003; Siegel, 1956). Bowles further highlights four additional concerns with utilizing the RPN in its current form. These include: • Holes in the scale. The RPN scale is not continuous, and various numbers between 1 and 1000 cannot be formed by the product of S, O, and D. This is explicitly evident in higher numbers (600+). Only 120 unique numbers can be formed with 88 percent of the range empty.
• Duplication of RPNs. RPNs can be formed with many combinations of S, O, and D thus making the inaccurate assumption that each factor is equally important.
• Sensitivity to small changes. The RPN can be affected significantly by a small change in one factor, especially if the other factors are large numbers. • Utilizing a single dimension RP to quantify and rank a design encourages
management to set arbitrary thresholds- which may not be realistic.
Several researchers have proposed alternatives to the Risk Priority Number, and more specifically the severity measure. These measures focus on the incorporation of cost as the primary measure of severity. Carmignani (Carmignani, 2009) replaces severity with an impact factor focused on economic loss. Occurrence and detection are also replaced with a frequency and control factor respectively. Carmignani proposes that the method would be used for non-safety related failure modes. Severity derived from internal failure cost (thus cost not observed by a customer) is also considered by von Ahsen (von Ahsen, 2008). Dong utilizes fuzzy logic and utility theory to derive a cost-based severity (Dong, 2007). Rhee and Ishii extend cost-based measures to include delay times, such as logistics and administrative delay (Rhee & Ishii, 2003). Finally, Kmenta and Ishii focus on probability and cost as failure ranking strategies, with a strong focus on the establishment of a failure chain of events and consideration of life-cycle cost (Kmenta & Ishii, 2000).
Military Applications of FMEA
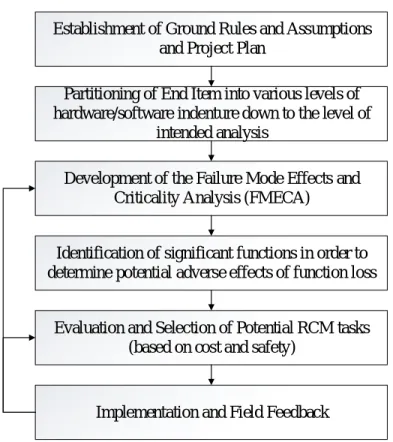
Reliability Centered Maintenance (RCM) utilizes the FMEA process to proactively manage assets or equipment and their associated risk mitigation strategies. In the RCM method, failure modes are identified based on the function and functional failure of the equipment or system under analysis. The method has been widely adopted in the military community and is mandated by the U.S. Navy for application on all major acquisitions or modifications. The military application considers several factors within the analysis to include the probability of occurrence, severity, possible preventive maintenance strategies and the cost of performing maintenance versus a run-to-failure management strategy (NAVAIR, 2005). The reader is referred to the NAVAIR 00-25-403 standard for a discussion and derivation of the various cost equations applicable to different failure management strategies. The RCM process is provided in Figure 1.
Establishment of Ground Rules and Assumptions and Project Plan
Partitioning of End Item into various levels of hardware/software indenture down to the level of
intended analysis
Development of the Failure Mode Effects and Criticality Analysis (FMECA)
Identification of significant functions in order to determine potential adverse effects of function loss
Evaluation and Selection of Potential RCM tasks (based on cost and safety)
Implementation and Field Feedback Figure 1. RCM Process.
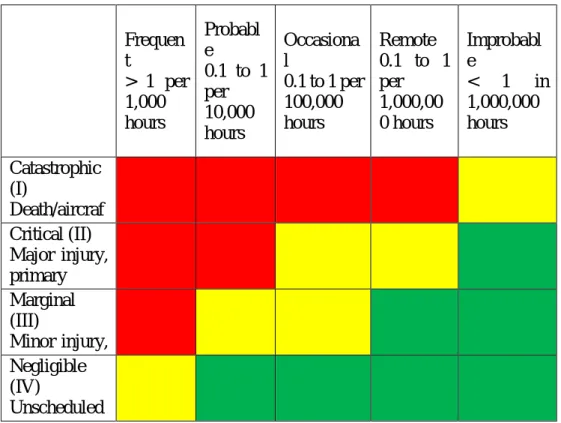
The RCM process utilizes a hazard/risk assessment matrix to visualize the derived criticality of a potential failure mode. The matrix includes the severity and frequency measures, plotted on color-coded X-Y axis. Detection is not considered.
The severity rating is typically selected based on domain expertise and any previously observed failures. The frequency of occurrence is also considered based on available data. The frequency is typically considered by considering both potential and functional failures – which is typically obtained from field data. An excellent discussion of the underlying theory (Potential-to-Functional Failure Curves) can be found in several references to include (Moubrey, 1997; NAVAIR, 2005). The NAVAIR 00-25-403 standard provides an example of such a matrix along with definitions of a four-point severity scale. An example adapted from the standard is provided in Figure 2.
Frequency S eve rity Frequen t > 1 per 1,000 hours Probabl e 0.1 to 1 per 10,000 hours Occasiona l 0.1 to 1 per 100,000 hours Remote 0.1 to 1 per 1,000,00 0 hours Improbabl e < 1 in 1,000,000 hours Catastrophic (I) Death/aircraf t loss/damage > $1 million Critical (II) Major injury, primary mission loss, major cost > $100,000 Marginal (III) Minor injury, cost > $10,000 Negligible (IV) Unscheduled maintenance, damage below $10,000
Figure 2. Hazard Risk Index utilized in RCM process (NAVAIR, 2005) Subjectivity in FMEA
The healthcare industry has also questioned both the reliability and validity of FMEA. Reliability has been explored in several studies, with little research performed on FMEA validity (Shebl, Franklin, Barber, Burnett, & Parand, 2011; Ashley & Armitage, 2010; Shebl, Franklin, & Barber, 2009). Validity is essential since, without it analysis techniques such as FMEA are prone to skepticism
regarding their value, and it is difficult to provide feedback to improve the tool. Furthermore, as stated by Kirwan (1996) techniques that depend on significant amounts of judgment may not adequately and accurately quantify risk (Kirwan, 1996). Despite the concerns with the FMEA methodology, the approach has been shown to improve quality and safety in the healthcare field (Battles, Dixon, Borotkanics, Robin-Fastmen, & Kaplan, 2006).
Validity is defined as a measure to assess whether an instrument measure what it was designed to measure (Bowling, 2002; Smith, 2002). Thus, in the context of FMEA, validity aims to measure whether or not risks are proactively and thoroughly identified, parameter estimates line up with observed data and identify if the tool is indeed appropriate. Shebl et al. (2012) investigated FMEA validity utilizing several measures. These included face validity, which refers to how relevant experts view the tool. Context validity was defined as a measure of how well the FMEA results in mirror information available in the application domain. Criterion validity refers to the level of correlation of the FMEA outputs to other measurement systems of the same variables. Moreover, finally, construct validity was used to “determine the extent to which a particular measure relates to other measures consistent with theoretically derived hypotheses concerning the concepts that are being measured” (Shebl, Franklin, & Barber, 2012).
Their study, conducted during 2012, utilized two groups from a hospital setting that were tasked to complete an FMEA on prescribing, administering and monitoring of two prescription drugs (Shebl, Franklin, & Barber, 2012). Both groups were familiar with the process and provided the same input information. The researchers observed how these drugs were administered in a clinical setting and mapped the subsequent process to a flowchart. This was then compared to the mapped processes as determined by the FMEA teams to address face validity. Although there were differences between the FMEA flowcharts and the observation flowchart, the major steps in the process correlated well. Thus, the team concluded that face validity appeared adequate for FMEA. Criterion validity was deemed low by Shebl et al. due to several reasons. First, 59 percent of failures observed in clinical data were identified by the FMEA team. Additionally, the probability of failure and the actual observed frequency in the clinical data showed little correlation. In general, the FMEA team appeared to estimate the probabilities higher than actual observed data indicated. The team also scored failure modes higher regarding severity than the data indicated (Shebl, Franklin, & Barber, 2012). The research team concluded that FMEA should not be solely utilized to understand and quantify risk in a healthcare setting.
Several research gaps remain in the literature. The impact of data quality and quantity on the severity selection within FMEA/FMECA has not been studied
within the aerospace domain. Limited research has been conducted on rating selection and probability estimation within the healthcare community. However, much of research focused on identification/improvement of severity and occurrence scales. The research findings are essential to identify factors that impact the severity score, and thus substantially influence the overall risk reduction strategies both in the new acquisition and fielded systems.
Method
As discussed in the literature review, numerous concerns with FMEA/FMECA exist. However, FMEA/FMECA is most likely going to continue to be used as an analysis and risk management tool as evidenced by recent healthcare applications. Additionally, FMEA/FMECA is extensively utilized within the military community as part of the RCM process. Thus, to reduce the human subjectivity, it is vital first to quantify and demonstrate this uncertainty. The researchers formulated a study to investigate human subjectivity, which is detailed in this section. The study utilizes an in-between subjects design with three levels of trial and two levels of experience. An in-between design was chosen since domain expertise is often deemed as important and as a mitigating factor regarding judgmental bias. Thus, a key focus of the study was to assess if any association could be identified between experience level and severity selection. Each trial was expected to take approximately 15 minutes and included a cool-down period of several days before the next trial was conducted. The design was selected to ensure that participants were not overburdened with analysis tasks and since the analysis was not focused on the comparison of individuals. Rather, the objective of the study was to determine if any association existed between experience levels and information quantity on severity selection.
All study materials and protocols were reviewed and approved by an Institutional Review Board (IRB). Informed consent was obtained from all participants.
Participants
Participants were recruited from a large aerospace corporation and consisted of engineers and analysts with varying degrees of education. All participants that had experience (at least one year) performing FMEA/FMECA analysis were accepted into the study. All participants were actively involved in real-world RCM analyses utilizing FMEA/FMECA and well versed in failure mode analysis at the time of the research.
Sixty percent of the participants had 15 or more years of general work experience, while fifty-three percent had greater than six years specifically performing FMEAs. The participant pool included a significant number of former military personnel (73 percent) with extensive experience troubleshooting, repairing and analyzing military aircraft. Many of the participants had a college education (93 percent). The participants had extensive experience with the systems utilized within the study, thus were considered domain experts. Participants were classified as experienced or inexperienced regarding FMEA/FMECA. For this study, an experienced FMEA user was considered to have 10 or more years of experience.
Materials
Participants were provided a worksheet to complete nine failure modes. Materials were developed utilizing NAVAIR 00-25-403 guidelines (NAVAIR, 2005). The NAVAIR 00-25-403 standard was utilized since the participants were very familiar with the standard and associated processes. Additionally, the researchers did not want to introduce an unfamiliar scale or additional training requirements and thus potentially impact the results. The severity scale was selected within this study since it was assumed that frequency would be determined based on numeric methods (as discussed in the NAVAIR 00-25-403) within an RCM analysis. The standard utilizes a severity scale that consists of four levels (I through IV). Category definitions were based on the levels as identified in MIL-STD-882E, which included consideration of both failure cost and safety consequences (Department of Defense, 2012).
Three systems were analyzed by the participants. The systems included an aircraft flight control system (trial one), landing gear system (trial two) and a hydraulic system (trial three). The three systems were selected since they could be described in a general sense (without reference to a specific aircraft), were all important aircraft systems and were well understood by all participants.
Participants were not provided any information during the first trial, except a system description and the failure modes. The participants were provided irrelevant failure and mishap data during the second trial, along with a system description. Irrelevant data consisted of failure information that was not directly tied to any failure mode under analysis. For example, during trial two the participants were informed that the aircraft experienced ten mishaps related to the landing gear during the past five years. Participants were informed that fifty percent of these mishaps led to serious injury and thirty percent of the mishaps had unknown causes. The remaining mishaps had been attributed the wheel and tire
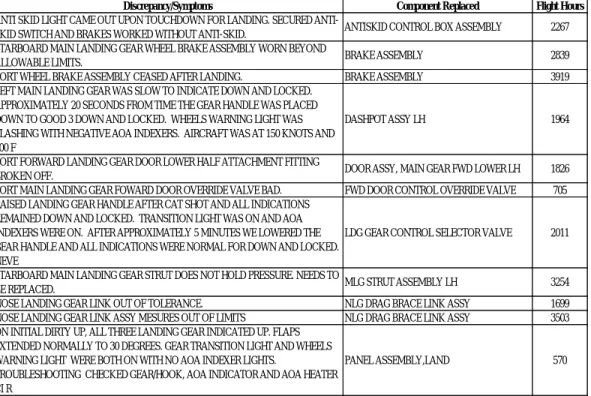
assemblies. Relevant data (thus data that could be connected to the failure modes under analysis) was provided in trial 3. In contrast to trial two, participants were informed that a significant proportion of mishaps had been attributed to hydraulic pumps (which did have a corresponding failure mode). Failure data consisted of 80 data points for trial two and three respectively and included which component failed, failure symptom(s) and flight hours at failure. Failure data was modeled on typical data collected in field environments and provided in Figure 3 for reference. All data was provided to several subject matter experts before the study for a review, to ensure the information was representative of typical data available during RCM analyses.
Figure 3. Typical Field Data utilized within FMEA/FMECA Studies
A sample system description is provided for reference: “The analysis utilized a generic fighter jet horizontal stabilator system. The pilot utilizes a control stick in the cockpit (with a hydraulic assist) to transmit inputs to the horizontal stabilator actuator mechanically. The actuator receives inputs through mechanical linkage and adjusts the horizontal stabilator appropriately utilizing hydraulic power. The hydraulic actuator includes a cylinder which contains a piston. The hydraulic actuator has several seals to prevent fluid leakage from the piston rod. The stabilator is critical to maintaining control of the aircraft during all phases of flight.” Failure modes for the flight control system included hydraulic actuator
Discrepancy/Symptoms Component Replaced Flight Hours
ANTI SKID LIGHT CAME OUT UPON TOUCHDOWN FOR LANDING. SECURED
ANTI-SKID SWITCH AND BRAKES WORKED WITHOUT ANTI-ANTI-SKID. ANTISKID CONTROL BOX ASSEMBLY 2267 STARBOARD MAIN LANDING GEAR WHEEL BRAKE ASSEMBLY WORN BEYOND
ALLOWABLE LIMITS. BRAKE ASSEMBLY 2839
PORT WHEEL BRAKE ASSEMBLY CEASED AFTER LANDING. BRAKE ASSEMBLY 3919 LEFT MAIN LANDING GEAR WAS SLOW TO INDICATE DOWN AND LOCKED.
APPROXIMATELY 20 SECONDS FROM TIME THE GEAR HANDLE WAS PLACED DOWN TO GOOD 3 DOWN AND LOCKED. WHEELS WARNING LIGHT WAS FLASHING WITH NEGATIVE AOA INDEXERS. AIRCRAFT WAS AT 150 KNOTS AND 600 F
DASHPOT ASSY LH 1964
PORT FORWARD LANDING GEAR DOOR LOWER HALF ATTACHMENT FITTING
BROKEN OFF. DOOR ASSY, MAIN GEAR FWD LOWER LH 1826 PORT MAIN LANDING GEAR FOWARD DOOR OVERRIDE VALVE BAD. FWD DOOR CONTROL OVERRIDE VALVE 705 RAISED LANDING GEAR HANDLE AFTER CAT SHOT AND ALL INDICATIONS
REMAINED DOWN AND LOCKED. TRANSITION LIGHT WAS ON AND AOA INDEXERS WERE ON. AFTER APPROXIMATELY 5 MINUTES WE LOWERED THE GEAR HANDLE AND ALL INDICATIONS WERE NORMAL FOR DOWN AND LOCKED. NEVE
LDG GEAR CONTROL SELECTOR VALVE 2011
STARBOARD MAIN LANDING GEAR STRUT DOES NOT HOLD PRESSURE. NEEDS TO
BE REPLACED. MLG STRUT ASSEMBLY LH 3254 NOSE LANDING GEAR LINK OUT OF TOLERANCE. NLG DRAG BRACE LINK ASSY 1699 NOSE LANDING GEAR LINK ASSY MESURES OUT OF LIMITS NLG DRAG BRACE LINK ASSY 3503 ON INITIAL DIRTY UP, ALL THREE LANDING GEAR INDICATED UP. FLAPS
EXTENDED NORMALLY TO 30 DEGREES. GEAR TRANSITION LIGHT AND WHEELS WARNING LIGHT WERE BOTH ON WITH NO AOA INDEXER LIGHTS.
TROUBLESHOOTING CHECKED GEAR/HOOK, AOA INDICATOR AND AOA HEATER CI R
seals worn, cockpit control stick cracked beyond limits and cable from cockpit control stick to actuator frayed. The additional failure modes in the study were utility hydraulic pump shaft sheared, hydraulic reservoir seals are worn, hydraulic thermal-bypass valve fails closed, main landing gear seals worn, strut hydraulic service valve fails open and finally the nose landing gear strut assembly cracked. Procedure and Data Analysis
The primary goal of data analysis was to determine how the proportion of participants that selected a specific severity rating changed across failure modes (organized by trials). Additionally, failure mode selection was also organized by experience level to determine if an association could be established between experience level and severity selection. Binary Logistic Regression was applied to the data to identify any correlation between severity selection, trials and experience level.
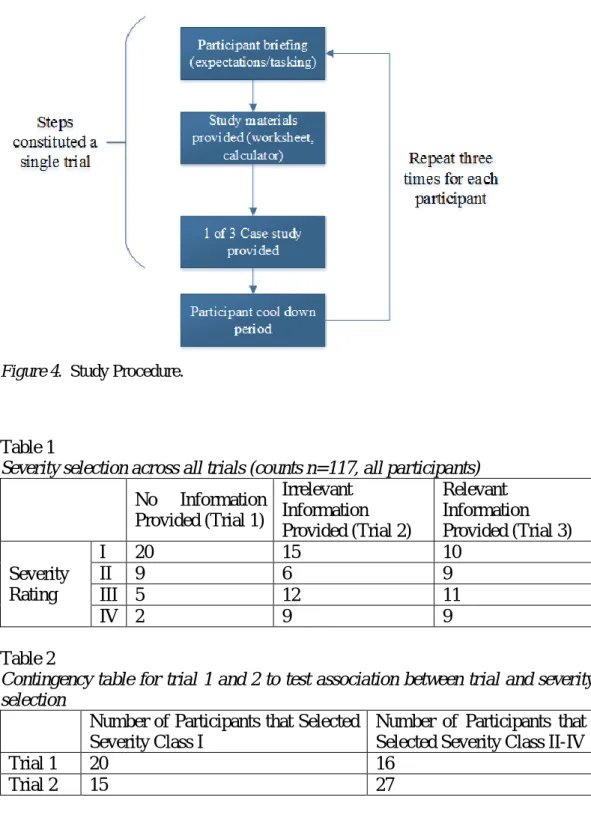
Each participant was required to complete nine failure modes across three trials. Trials were randomly assigned to each participant. Each participant did complete all trials. Although each participant completed trials in a random order, the systems and associated failure modes remained unchanged across all trials. The participants were tasked to select a severity rating ranging from I to IV for each failure mode, given a different amount of input information. Different input data sets were provided in each trial to ascertain if an association exists between severity class selection and the amount of input information regarding the system. The procedure is provided in Figure 4 for reference.
Next, the data was analyzed by comparing proportions between each trial by the group. For example, the proportion of participants that selected a severity classification for each failure mode during each trial was calculated by group (A and B) and compared. Data were compared with all failure modes combined (thus overall proportion of all participants by the group for a trial). Since the failure mode severity data were categorical with a discrete outcome, a Fisher’s exact test was utilized. Contingency tables utilized in this study are provided for reference (tables 1 to 5).
Figure 4. Study Procedure.
Table 1
Severity selection across all trials (counts n=117, all participants)
No Information Provided (Trial 1) Irrelevant Information Provided (Trial 2) Relevant Information Provided (Trial 3) Severity Rating I 20 15 10 II 9 6 9 III 5 12 11 IV 2 9 9 Table 2
Contingency table for trial 1 and 2 to test association between trial and severity selection
Number of Participants that Selected Severity Class I
Number of Participants that Selected Severity Class II-IV
Trial 1 20 16
Table 3
Contingency table for trial 1 and 3 to test association between trial and severity selection
Number of Participants that Selected Severity Class I
Number of Participants that Selected Severity Class II-IV
Trial 1 20 16
Trial 3 10 29
Table 4
Contingency table for trial 2 and 3 to test association between trial and severity selection
Number of Participants that Selected Severity Class I
Number of Participants that Selected Severity Class II-IV
Trial 2 15 27
Trial 3 10 29
Table 5
Contingency table for to test association between experience level and severity selection
Number of Participants that Selected Severity Class I
Number of Participants that Selected Severity Class II-IV
Experienced Users 12 15
Non-Experienced
Users 33 57
Results and Discussion
Binary logistic regression was performed to assess if any correlation could be identified when considering severity selection versus FMEA/FMECA experience level, general work experience as well as the three trials. To utilize Binary Logistic Regression, the response (severity selection) was mapped to a high and low level. Specifically, a severity selection of I or II was coded as HIGH, while selections of III and IV were coded as low. These groupings were based on the definition of the severity levels and were deemed logical. The model was deemed statistically significant (p = 0.013). Thus an association between the severity selection and the terms in the model was identified. Several Goodness-of-fit tests (Deviance, Hosmer-Lemeshow) were also conducted to test the adequacy of the model. The model passed all the tests conducted (Deviance p = 0.017, Hosmer-Lemeshow p = 0.998). Additionally, the categorical predictor for trial was significant (p = 0.003), thus it was concluded that the mean number of severity
category selections across the trials were not equal. Odd ratios for categorical predictors were also calculated. The odds ratio indicated how likely an event is to occur with the level selected. Based on the odd ratios it was concluded that participants were 4.53 times more likely to select a severity of I/II during trial one when compared to other trials.
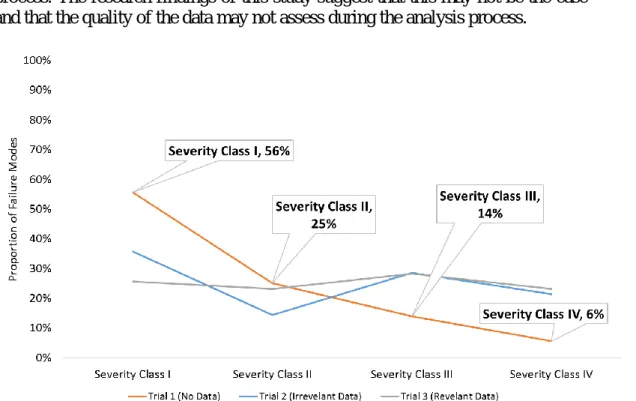
The first two hypotheses investigated in this study were related to both the amount of input information (included/not included) and the type (mishap data, failure data) available to the participants. It was hypothesized that inter-rater reliability within the FMEA/FMECA process will decrease based on the amount of input information (failure and mishap data) provided within the analysis. Thus, if more information were provided there would be less consensus amongst participants regarding severity rating selection. It was also hypothesized that the type of information influences inter-rater reliability in varying degrees, and that experienced users are less affected by the availability of superfluous information. Inter-rater reliability was investigated by first analyzing severity rating selections across the trials regardless of experience level. This study considered a severity class I the most severe (death, asset loss) and a class IV the least severe (nuisance). As illustrated in Figure 5, trial one had the most consensus (56 percent of failure modes classified as severity class I), with the consensus apparently decreasing in trials two and three. In trial two most failure modes were still classified as severity class I (36 percent). However, in trial three there appeared to be the least amount of consensus, with failure modes being evenly divided across all severity classifications. Thus, not only did it appear that inter-rater reliability does decrease as the amount of information is increased, but that the type of information may influence selection in varying degrees.
Each case study was compared to the other case studies to determine if there was any statistically significant association between the case study and how many participants selected a severity class of I or severity class of II-IV, regardless of experience level.
The null hypothesis was that there is there is no significant difference between the proportion of participants that selected severity class I or II through IV in case study 1 when compared trials two and three respectively. Utilizing a two-tailed Fisher’s Exact yielded the following results:
• trials one versus two were not statistically significant (p = 0.1102),
• trials one versus three were statistically significant at a significance level of 0.05 (p = 0102), and
Figure 5. Severity Selection across all trials (percentages, all participants).
Thus, there appeared to be no statistically significant difference between severity class selection when no information (trial one) versus irrelevant information (trial two) is provided. However, there did appear to a statistically significant difference between the severity class selection when no information (trial one) versus relevant information (trial three) is provided. There was no statistically significant association when trials two and three were compared. The inter-rater reliability was further analyzed by grouping the participant selections in different configurations to ascertain whether participant demographics impacted the results previously presented. The data were grouped in the following ways:
• participants with ≥ ten years of work experience, • participants with ≥ ten years of FMEA experience, and • participants with < 10 years FMEA and work experience.
Grouping the data in this manner yielded similar results, with an apparent repeating trend that additional information (trials two and three) and the variability
of severity class selections were associated. Specifically, regardless of how the data was grouped, 50 percent or more participants selected the same severity class in trial one (no information provided). This was contrasted to trials two and three, where it was not typical for more than 50 percent of participants to select the same severity class. The only exception was trial two for participants with ≥ ten years of FMEA experience.
The apparent trend between decreasing consensus and the amount of available information could have several reasons. Firstly, it was well known in the cognitive psychology field that too much information can overwhelm our available processing when complex tasks are performed. The nature and mechanisms of information overload and cognitive biases have been explored by several authors and likely related to limited biological hardware, noise within our memory channels as well as natural selection biasing our development to utilize heuristics (Hilbert, 2012; Johnson, Blumstein, Fowler, & Haselton, 2013; Tversky & Kahneman, 1974). This may result in information cues being missed by some participants resulting in less consensus. It is also important to consider how the information is organized and presented. In this study, the information was presented in a raw format to the analysis – since this is likely how they will perform the analysis in a real-world setting. However, participants were not restricted and could have organized the data into other formats if they desired. Interestingly it did not appear that any of the participants reorganized the data. Future work should investigate the role of how information is presented and organized within the FMEA/FMECA process.
Cognitive biases such as anchoring or confirmation biases likely also play a role in the risk assessment process (Tversky & Kahneman, 1974). For example, decision makers may bias their severity rating around a certain risk level (for example severity rating of I). An additional bias that may also play a role in risk analysis is the confirmation bias, where information is interpreted in such a way that validates the analyst’s priori. These biases were investigated by grouping the proportion of failure modes assigned to each severity level by trial. It is important to remember that each participant completed trials in a random order. For example, the first participant may have performed the trials in the order 1-2-3, while another participant may have performed them in order 2-3-1 and so forth. As illustrated in Figure 6, the proportion of failure modes assigned a severity of I in trial one appeared higher, when compared to trials two and three. However, when trials two and three were compared a similar proportion of failure modes was assigned to each severity class. Siefer and Smith analyzed a large data set captured as part of a risk management process over several years to identify if theoretical implications from prospect theory (which includes cognitive biases) were present (Siefert & Smith,
2011). The data set include consequence and likelihood of risks, and how they evolved as the program matured. Siefer and Smith confirmed the presence of cognitive biases and further indicated that subjective estimates (probability and consequence) could be objective if historical data is utilized within the analysis process. The research findings of this study suggest that this may not be the case and that the quality of the data may not assess during the analysis process.
Figure 6. Severity classification by trial (regardless of experience level).
There appeared to be a clear distinction between trial one when compared to trials two and three (supported by the statistical analysis presented earlier). In trial one where no data was provided participants clearly aired on the side of caution and thus attributing a larger portion of failure modes as high risk. However, interestingly this pattern did not hold in trials two and three where the proportions were approximately evenly distributed across all severity levels. In these trials, each severity category was assigned approximately 25 percent of the failure modes. Similar effects were observed by researchers such as (Fox & Clemen, 2005) who investigated an ignorance prior. The ignorance prior is a cognitive phenomenon where the assessor assigns probabilities based on the number of categories available. They concluded and illustrated through five studies that it appears the number of available categories sets the initial probability assessment. For example, in the case of severity classification, a failure mode can fit into four categories. Thus, an ignorance prior could be computed as 1/4 or 25 percent.
In this study, it appeared that participants were not able to sift through the provided information and identify the appropriate cues relating to failure relevance to the failure mode under analysis. Thus, it appeared that larger amounts of information might generally reduce conservatism. However, this is concerning since even information not related to the failure mode will influence the decision maker in a similar manner. The researchers further hypothesized that more experienced users would more effectively vet through irrelevant information and be less distracted by it – thus expecting to see higher consistency among experienced users.
The null hypothesis was that there is there is no significant difference between the proportion of participants that selected severity class I or II through IV based on user experience. Based on a two-tailed Fisher’s Exact test there wasn’t a statistically significant association between the experience level and the number of severity class selection (p = 0.5038).
Thus, the null hypothesis was not rejected, and it was concluded that experience level did not play a role in severity class selection within this study. This result should be further investigated due to the small number of experienced users that participated in this study (n = 4). This result may also be explained by considering the background of most participants. Almost 70 percent of participants came from an aviation background, thus equipped with a large amount of aerospace domain knowledge. The failure modes in this study were all aerospace-related.
Conclusions, Recommendations and Future Work
This study highlighted through empirical evidence that risk assessment participants are subjective during severity rating selection. Notably, it appears that users who are provided with irrelevant failure and mishap data will tend to select similar severity levels; however, when no information is provided to users, the data collected demonstrates with statistical significance that user selections will be dramatically more conservative. Additionally, participants appear to select similar severity ratings regardless of the relevancy of the provided data.
Several recommendations are provided based on the study results. First, a greater emphasis must be placed on the overall data quality at the onset of any RCM (or FMEA/FMECA) analysis. Specifically, the relevance, fidelity, and accuracy of the data must be established. Additionally, it is recommended that the analysis team consider the severity rating independent of the input data (at least initially). This will allow the team to consider the possible chain of events leading to a high-risk
event without being potentially biased by input information. There may also be value in assuming a high severity rating for each potential failure mode, followed by the justification of reducing the rating. This will incorporate additional rigor with the selection process and may reduce subjectivity. The team may also wish to consider plotting different team member ratings on the Hazard Risk Matrix, along with the consensus rating. This may allow additional important discussion and refinement. Finally, although domain and process experience is important, experts should always be questioned.
These findings are significant since they speak to the underlying validity of this very commonly used risk management tool. They further illustrate that significant focus must be placed on assessment of data quality since analysts appear not to be able to distinguish data quality cues during severity selection. Additionally, future work must be focused on understanding the impact of how information is presented to the analyst during FMEA and extend these results to a larger and more diverse participant base.
References
Aguiar, D. C., de Souza, H. J., & Salomon, V. A. (2010). An AHP Application to Evaluate Scoring Criteria for Failure Mode and Effect Analysis (FMEA).
International Journal of the Analytic Hierarchy Process, 2(1).
Apkon, M., Probst, L., Leonard, J., DeLizio, L., & Vitale, R. (2004). Design of a safer approach to intravenous drug infusions: failure mode effects
analysis. Quality and Safety in Healthcare, 13(4), 265-271.
Arabian-Hoseynabadi, H., Oraee, H., & Tavner, P. (2010). Failure Modes and effects analysis (FMEA) for wind turbines. International Journal of Electrical Power & Energy Systems, 32, 817-824.
Ashley, L., & Armitage, G. (2010). Failure mode and effects analysis: An empirical comparison. Journal of Patient Safety, 6(4), 210-215.
Banghart, M., Comstock, C., & Solomon, J. (2017). Comparison of military and commercial field data best practices for higher quality reliability and maintainability data. Presented at the Reliability and Maintainability Symposium, Orlando, Florida.
Battles, J. B., Dixon, N. M., Borotkanics, R. J., Robin-Fastmen, B., & Kaplan, H. S. (2006). Sense making of patient safety risks and hazards. Health Services Research Journal, 41(4), 1555-1575.
Bowles, J. (2003). An Assessment of RPN Prioritization in a failure modes effects and criticality analysis. Presented at the Reliability and Maintainability Symposium.
Bowling, A. (2002). Research methods in health-investigating health and health services. Buckingham, UK: Open University Press.
Bozdag, E., Asan, U., Soyer, A., & Serdarasan, S. (2015). Risk prioritization in Failure Mode and Effects Analysis using interval type-2 fuzzy sets. Expert Systems with Applications, 42, 4000-4015.
Carlson, C. (2012). Effective FMEAs. Hoboken, NJ: Wiley.
Carmignani, G. (2009). An integrated structural framework to cost-based FMECA: The priority-cost FMECA. Reliability Engineering and System Safety, 94, 861-871.
Carmines, E. G., & Zeller, R. A. (1979). Reliability and validity assessment. New York, NY: Sage.
Chang, C. L., Liu, P. H., & Wei, C. C. (2001). Failure mode and effects analysis using grey theory. Integrated Manufacturing Systems, 12, 211-216. Chang, C. L., Wei, C. C., & Lee, Y. H. (1999). Failure mode and effects analysis
using fuzzy method and grey theory. Kybernetes, 28, 1072-1080. Chang, K. H., & Cheng, C. H. (2010). A risk assessment methodology using
intuitionistic fuzzy set in FMEA. International Journal of Systems Science, 41, 1457-1471.
Chen, J. K. (2007). Utility priority number evaluation for FMEA. Journal of Failure Analysis and Prevention, 7, 321-328.
Claxton, K., & Campbell-Allen, N. M. (2017). Failure modes effects analysis (FMEA) for review of a diagnostic genetic laboratory process.
International Journal of Quality & Reliability Management, 34(2), 265-277.
Department of Defense. (2012). MIL-STD-882E. Washington, D.C.: Department of Defense.
Dong, C. (2007). Failure mode and effects analysis based on fuzzy utility cost estimation. International Journal of Quality & Reliability Management, 24(9), 958-971.
Forgas, J. P., Haselton, M. G., & Hippel, W. V. (2007). Evolution and the social mind: Evolutionary Psychology and Social Cognition. New York, NY: Psychology Press.
Fox, C. R., & Rottenstreich, Y. (2003). Partition priming in judgment under uncertainty. Psychological Science, 14(3), 195-200.
Fox, C., & Clemen, R. (2005). Subjective probability assessment in decision analysis: Partition dependence and bias toward the ignorance prior.
Management Science, 51(9), 1417-1432.
Franklin, B. D., Shebl, N. A., & Barber, N. (2012). Failure mode and effects analysis: too little for too much? BMJ Quality and Safety.
Gilmore, M. (2010). State of reliability: Memorandum for Principal Deputy Under Secretary of Defense (AT&L). Washington, D.C.: Department of Defense.
Gilmore, Michael. (2015, 09 19). Observations on the Marine Corps F-35
demonstration on USS Wasp. Washington, D.C.: Office of the Secretary of Defense.
Gryna, F. M., Chua, R. C., & DeFeo, J. A. (2007). Juran's quality planning and analysis. Columbus, OH: McGraw-Hill.
Hilbert, M. (2012). Toward a synthesis of cognitive biases: How noisy
information processing can bias human decision making. Psychological Bulletin, 138(2), 211-237.
Johnson, D., Blumstein, D., Fowler, J., & Haselton, M. (2013). The evolution of error: error management, cognitive constraints, and adaptive decision-making biases. Trends in Ecology & Evolution, 28(8), 474-481. Kirwan, B. (1996). ). The validation of three human reliability quantification
techniques-THERP, HEART and JHEDI: part 1-technique descriptions and validation issues. Applied Ergonomics, 27(6), 359-373.
Kmenta, S., & Ishii, K. (2000). Scenario-based FMEA: A life cycle cost
perspective. Baltimore, MD: American Society of Mechanical Engineers (ASME).
Konstandinidou, M., Nivolianitou, Z., Kiranoudis, C., & Markatos, N. (2006). A fuzzy modeling application of CREAM methodology for human reliability analysis. Reliability Engineering and System Safety, 91(6), 706-716. Lyons, M., Adams, S., Woloshynowych, M., & Vincent, C. (2004). Human
reliability analysis in healthcare: A review of techniques. International Journal of Risk & Safety in Medicine, 16, 223-237.
McLeish, J. G. (2010). Enhancing MIL-HDBK-217 reliability predictions with physics of failure methods. Presented at the Reliability and
Maintainability Symposium: San Jose, CA.
Moubrey, J. (1997). Reliability-centered Maintenance (2nd ed.). New York, NY: Industrial Press Incorporated.
NAVAIR. (2005). NAVAIR 00-25-403 Guidelines for the Naval Aviation
reliability-centered maintenance process. Patuxent River, MD: Naval Air Systems Command.
Panel on Reliability Growth Methods for Defense Systems. (2015). Reliability growth: Enhancing defense system reliability. Washington, D.C.: The National Academies Press.
Phipps, D., Meakin, G. H., Beatty, P. C., Nsoedo, C., & Parker, D. (2008). Human factors in anaesthetic practice: Insights from task analysis. British Journal of Anaesthesia, 100(3), 333-343.
Pohl, J. (2006). Elements of Human Decision-making. Presented at the 18th International Conference on Systems Research, Informatics and
Cybernetics: Baden-Baden, Germany.
Potts, H. W., Anderson, J. E., Colligan, L., Leach, P., Davis, S., & Berman, J. (2014). Assessing the validity of prospective hazard analysis methods: a comparison of two techniques. BMC Health Services Research, 14(41). Pulido, J. (2013). Effective implementation of an enterprise reliability program
with supplies. Presented at the Reliability and Maintainability Symposium. Rhee, S. J., & Ishii, K. (2003). Using cost based FMEA to enhance reliability and
serviceability. Advanced Engineering Informatics, 17, 179-188. Segismundo, A., & Miguel, P. A. (2008). Failure mode and effects analysis
(FMEA) in the context of risk management in new product development : A case study in an automotive company. International Journal of Quality & Reliability Management, 25(9), 899-912.
Shebl, N. A., Franklin, B. D., & Barber, N. (2009). Is failure mode and effect analysis reliable? Journal of Patient Safety, 5(2), 86-94.
Shebl, N. A., Franklin, B. D., & Barber, N. (2012). Failure mode and effects analysis outputs: are they valid? BMC Health Services Research, 12(150). Shebl, N. A., Franklin, B. D., Barber, N., Burnett, S., & Parand, A. (2011).
Failure Mode Effects Analysis (FMEA): The views of UK hospital staff.
BMC Health Services Research Journal, 17(1), 34-37.
Siefert, W. T., & Smith, E. D. (2011). Cognitive biases in engineering decision making. Aerospace Conference. Big Sky, MT: IEEE.
Siegel, S. (1956). Nonparametric statistics for the behavioral sciences. Tokyo, Japan: McGraw-Hill Kogakusha Ltd.
Smith, F. (2002). Research methods in pharmacy practice. London, UK: Pharmaceutical Press.
Smith, M., Higgs, J., & Ellis, E. (2008). Factors infuencing clinical decision making. Clinical reasoning in the health professions, 89-99.
Song, W., Ming, X., Wu, Z., & Zhu, B. (2014). A rough TOPSIS approach for failure mode and effects analysis in uncertain environments. Quality and Reliability Engineering International, 30, 473-486.
Tay, K. M., & Lim, C. P. (2006). Fuzzy FMEA with a guided rules reduction system for prioritization of failures. International Journal of Quality & Reliability Management, 23(8), 1047-1066.
Tversky, A., & Kahneman, D. (1974). Judgment under uncertainty: heuristics and biases. Science, 185, 1124-1131.
von Ahsen, A. (2008). Cost-oriented failure mode and effects analysis.
International Journal of Quality & Reliability Management, 25(5), 466-476.
Welborn, C. (2010). Applying failure mode and effects analysis to supplier selection. The IUP Journal of Supply Chain Management, 7, 7-14. Yang, J., Huang, H. Z., He, L. P., Zhu, S. P., & Wen, D. (2010). Risk evaluation
in failure mode and effects analysis of aircraft turbine rotor blades using Dempster-Shafer evidence theory under uncertainty. Engineering Failure Analysis, 18, 2084-2092.