Big data analytics capability in supply chain agility: The moderating effect
of organizational flexibility
Abstract
Purpose- The purpose of this paper is to examine when and how organizations build big data analytics capability to improve supply chain agility and gain competitive advantage.
Design/methodology/approach- We grounded our theoretical framework in two perspectives the dynamic capabilities view (DCV) and contingency theory (CT). To test our research hypotheses, we gathered 173 usable-responses using a pre-tested questionnaire.
Findings- Our results suggest that big data analytics capability has a positive and significant effect on supply chain agility and competitive advantage. Further, our results support our hypothesis that organizational flexibility has a positive and significant moderation effect on the path joining big data analytics capability and supply chain agility. However, contrary to our belief, we found no support for the moderation effect of organizational flexibility on the path joining big data analytics capability and competitive advantage.
Originality/value- The study makes some useful contributions to the literature on big data analytics capability, supply chain agility, organizational flexibility and competitive advantage. Moreover, our results may further motivate future scholars to replicate our findings using longitudinal data.
Keywords- Big data, analytics capability, big data analytics capability (BDAC), dynamic capabilities view (DCV), contingency theory (CT), organizational flexibility, PLS SEM, survey.
Paper type- Research paper 1. Introduction
The most successful organizations create supply chains that can respond to sudden and unexpected changes in the market (Lee, 2004). Supply chain management has gained popularity among organizations as a source of competitive advantage (Lee, 2002). Managing supply chains is extremely challenging task due to the current business outsourcing, globalization, short product life cycle, and continuous advancement in information technology (Lee, 2002; Christopher and Towill, 2002). Fisher (1997) attempted to match supply chain strategies (i.e., efficient vs responsive), to the product characteristics (i.e., functional vs
innovative products). Lee (2002) extended Fisher’s work by proposing four strategies (i.e., efficient/ responsive/ risk hedging/ agile), to accommodate different degrees of demand and supply uncertainty. Hence, according to the situation, the organization’s supply chain agility may directly affect its ability to produce and deliver innovative products to their customers at the right time, in the right place, in the right condition and at the right cost (Swafford et al. 2006; Khan and Pillania, 2008). Lee (2002) further argues that agile supply chains utilize strategies aimed at being responsive and flexible to customer’s needs, while the risks of supply shortages or disruptions are hedged by pooling inventory or other capacity resources. However, despite its immense popularity, supply chain agility is still less understood (Braunscheidel and Suresh, 2009). The emerging literature has often used flexibility and agility interchangeably (Braunscheidel and Suresh, 2009). Liu et al. (2013) argues that amidst high environmental uncertainties, organizations are increasingly relying on information technology (IT) capabilities to gain competitive advantage. Brusset (2016) further argues that supply chain managers are under extreme pressure to improve inventory turnover at minimal cost. Hence, in an effort to adapt the services and goods on offer to meet the customers’ changing tastes and behaviours, supply chain managers are under pressure to build agility in their supply chains to match the intense competition in markets (Gligor et al. 2016). However, an independent stream of research in recent years has led to the conceptualization of supply chain agility as a distinct and different construct from flexibility (Christopher, 2000; Gligor and Holcomb, 2012a, 2012b; Blome et al. 2013; Brusset, 2016; Dubey et al. 2018a). The literature focusing on supply chain agility and its impact on organizational performance is limited (Gligor et al. 2015) and has focused on the management practices needed to achieve the operational capabilities to enhance supply chain agility from different managerial viewpoints, such as operations, strategy, information systems, marketing, human resources (Brusset, 2016).
Choi et al. (2017) argue that big data has significant effects on operations management practices. Gunasekaran et al. (2017) further argue that supply chain disruptions have negative effects and agile supply chain enablers were progressively used with the aid of big data and business analytics to achieve better competitive results. Srinivasan and Swink (2017) further argue that although big data analytics has been in use to understand customer intentions/ behaviours, the use of analytics for supply chain operational decisions is less understood. Gunasekaran et al. (2017) argue that big data and predictive analytics have positive effects on supply chain performance and organizational performance. Sambamurthy et al. (2003) argue that organizations are increasingly investing in IT capabilities. While some researchers have
established the linkage between big data analytics capability and competitive advantage (Akter et al. 2016; Ji-fan Ren et al. 2017; Frisk and Bannister, 2017) and supply chain agility and competitive advantage (Blome et al. 2013; Gligor et al. 2015), little empirical testing of big data analytics and supply chain agility and competitive advantage exists (Sangari and Razmi, 2015; Gunasekaran et al. 2017). Hence, we address our first research question: What are the distinct and joint effects of big data analytics capability and supply chain agility on competitive advantage?
Boyd et al. (2012) argue that direct effects are crucial, but they seem incapable of explaining real world complexities. Hence, scholars have acknowledged that the performance effect of supply chain management practices hinges on the environmental context (Sousa and Voss, 2008). Eckstein et al. (2015) argue that such a view is often reflected in contingency theory (CT). The existing research focusing on IT capability and supply chain agility has, however, largely neglected the influence of these contextual factors. In this paper we use a CT perspective to examine under what conditions the big data analytics capability is effective.
Insights derived via big data analysis can provide opportunities for operational improvements (Fosso Wamba et al. 2015; Papadopoulos et al. 2017; Lamba and Singh, 2017; Srinivasan and Swink, 2017; Choi et al. 2017). However, organizations must also convert these valuable insights into actions. Galbraith (2014) argues that the final function to be accelerated by big data is the supply chain. Galbraith (2014, p.9) further describes how P& G utilizes “decision spheres” where cross-functional teams meet. In case of any emergency plant maintenance, the supply chain managers leverage analytics capability to re-route their trucks and still meet their customers’ demand. The role of organizational flexibility has been widely discussed in operations management literature - the ability of an organization to deploy resources quickly and efficiently - as a means to respond to the changing market conditions (Upton, 1994; Swafford et al. 2008; Srinivasan and Swink, 2017). Srinivasan and Swink (2017) argue that analytics capability can provide insights on what to change to match supply and demand; organizational flexibility enables the organization to determine how to make the appropriate changes. However, such crucial effects have not been addressed by prior research theoretically or subjected to empirical testing. Thus, we specify our second research question as follows: what are the effects of organizational flexibility on the relationships between big data analytics and supply chain agility/ competitive advantage?
We provide answers to our research questions, using data from 173 survey responses from experienced supply chain managers. To theoretically substantiate our empirical results, we have integrated the dynamic capabilities view (DCV) (Teece et al. 1997) and CT, because neither perspective can, on its own, explain the direct impacts of big data analytics capability on supply chain agility and competitive advantage and the contextual conditions under which they are effective.
The paper is organised as follows. In Section 2 of the paper, we present the underpinning theories. In Section 3, we illustrate our theoretical framework and outline our research hypotheses accordingly. In Section 4, we present our research design, including discussion of instrument development, sampling design and data collection. In Section 4, we present our statistical analyses and results. In Section 5, we provide discussion, including theoretical contribution and managerial implications. In Section 6, we conclude our study with limitations and further research directions.
2. Underpinning Theories
2.1 Dynamic capabilities view (DCV)
Following criticism of the resource based view (RBV), which often fails to provide explanation of how and in what context the resources can provide competitive advantage to a firm (Eisenhardt and Martin, 2000), scholars have argued that the dynamic capabilities view (DCV), provides explanation for the organization’s competitive advantage in changing environments (Teece et al. 1997; Sirmon et al. 2010; Eisenhardt and Martin, 2000; Singh et al. 2013). Teece et al. (1997, p. 516) defined dynamic capabilities as, “the firm’s ability to integrate, build and reconfigure internal and external competencies to address rapidly changing environments”. Teece et al. (1997) further argue that dynamic capabilities include the capabilities to sense and shape opportunities, to seize opportunities, and to maintain competitiveness through enhancing, combining, protecting and reconfiguring a firm’s resources. Within the context of a highly uncertain environment, dynamic capabilities are simple, experiential, unstable processes that rely on rapidly created new insights that enable combination, transformation, or renewal of resources and competencies into capabilities which are essential for uncertain markets (Eisenhardt and Martin, 2000; Eckstein et al. 2015). Based on these arguments scholars have considered big data analytics as a dynamic capability (Fosso Wamba et al. 2017) that results from the organization’s ability to reconfigure firm-level resources.
There is increasing debate about the importance of big data analytics in supporting the strategic goals of an organization (Davenport, 2006; Manyika et al. 2011; Prescott, 2014; Mishra et al. 2016, 2017; Roden et al. 2017; Ji-fan Ren et al. 2017; Choi et al. 2017; Fosso Wamba, 2017; Jabbour et al. 2017), but there is as yet no consensus about how best to organize big data analytics efforts within the organization and what core analytics processes the organization should support (Galbraith, 2014). Following Manyika et al. (2011), we argue that big data is data whose volume, velocity and variety make it difficult for an organization to manage, analyze and extract valuable insights using conventional and traditional methods. The term analytics refers to “the process that extracts valuable insights from data via creating and distributing reports, building and deploying statistical and data-mining models, exploring and visualizing data, sense-making and other related techniques” (Grossman and Siegel, 2014, p.20). Hence, we can argue that big data analytics capability is an organizational facility with tools, techniques, and processes that enable the organization to process, visualize, and analyze data, thereby producing insights that enable data-driven operational planning, decision-making and execution (Srinivasan and Swink, 2017). In the context of supply chain management, big data analytics capability enables to firms to examine alternatives related to supply and demand uncertainties (Waller and Fawcett, 2013; Hazen et al. 2014; Wang et al. 2016).
2.3 Supply chain agility (SCA)
Lee (2004) argues that organizations are increasingly investing in building agility in supply chains to respond to sudden and unexpected changes in the market. Swafford et al. (2006) argue that supply chain agility affects the ability of an organization to produce and deliver innovative products to their customers in a timely and cost effective manner. Braunscheidel and Suresh (2009) noted that with intense competitive pressures as well as high levels of turbulence and uncertainty, organizations require agility in their supply chains. The agility in supply chains provides superior value as well as overcoming disruption risks and ensuring uninterrupted service to customers (Braunscheidel and Suresh, 2009; Blome et al. 2013; Gligor et al. 2016; Brusset, 2016). Christopher (2000) has noted that number of characteristics that a supply chain must possess to be agile are:
Market sensitive - it closely monitor the changes in demand pattern. Virtual - information sharing among partners in supply chain is critical. Network-based - helps to build flexibility in supply chain network.
Process integration - it has a high degree of process interconnectivity between the network members.
Hence, these characteristics helps the organizations to meet customer demand by providing the right product at the right time, place and price. Some notable examples include Dell, Wall-Mart and Amazon (Lee, 2004). Swafford et al. (2006) found that organizations’ supply chain agility is directly and positively impacted by flexibility in manufacturing and procurement/ sourcing processes. Braunscheidel and Suresh (2009) observed, based on empirical results, that besides flexibility, internal cross-functional integration and external integration with key customers and suppliers are crucial for enhancing agility in supply chains. Eckstein et al. (2015) view supply chain agility as a dynamic capability that not only helps to meet customers’ demand but also helps to enhance the firm’s profitability. Dubey et al. (2018a) further noted that supply chain visibility enhances supply chain agility via bundling organizational resources (i.e. data connectivity and information sharing). Hence, we can argue that agility is a desired property of a supply chain that enables it to respond to short-term changes in demand and supply quickly and handle external disruptions smoothly.
2.4 Organizational flexibility (OF)
Volberda (1996, p. 361) defines organizational flexibility, as “the degree to which an organization has a variety of managerial capabilities and the speed at which they can be activated, to increase the control capacity of the management and improve the controllability of the organization”. Hence, we argue that organizational flexibility is the organizational ability that enables organizations to operate in a turbulent environment (Braunscheidel and Suresh, 2009; Sharma et al. 2010; Srinivasan and Swink, 2017). Sanchez (1993) argues that in dynamic environments, an organization can gain competitive advantage by creating strategic flexibility. Sanchez (1995) further argues that flexibility is constrained not only by resources but also by the ways a firm uses the resources (see also Upton, 1994; Suarez et al. 1996; Sanchez, 1997; Sanchez and Mahoney, 1997; Liu et al. 2009).
2.5 Competitive advantage
Porter (1985) argues that firms can gain competitive advantage by identifying and implementing generic strategies and addresses the interplay between types of competitive advantage - cost and differentiation - and the scope of the firm’s activities. Barney (1991, p.102) defined competitive advantage, “ a firm is said to have competitive advantage when it is implementing value creating strategy not simultaneously being implemented by any current or potential competitors”. Peteraf (1993) argues that competitive advantage is the ability of an organization to maintain or sustain above-normal returns. However, Peteraf (1993) further
argues that there are four cornerstones of competitive advantage: heterogeneity, ex post limits to competition, imperfect mobility and ex ante limits to competition. Barney (1991) argues that an organization can derive competitive advantage by creating bundles of strategic resources and / or capabilities. Reed and DeFillippi (1990) argue that competitive advantage can be derived from numerous sources. For instance, competencies are within the organization’s control and can be exploited to generate competitive advantage for superior performance (Hinterhuber, 2013).
3. Theoretical Framework and Hypotheses Development
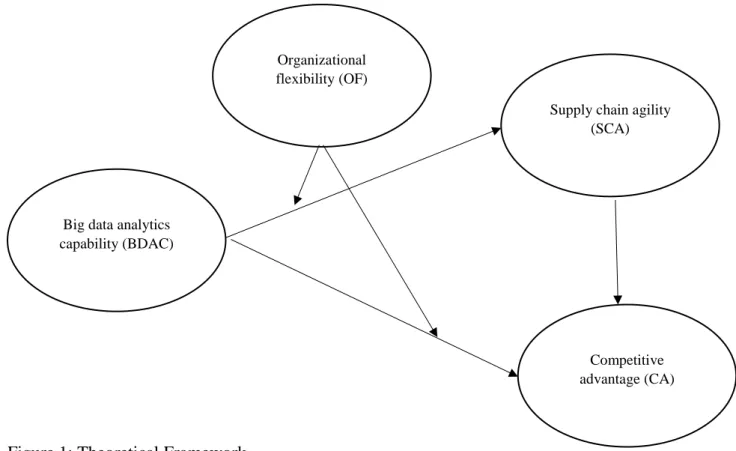
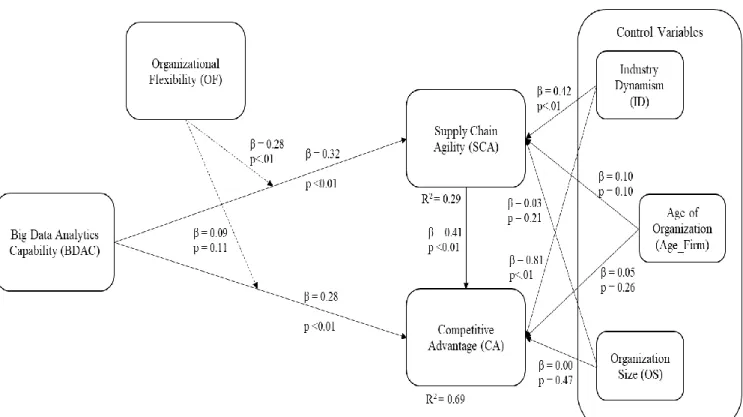
The foundation of our theoretical model (see Figure 1) comprises two pillars: DCV and contingency theory. Due to rapidly changing environments, the DCV has gained immense popularity among management scholars who seek to investigate how the bundling of firm resources and competencies can provide competitive advantage to a firm operating in a highly uncertain environment. Consistent with the previous arguments, information processing capability is seen a solution for uncertainty. The need for big data analytics capability is further heightened by volatile and complex task environments, where high levels of uncertainty make effective planning and decision making difficult. Using the logic of fit, scholars have argued that organizational flexibilities of several types are more valuable in highly uncertain environments (Swamidass and Newell, 1987; Pagell and Krause, 1999). Hence, we first draw direct links from BDAC to connect SCA and CA. Secondly, in order to examine the interaction effects of organizational flexibility (OF) on the direct effects of BDAC on SCA and CA we draw links on the paths joining BDAC to SCA and CA. To further examine the direct effect of SCA on CA, we draw a link joining SCA and CA and propose four research hypotheses grounded in DCV and CT. These hypotheses do not exclude the possibility that other factors may influence the effect of BDAC on SCA/CA; we have controlled for these factors during our model testing and in our subsequent discussion.
3.1 Big data analytics capability and supply chain agility
Swafford et al. (2008) found that IT capability has positive effect on supply chain agility. Srinivasan and Swink (2017) noted that supply chain visibility is a prerequisite for building data analytics capability and vice versa. Supply chain visibility and big data analytics capabilities are complementary, in the sense that each supports the other (Gunasekaran et al. 2017). Supply chain visibility is a desired organizational capability to mitigate risk resulting from supply chain disruptions (Jüttner and Maklan, 2011). Following Srinivasan and Swink’s
(2017) arguments that organizations investing in building supply chain visibility capability are likely to invest in big data analytics capability, Dubey et al. (2018a) found a positive impact of supply chain visibility on supply chain agility. Hence, we may argue that the use of data technology may help managers to sense the rapid changes in environments, so they can develop business continuity plans that may help to quickly respond to the changes. Thus,
H1: Big data analytics has a positive impact on supply chain agility.
3.2 Big data analytics capability and competitive advantage
Competitive advantage refers to any advantage that a firm has over their competitors (Porter, 1985). Chen et al. (2012) argue that big data presents an immense opportunity to achieve competitive advantage. LaValle et al. (2011) noted that top-performing organizations use analytics five times more than low performers. Raffoni et al. (2018) argue that big data analytics, if used cautiously, can help the organization to achieve better performance. Akter et al. (2016) argue that big data analytics capability has a positive impact on organizational performance. Kache and Seuring (2017) argue that the use of big data analytics is still in its infancy stage, but despite challenges big data analytics appears to offer immense opportunities. Sheng et al. (2017) argue that organizations are increasingly exploiting big data to improve organizational competitiveness. Gunasekaran et al. (2017) noted that the big data & predictive analytics capability has positive impact on supply chain and organizational performance. Hence, we hypothesize:
H2: Data analytics has positive impact on organization’s competitive advantage
3.3 Supply chain agility and competitive advantage
The great companies create agile supply chains to respond to sudden and unexpected changes in markets. Brusset (2016) argues that supply chain agility is desirable as in most industries, both demand and supply fluctuate rapidly. Lee (2004) argues that organizations like H&M, Mano and Zara use supply chain agility to differentiate themselves from their competitors. Whitten et al. (2012) have tested empirically, using a survey of 132 respondents, that supply chain agility along with other capabilities (i.e. supply chain adaptability and supply chain alignment), has a positive impact on supply chain performance and supply chain performance further positively affects organizational performance. Gligor et al. (2015) tested using a survey of 283 that supply chain agility has a positive impact on financial performance under the mediating effects of customer effectiveness and cost efficiency. Thus we test:
H3: Supply chain agility has a positive impact on competitive advantage
3.4 Moderating effects of organizational flexibility
The big data analytics capability provides useful insights based on processing of the data gathered from multiple sources (Srinivasan and Swink, 2017; Choi et al. 2017). Galbraith (1973, 1974) noted that organizations need flexibility to implement decisions quickly and efficiently, especially decisions that span various functions. Organizational flexibility has been noted as one of the key levers to reduce supply chain risk (Braunscheidel and Suresh, 2009). Hence, we posit that organizations can more effectively take advantage of new insights gained from big data analytics capability when they possess high levels of organizational flexibility. Organizations with better organizational flexibility are more capable of coping with demand and supply uncertainties (Swafford et al. 2006) and gain competitive advantage (Yusuf et al. 2004, 2014). Consequently, those organizations have better capabilities to improve supply chain agility than those organizations who rely on decisions based on limited data sets or mechanistic models of processing data. Thus,
H4a/b: Organizational flexibility positively moderates the relationship between big
Figure 1: Theoretical Framework
4. Research Design
4.1 Sample and Data Collection
We analysed data collected in 2015 through a survey of ACMA (Automotive Components Manufacturers Association of India), to test our theoretical model. ACMA and McKinsey administered this cross-sectional survey. The unit of analysis is the organization and the survey was developed for a single respondent. Our research team sent e-mail invitations to 745 supply chain managers drawn from the ACMA database. The sampling frame included senior supply chain managers from auto components manufacturing organizations located in various parts of India. For this study, senior supply chain managers in logistics, production, procurement and information systems functions were targeted, as they are likely to have relevant information related to materials and information flow as well as supply chain innovation initiatives. With regard to the four supply chain types (Lee 2002) it should be noted that all the respondents were in the auto components industry and could expect to be broadly comparable.
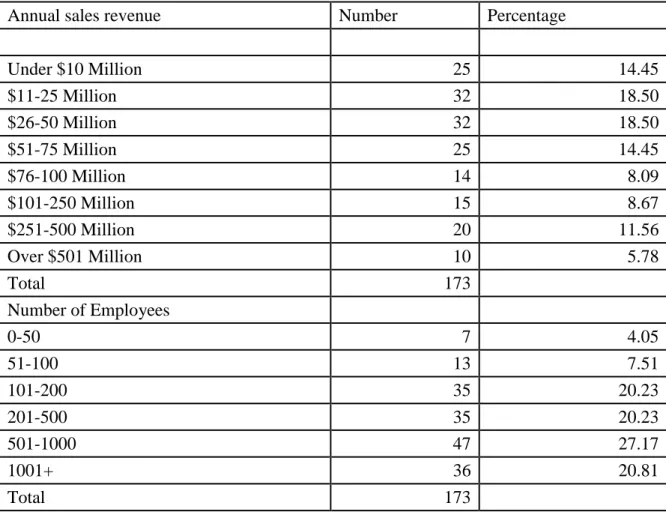
Overall, we received 173 complete and usable responses, representing an effective response rate of 23.22% (see Table 1). In this study, we eliminated those respondents whose titles were not directly related to supply chain functions and had less experience. The resulting sample held senior managerial positions such as Vice President, General Manager, CXO (C-Suite
Big data analytics capability (BDAC)
Competitive advantage (CA) Supply chain agility
(SCA) Organizational
Managers), Director, Head, Senior Manager and Manager with more than 15 years of experience. We also included responses from Analysts and Planners. We provide the profile of the responding organizations in Table 1 and the profile of the respondents in Appendix 1.
Table 1: Profile of the responding organizations
Annual sales revenue Number Percentage
Under $10 Million 25 14.45 $11-25 Million 32 18.50 $26-50 Million 32 18.50 $51-75 Million 25 14.45 $76-100 Million 14 8.09 $101-250 Million 15 8.67 $251-500 Million 20 11.56 Over $501 Million 10 5.78 Total 173 Number of Employees 0-50 7 4.05 51-100 13 7.51 101-200 35 20.23 201-500 35 20.23 501-1000 47 27.17 1001+ 36 20.81 Total 173
In survey-based research, there is always a potential for biases. As we used a survey-based approach to gather data, we tested for non-response bias through comparison of early responses and late responses, following Armstrong and Overton’s (1977) suggestions. The t-tests yielded no statistically significant differences between early and late responses, indicating that non-response bias is not a problem in our study.
4.2 Measures
Following Malhotra and Grover’s (1998) suggestions, we used established scales from literature in our study. This was feasible for measures of data analytics, organizational flexibility, supply chain agility and competitive advantage. We made minor modifications in the wording of our questionnaire based on pre-tests to improve the performance of the
questionnaire. All the scales were designed in five-point Likert format with anchors 1= strongly disagree and 5= strongly agree.
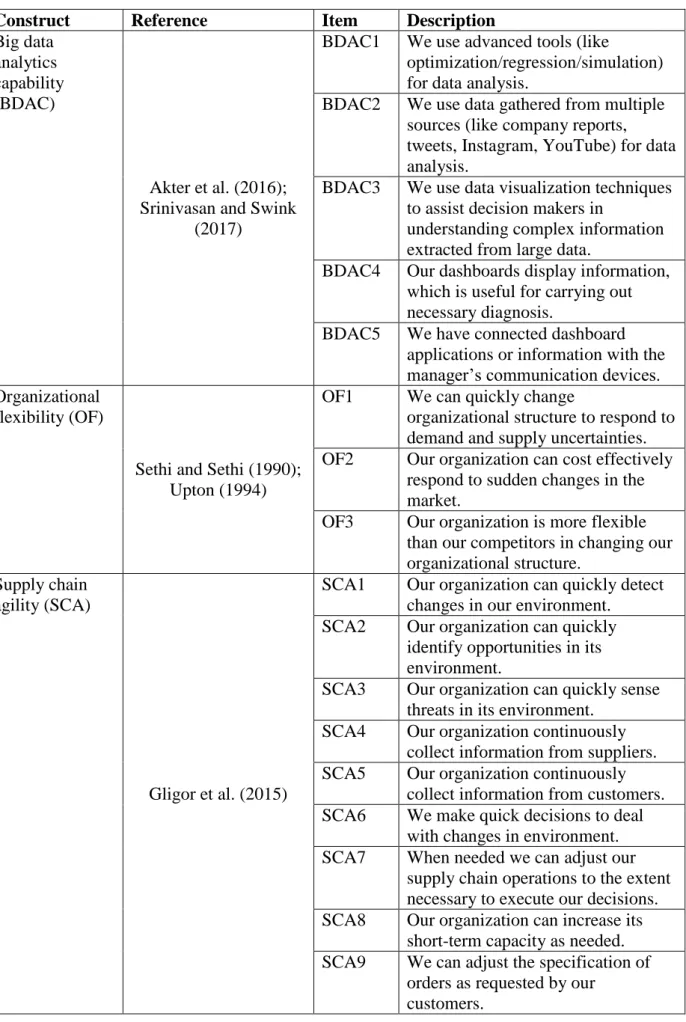
In addition, we identified three control variables, which may influence the exogenous and endogenous variables and may cause unwanted sources of variance. Firstly firm size, following Cao and Zhang’s (2011) arguments that smaller firms have fewer resources for the implementation of supply chain management practices, and Wagner and Neshat (2012) who noted that larger organizations are more vulnerable to supply chain disruptions. The number of employees (logarithmic) measured the size of the firm (Gligor et al. 2015). Secondly, we included industry dynamism in order to level out the effects of uncertainty across industry segments. Aldrich (1979) argues that dynamism reflects the unpredictability and volatility, of the changes in the industry that heightens the uncertainty of the organizations’ predictions. We measured industry dynamism on a five-point Likert format anchored as, 1= slow and 5= rapid, with items reflecting the industry rates of change for product/ service introduction, operating processes, customer tastes/ preferences, and research and development (Brandon-Jones et al. 2014). Thirdly, we controlled for the age of the organization. Gligor et al. (2015) argue that the age of the organization can influence the implementation of supply chain practice and therefore, impact upon competitive advantage. The firm age is calculated as the number of years since the firm foundation (logarithmic) (see, Srinivasan and Swink, 2017). Table 2 shows the summary of the items used for measures.
Table 2: Measures
Construct Reference Item Description
Big data analytics capability (BDAC)
Akter et al. (2016); Srinivasan and Swink
(2017)
BDAC1 We use advanced tools (like
optimization/regression/simulation) for data analysis.
BDAC2 We use data gathered from multiple sources (like company reports, tweets, Instagram, YouTube) for data analysis.
BDAC3 We use data visualization techniques to assist decision makers in
understanding complex information extracted from large data.
BDAC4 Our dashboards display information, which is useful for carrying out necessary diagnosis.
BDAC5 We have connected dashboard applications or information with the manager’s communication devices. Organizational
flexibility (OF)
Sethi and Sethi (1990); Upton (1994)
OF1 We can quickly change
organizational structure to respond to demand and supply uncertainties. OF2 Our organization can cost effectively
respond to sudden changes in the market.
OF3 Our organization is more flexible than our competitors in changing our organizational structure.
Supply chain agility (SCA)
Gligor et al. (2015)
SCA1 Our organization can quickly detect changes in our environment.
SCA2 Our organization can quickly identify opportunities in its environment.
SCA3 Our organization can quickly sense threats in its environment.
SCA4 Our organization continuously collect information from suppliers. SCA5 Our organization continuously
collect information from customers. SCA6 We make quick decisions to deal
with changes in environment. SCA7 When needed we can adjust our
supply chain operations to the extent necessary to execute our decisions. SCA8 Our organization can increase its
short-term capacity as needed. SCA9 We can adjust the specification of
orders as requested by our customers.
Competitive advantage (CA)
Tracey et al. (1999); Vorhies and Morgan
(2005)
CA1 Our customers are satisfied with our product quality.
CA2 We deliver value to our customer. CA3 We deliver at the right time what our
customers want.
CA4 Our market share growth is significant in comparison to our customers.
CA5 We are able to acquire new customers.
CA6 We have reached our financial goals. Industry
dynamism (ID)
Brandon-Jones et al. (2014)
ID1 Our product and services become outdated.
ID2 Our organization continuously introduces new products and services.
ID3 Our organization introduces new operating processes.
ID4 The customers taste and preferences in our industry changes fast.
Age of the organization (OA)
Gligor et al. (2015)
OA
Logarithmic value of number of years
Organization
size (OS) Gligor et al. (2015)
OS Logarithmic value of number of employees
5. Data Analyses and Results
We used WarpPLS 5.0 software to test our model. The software employs the partial least squares (PLS) structural equation modelling method or in short form PLS SEM (Kock, 2014, 2015). PLS is a prediction-oriented tool which allows researchers to assess the predictive validity of the exogenous variables (Peng and Lai, 2012). Scholars argues that PLS is better suited for explaining complex relationships as it avoids two serious problems: inadmissible solutions and factor indeterminacy (see, Peng and Lai, 2012; Henseler et al. 2014; Moshtari, 2016; Pratono, 2016; Akter et al. 2017; Martí-Ballester and Simon, 2017; Dubey et al. 2018b). In our study, we aim to examine the prediction or explanatory power of big data analytics capability (BDAC). The relationships between two variables – big data analytics capability and supply chain agility - are not examined in literature. With no theoretical foundation that explains the relationships between these two variables, PLS becomes the most suitable technique for data analysis (Peng and Lai, 2012). We carried out our model estimation based on Peng and Lai’s (2012) suggestions in two stages: examining the reliability and validity of the measurement model and then analysing the structural model.
5.1 Measurement model
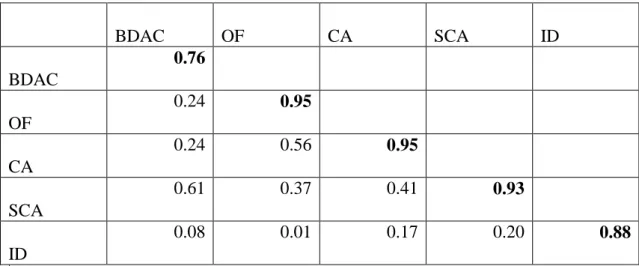
A series of procedures were used to determine convergent and discriminant validity for the constructs used in our model (see Figure 1). In support of convergent validity, we noted that factor loadings were significant except for a few items which we dropped from our study. Next, we found that the average variance extracted (AVE) of each construct was greater than 0.7. As shown in Appendix 2, the loadings are in an acceptable range and they are significant at the 0.01 level (Fornell and Larcker, 1981). The discriminant validity was assessed via AVE comparisons (see Table 3). The square roots of the AVEs were greater than all of the inter-construct correlations; it is a strong evidence of sufficient discriminant validity.
Table 3: Correlations among major constructs BDAC OF CA SCA ID BDAC 0.76 OF 0.24 0.95 CA 0.24 0.56 0.95 SCA 0.61 0.37 0.41 0.93 ID 0.08 0.01 0.17 0.20 0.88
√ (AVE) are in bold
Notes: BDAC, big data analytics capability; OF, organizational flexibility; SCA, supply chain agility; CA, competitive advantage; ID, industry dynamism
5.2 Common method bias
Ketokivi and Schroeder (2004) argue that data gathered using a survey-based instrument from a single source has potential biases. Podsakoff et al. (2003) argue that in the case of self-reported data, there is potential for common method biases (CMB) resulting from multiple sources such as consistency motif and social desirability. Hence, we designed our survey to minimize the CMB effect using different scale formats and anchors for independent, moderating, and dependent variables. In addition, we performed several statistical analyses to assess the extent of CMB. First, following Podsakoff and Organ (1986) we performed a conservative version of Harman’s one-factor test. The results from this test showed that the single factor explains 43.69 percent (approx.), of total variance, demonstrating that CMB is not a significant concern. Second, we tested for CMB using the marker technique (Lindell and Whitney, 2001). We used an unrelated variable to partial out the correlations caused by CMB. We also calculated the significant value of the correlations based on Lindell and Whitney’s (2001) equations. We noted no significant differences between adjusted and unadjusted correlations. Based on these results we consider that the potential effects of common method variance are negligible.
Guide and Ketokivi (2015) noted that causality is an important issue that should be examined prior to hypothesis testing. Following Kock’s (2015) suggestions, we calculated the nonlinear bivariate causality direction ratio (NLBCDR). The NLBCDR refers to “an interesting property
of nonlinear algorithms … that bivariate nonlinear coefficients of association vary depending upon the hypothesized direction of the causality. That, is they tend to be stronger in one direction than the other, which means that the residual (or error) is greater when the hypothesized direction of causality is in one way or the other. Hence, the NLBCDR index is a measure of the extent to which bivariate nonlinear coefficients of association provide support for the hypothesized directions of the causal links in the model” (Kock, 2015, pp. 52-53). The desired acceptable value is greater than 0.7. In our model NLBCDR=0.818, which is greater than the cut off value. Hence, based on these results we can argue that endogeneity is not a serious concern in our study. We further tested the model fit and quality indices (see Appendix 3).
5.3 Hypothesis testing
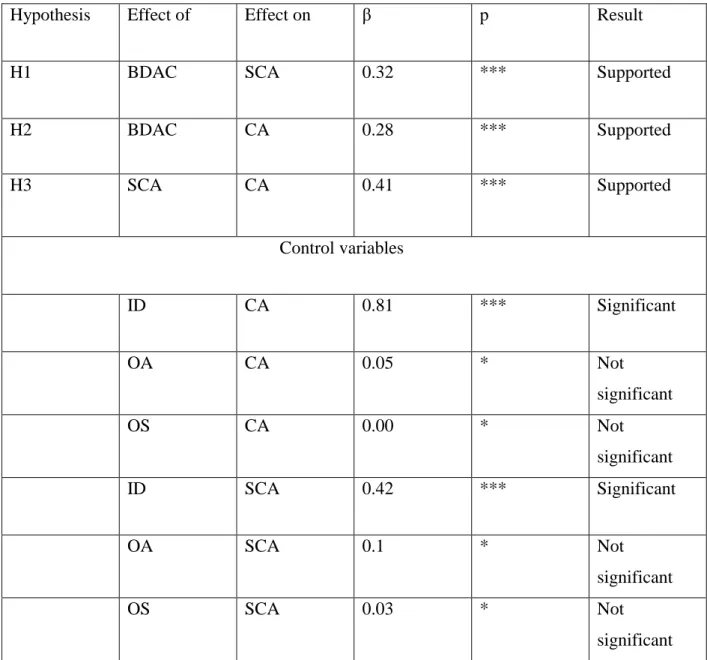
Figure 2 presents the estimates obtained via PLS SEM analysis. The model explains a significant amount of variance for supply chain agility (R²=0.29) and competitive advantage (R²=0.69). We have reported the PLS path coefficients and the corresponding p values for the model in Table 4 (H1-H3) and Table 5 (H4a/b). The links BDAC→SCA (β=0.32, p<0.01), BDAC→CA (β=0.28, p<0.01) and SCA→CA (β=0.41, p<0.01) are positively related. Thus, we can argue based on beta values and their corresponding p values that hypotheses H1, H2 and H3 were supported. The control variables organization age and organizational size do not have significant effect in this model (see Table 4). However, industry dynamism has a significant effect on SCA and CA.
Table 4: Structural Estimates (H1-H3)
Hypothesis Effect of Effect on β p Result
H1 BDAC SCA 0.32 *** Supported
H2 BDAC CA 0.28 *** Supported H3 SCA CA 0.41 *** Supported Control variables ID CA 0.81 *** Significant OA CA 0.05 * Not significant OS CA 0.00 * Not significant ID SCA 0.42 *** Significant OA SCA 0.1 * Not significant OS SCA 0.03 * Not significant Notes: BDAC, big data analytics capability; SCA, supply chain agility; CA, competitive advantage; ID, industry dynamism; OA, age of the organization; OS, organizational size. *** p<0.01; * p>0.1
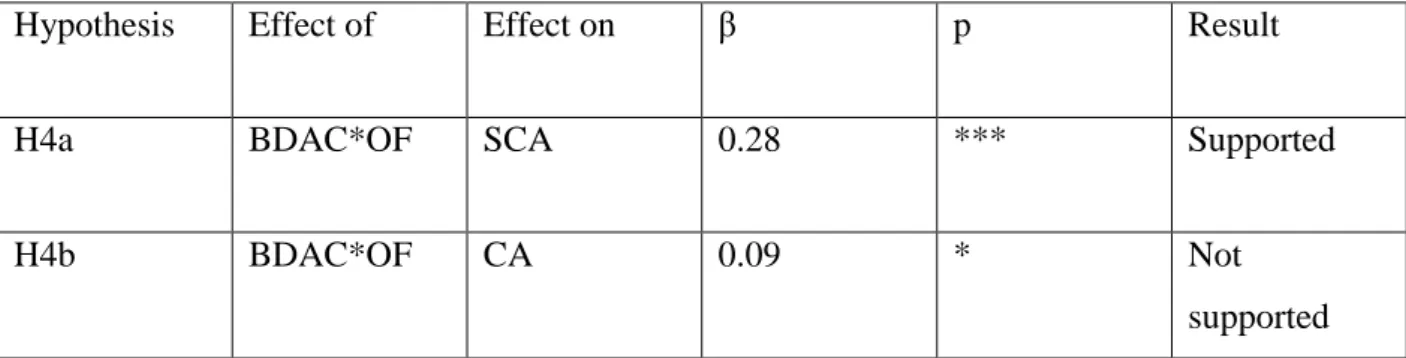
Next, our hypothesis H4 was tested for the moderation effect of organizational flexibility on the path connecting data analytics capability and supply chain resilience (H4a) and data analytics capability and competitive advantage (H4b). H4a (β=0.28, p<0.01) was found to be supported (see Table 4). However, H4b (β=0.09, p>0.1) was not supported.
Table 5: Structural Estimates (H4a/b)
Hypothesis Effect of Effect on β p Result
H4a BDAC*OF SCA 0.28 *** Supported
H4b BDAC*OF CA 0.09 * Not
supported Notes: BDAC, data analytics capability; SCA, supply chain agility; CA, competitive advantage; OF, organizational flexibility. *** p<0.01
Next, we examined the explanatory power of our proposed theoretical model. For this, we examined the explanatory power (R²) of the endogenous construct. The R² for SCA is 0.29 which is moderately strong and for CA is 0.69 which is strong (Chin, 1998) (see Figure 2). We further examined the f² value of the BDAC using Cohen’s f² formula. Consequently, the effect size of BDAC on SCA is 0.002 and on CA is 0.003 (see Table 6) which were greater than the cut off value of zero. Next, we examined the model’s capability to predict. Stone-Geiser’s Q² values for the endogenous constructs were SCA (0.3) and CA (0.66) (see Table 6) for BDAC which is greater than zero, indicating acceptable predictive relevance (Peng and Lai, 2012).
Table 6: R², Prediction and Effect Size Construct R² Q² f² in relation to SCA CA BDAC - - 0.002 0.003 OF - - SCA 0.29 0.30 CA 0.69 0.66
Figure 2: Causal model
6. Discussion
Our results provide a better understanding of the impact of big data analytics capability on supply chain agility and competitive advantage, answering the calls for research (Brusset, 2016; Gunasekaran et al. 2017; Dubey et al. 2018a). Our results contributes to building and refining theories of big data analytics capability, supply chain agility, organizational flexibility and competitive advantage and provides empirically grounded normative suggestions to management practitioners. The results provide improve our understanding about the relationship between big data analytics capability, supply chain agility and competitive advantage. Our study is the first to offer a rigorous empirical test of the distinct effects of big data analytics capability on supply chain agility and competitive advantage, which was called for in previous research (Gunasekaran et al. 2017). We found that age of the firm (OA) and organizational size (OS) have no significant effect on supply chain agility and competitive advantage. We interpret these observations as evidence the auto-components sector is increasingly using big data analytics to improve supply chain agility and gain competitive advantage in the face of rapid change, and the size and age of the firm play little role in the big
data analytics capability-supply chain agility-competitive advantage relationship. However, industry dynamism has positive effects on supply chain agility and competitive advantage. We interpret these observations to suggest that dynamic elements such as the rate with which new products or services are introduced, operating processes, customer tastes/preferences, and research and development may have a major role to play in the big data analytics-supply chain agility-competitive advantage relationship. While this may be contrary to our expectations, the role of industry dynamism may be further explored in the context of the big data analytics-supply chain agility-competitive advantage relationship.
Our hypotheses that under high organizational flexibility the relationship between big data analytics capability and supply chain agility/competitive advantage will be strengthened were partially supported. Specifically, our results support our belief that organizational flexibility positively moderates the link joining big data analytics capability and supply chain agility. However, our expectation that organizational flexibility would positively moderate the link from big data analytics capability to competitive advantage, this was not supported. These results may be due to the inclusion of organizational flexibility as a key contextual factor in our theoretical model. Hence, we suggest further research is needed to examine whether organizational flexibility has a role to play on the impact of big data analytics capability and competitive advantage.
7. Conclusions
7.1 Implications for theory
Brusset (2016) found empirically that visibility may not have a significant effect on supply chain agility. Contrary to Brusset’s (2016) findings, Dubey et al. (2018a) observed that supply chain visibility has a positive and significant effect on supply chain agility. Srinivasan and Swink (2017) argue that visibility is created via external relations, which may help decision makers to sense changes in customer and competitors markets, including demands, pricing and promotional actions, and product inventories. Hence, the organizations that develop demand and supply visibility are also better positioned to develop and deploy systems and processes supporting analytics capability. Building upon this tautology, we posited that organizations that seek to enhance supply chain visibility would invest in building big data analytics capability, which will help them handle large data derived from various sources to extract useful insights. Building on Srinivasan and Swink’s (2017) arguments, we tested the direct impact of big data analytics capability on supply chain agility. Our study is the first to provide an empirical test
of the distinct effects of big data analytics capability on supply chain agility and competitive advantage. The information derived via BDAC provides firms with real-time information regarding changes in future product demand due to changes in downstream inventories, promotions, and sales. Moreover, supplier-sourced data provide information regarding supply shortages and excess inventories resulting from changes in upstream inventories, capacities, and the status of orders and shipments. We have thus answered the research calls of prior literature (see Gunasekaran et al. 2017; Dubey et al. 2018a). Moreover, our study is the first to empirically investigate the moderating effect of organizational flexibility on the paths connecting big data analytics capability and supply chain agility/ competitive advantage. Thus, we contribute to the literature by addressing the need for more holistic understanding of distinct relationships among contingencies (i.e. organizational flexibility), response alternatives (i.e. big data analytics capability) and multiple performance outcomes (i.e. supply chain agility and competitive advantage). In doing so, we contribute to our understanding of the specific contextual factors under which big data analytics capability can effectively improve supply chain agility. Hence, by integrating the perspectives of the DCV and CT, we provide a solid theoretical grounding for our empirical investigation of CT as a complement to DCV, given its shortcomings in recognizing the complexity involved while bundling resources and capabilities (Eckstein et al. 2015).
7.2 Implications for practice
By empirically testing our theoretical model we provide established evidence (to surpass anecdotal evidence) that organizations in our sample do indeed benefit from big data analytics capability to sense market changes, including demands, pricing and promotional schemes of their competitors, and product inventories. Moreover, our results strengthen the notion that managers who can exploit the innovative technology in attempts to build capability at supply chain level can expect their organizations to gain competitive edge over their competitors (Davenport, 2006; Akter et al. 2016; Srinivasan and Swink, 2017). However, before building big data analytics capability, a thorough understanding of organizational flexibility is critical. Organizational flexibility stems from knowledge and abilities to change organizational structures and resource allocations quickly and efficiently. Our results suggest that organizational flexibility serves as a complementary capability to big data analytics capability in consistently improving supply chain agility in highly uncertain environments. Even though research provides evidence to show management practitioners that big data analytics capability does indeed pay off, practitioners require a better understanding of how they can develop this
critical dynamic capability. This issue is of critical importance, as big data analytics capability requires a significant investment of resources and effort. Hence, without appropriate understanding of the resources and the competences needed to build big data analytics capability, practitioners may not achieve the desired outcome via big data analytics capability.
7.3 Limitations and further research opportunities
Like any other studies, the results of our study are subject to several limitations that must be taken into consideration while interpreting these results. Firstly, we tested our theoretical model using data gathered at one point in time. Following Guide and Ketokivi (2015), we can argue that cross-sectional data is one of the major causes of CMB and causality. While we have performed several statistical analyses which may provide evidence that CMB and causality were not a major concern in our study, a longitudinal design would help to reduce the possibility of CMB that undermines the validity of studies with data from a single source at a single point in time.
Secondly, we used the perspectives of DCV and CT. However, future studies may use other theory or theories to provide better explanation. Scholars may investigate other organizational capabilities or assets considered as complements to big data analytics capability. Moreover, other theoretical perspectives including knowledge based view, absorptive capacity, organizational learning, organizational culture and top management commitment might provide useful extensions to our study.
Thirdly, we believe that survey based research has its own limitations. Hence, future researchers may be able to address some unanswered questions via case based methods.
Finally, the demographic of our research sample may limit the generalizability of our findings. Thus, the research findings should be applied to other contexts with caution. We acknowledge that any study using a survey-based approach often faces a generalizability issue. It is very difficult to obtain a sample that could claim to be truly representative of the whole population. Still, future research should be conducted over a period with samples from more industries, countries, and informants with diverse backgrounds.
Acknowledgement: We express our sincere thanks to the Editor-in-Chief, the Managing Editor
and the Associate Editor. We thank ACMA and the McKinsey India for their continued support in data collection. Finally, we thank the two anonymous reviewers for their valuable inputs.
Appendix 1: Profile of the respondents
Variables Category Respondents %
Gender Male 163 94.22 Female 10 5.78 Age >50 110 63.58 40-50 50 28.90 30-39 13 7.51 <30 nil nil
Education Level Doctorate 6 3.47
Postgraduate degree in Management 60 34.68
Postgraduate degree in Engineering 70 40.46
Postgraduate degree in Science 12 6.94
Bachelor's degree 23 13.29
Appendix 2: Loadings of the indicator variables, SCR and AVE
Construct Items
Factor
Loadings Variance Error SCR AVE
BDAC BDAC1 0.75 0.57 0.43 0.80 0.58 BDAC2 0.66 0.44 0.56 BDAC3 0.86 0.74 0.26 OF OF1 0.95 0.90 0.10 0.97 0.91 OF2 0.95 0.91 0.09 OF3 0.96 0.92 0.08 CA CA2 0.96 0.92 0.08 0.98 0.91 CA3 0.97 0.94 0.06 CA4 0.94 0.87 0.13 CA5 0.94 0.89 0.11 CA6 0.95 0.91 0.09 SCA SCA2 0.95 0.91 0.09 0.97 0.86 SCA3 0.93 0.87 0.13 SCA4 0.93 0.87 0.13 SCA5 0.95 0.90 0.10 SCA6 0.90 0.81 0.19 SCA7 0.88 0.78 0.22 ID ID1 0.78 0.61 0.39 0.93 0.77 ID2 0.96 0.92 0.08 ID3 0.96 0.92 0.08 ID4 0.81 0.65 0.35
Notes: BDAC, big data analytics capability; OF, organizational flexibility; CA, competitive advantage; SCA, supply chain agility; ID, industry dynamism
(BDAC1, CA1, SCA1, SCA8, SCA9, SCA10 were dropped from our analysis due to weak loadings)
Appendix 3: Model fit and quality indices Model fit and quality
indices
Value from analysis
Acceptable if Reference
APC 0.183, p=0.003 p<0.05 Rosenthal and Rosnow (1991)
ARS 0.489, p<0.001 p<0.05
AVIF 1.134, p<0.001 p<0.05 Kock (2015)
Tenenhaus GoF 0.693 Large if ≥
0.36
References
Akter, S., Fosso Wamba, S., Gunasekaran, A., Dubey, R., & Childe, S. J. (2016). How to improve firm performance using big data analytics capability and business strategy alignment? International Journal of Production Economics, 182, 113-131.
Akter, S., Fosso Wamba, S., & Dewan, S. (2017). Why PLS-SEM is suitable for complex modelling? An empirical illustration in big data analytics quality. Production Planning & Control, 28(11-12), 1011-1021.
Aldrich, H. E. (1979). Organizations and environments. Englewood Cliffs, NJ: Prentice-Hall.
Armstrong, J. S., & Overton, T. S. (1977). Estimating nonresponse bias in mail surveys. Journal of Marketing Research, 41(3), 396-402.
Barney, J. (1991). Firm resources and sustained competitive advantage. Journal of Management, 17(1), 99-120.
Blome, C., Schoenherr, T., & Rexhausen, D. (2013). Antecedents and enablers of supply chain agility and its effect on performance: a dynamic capabilities perspective. International Journal of Production Research, 51(4), 1295-1318.
Boyd, B. K., Takacs Haynes, K., Hitt, M. A., Bergh, D. D., & Ketchen Jr, D. J. (2012). Contingency hypotheses in strategic management research: Use, disuse, or misuse? Journal of Management, 38(1), 278-313.
Brandon‐Jones, E., Squire, B., Autry, C. W., & Petersen, K. J. (2014). A contingent resource‐ based perspective of supply chain resilience and robustness. Journal of Supply Chain Management, 50(3), 55-73.
Braunscheidel, M. J., & Suresh, N. C. (2009). The organizational antecedents of a firm’s supply chain agility for risk mitigation and response. Journal of Operations Management, 27(2), 119-140.
Brusset, X. (2016). Does supply chain visibility enhance agility?. International Journal of Production Economics, 171, 46-59.
Cao, M., & Zhang, Q. (2011). Supply chain collaboration: Impact on collaborative advantage and firm performance. Journal of Operations Management, 29(3), 163-180.
Chen, H., Chiang, R. H., & Storey, V. C. (2012). Business intelligence and analytics: From big data to big impact. MIS Quarterly, 36(4), 1165-1188.
Chin, W. W. (1998). Commentary: Issues and opinion on structural equation modeling. MIS Quarterly, 22(1), pp. Vii-Xvi.
Choi, T. M., Wallace, S. W., & Wang, Y. (2017). Big Data Analytics in Operations Management. Production and Operations Management, https://doi.org/ doi: 10.1111/poms.12838.
Christopher, M. (2000). The agile supply chain: competing in volatile markets. Industrial Marketing Management, 29(1), 37-44.
Christopher, M., & Towill, D. R. (2002). Developing market specific supply chain strategies. The international Journal of Logistics Management, 13(1), 1-14.
Davenport, T. H. (2006). Competing on analytics. Harvard Business Review, 84(1), 99-107.
Dubey, R., Altay, N., Gunasekaran, A., Blome, C., Papadopoulos, T., & Childe, S. J. (2018a). Supply chain agility, adaptability and alignment: empirical evidence from the Indian auto components industry. International Journal of Operations & Production Management, 38(1), 129-148.
Dubey, R., Gunasekaran, A., Childe, S. J., & Papadopoulos, T. (2018b). Skills needed in supply chain-human agency and social capital analysis in third party logistics. Management Decision, 56(1), 143-159.
Eckstein, D., Goellner, M., Blome, C., & Henke, M. (2015). The performance impact of supply chain agility and supply chain adaptability: the moderating effect of product complexity. International Journal of Production Research, 53(10), 3028-3046.
Eisenhardt, K. M., & Martin, J. A. (2000). Dynamic capabilities: what are they?. Strategic Management Journal, 21 (10/11), 1105-1121.
Fisher, M.L. (1997). What is the right supply chain for your product? Harvard Business Review, 75(2), 105-116.
Fornell, C., & Larcker, D. F. (1981). Evaluating structural equation models with unobservable variables and measurement error. Journal of Marketing Research, 18(1), 39-50.
Frisk, J. E., & Bannister, F. (2017). Improving the use of analytics and big data by changing the decision-making culture: A design approach. Management Decision, 55(10), 2074-2088.
Galbraith, J. R. (1973). Designing complex organizations. Addison-Wesley Longman Publishing Co., Inc.
Galbraith, J. R. (1974). Organization design: An information processing view. Interfaces, 4(3), 28-36.
Galbraith, J.R. (2014). Organization design challenges resulting from big data. Journal of Organizational Design, 3(1), 2-13.
Gligor, D. M., & Holcomb, M. C. (2012a). Understanding the role of logistics capabilities in achieving supply chain agility: a systematic literature review. Supply Chain Management: An International Journal, 17(4), 438-453.
Gligor, D. M., & Holcomb, M. C. (2012b). Antecedents and consequences of supply chain agility: establishing the link to firm performance. Journal of Business Logistics, 33(4), 295-308.
Gligor, D. M., Esmark, C. L., & Holcomb, M. C. (2015). Performance outcomes of supply chain agility: when should you be agile?. Journal of Operations Management, 33, 71-82.
Gligor, D. M., Holcomb, M. C., & Feizabadi, J. (2016). An exploration of the strategic antecedents of firm supply chain agility: The role of a firm's orientations. International Journal of Production Economics, 179, 24-34.
Grossman, R. L., & Siegel, K. P. (2014). Organizational models for big data and analytics. Journal of Organizational Design, 3(1), 20-25.
Guide, V. D. R., & Ketokivi, M. (2015). Notes from the editors: Redefining some methodological criteria for the journal. Journal of Operations Management, (37), v-viii.
Gunasekaran, A., Yusuf, Y. Y., Adeleye, E. O., & Papadopoulos, T. (2017). Agile manufacturing practices: the role of big data and business analytics with multiple case studies. International Journal of Production Research, 1-13.
Gunasekaran, A., Papadopoulos, T., Dubey, R., Fosso Wamba, S., Childe, S. J., Hazen, B., & Akter, S. (2017). Big data and predictive analytics for supply chain and organizational performance. Journal of Business Research, 70, 308-317.
Hazen, B. T., Boone, C. A., Ezell, J. D., & Jones-Farmer, L. A. (2014). Data quality for data science, predictive analytics, and big data in supply chain management: An introduction to the problem and suggestions for research and applications. International Journal of Production Economics, 154, 72-80.
Henseler, J., Dijkstra, T. K., Sarstedt, M., Ringle, C. M., Diamantopoulos, A., Straub, D. W. & Calantone, R. J. (2014). Common beliefs and reality about PLS: Comments on Rönkkö and Evermann (2013). Organizational Research Methods, 17(2), 182-209.
Hinterhuber, A. (2013). Can competitive advantage be predicted? Towards a predictive definition of competitive advantage in the resource-based view of the firm. Management Decision, 51(4), 795-812.
Jabbour, C. J. C., de Sousa Jabbour, A. B. L., Sarkis, J., & Godinho Filho, M. (2017). Unlocking the circular economy through new business models based on large-scale data: An integrative framework and research agenda. Technological Forecasting and Social Change.
Jüttner, U., & Maklan, S. (2011). Supply chain resilience in the global financial crisis: an empirical study. Supply Chain Management: An International Journal, 16(4), 246-259.
Kache, F. & Seuring, S. (2017). Challenges and opportunities of digital information at the intersection of Big Data Analytics and supply chain management. International Journal of Operations & Production Management, 37(1), 10-36.
Ketokivi, M. A., & Schroeder, R. G. (2004). Perceptual measures of performance: fact or fiction? Journal of Operations Management, 22(3), 247-264.
Khan K, A., & Pillania, R. K. (2008). Strategic sourcing for supply chain agility and firms' performance: A study of Indian manufacturing sector. Management Decision, 46(10), 1508-1530.
Kock, N. (2014). Advanced mediating effects tests, multi-group analyses, and measurement model assessments in PLS-based SEM. International Journal of e-Collaboration (IJeC), 10(1), 1-13.
Kock, N. (2015). WarpPLS 5.0 user manual. Laredo, TX: ScriptWarp Systems, Laredo, Texas, USA.
LaValle, S., Lesser, E., Shockley, R., Hopkins, M. S., & Kruschwitz, N. (2011). Big data, analytics and the path from insights to value. MIT Sloan Management Review, 52(2), 21-32.
Lamba, K., & Singh, S. P. (2017). Big data in operations and supply chain management: current trends and future perspectives. Production Planning & Control, 28(11-12), 877-890.
Lee, H. L. (2002). Aligning supply chain strategies with product uncertainties. California Management Review, 44(3), 105-119.
Lee, H. L. (2004). The triple-A supply chain. Harvard Business Review, 82(10), 102-113.
Lindell, M. K., & Whitney, D. J. (2001). Accounting for common method variance in cross-sectional research designs. Journal of Applied Psychology, 86(1), 114-121.
Liu, H., Ke, W., Wei, K. K., & Hua, Z. (2013). The impact of IT capabilities on firm performance: The mediating roles of absorptive capacity and supply chain agility. Decision Support Systems, 54(3), 1452-1462.
Liu, Y., Li, Y., & Wei, Z. (2009). How organizational flexibility affects new product development in an uncertain environment: Evidence from China. International Journal of Production Economics, 120(1), 18-29.
Malhotra, M. K., & Grover, V. (1998). An assessment of survey research in POM: from constructs to theory. Journal of Operations Management, 16(4), 407-425.
Manyika, J., Chui, M., Brown, B., Bughin, J., Dobbs, R., Roxburgh, C., & Byers, A. H. (2011). Big data: The next frontier for innovation, competition, and productivity. McKinsey Global
Institute. Accessed 16th May 2015:
http://www.mckinsey.com/insights/business_technology/big_data_the_next_frontier_for_innov ation.
Martí-Ballester, C. P. & Simon, A. (2017). Union is strength: The integration of ISO 9001 and ISO 14001 contributes to improve the firms’ financial performance. Management Decision, 55(1), 81-102.
Mishra, D., Gunasekaran, A., Papadopoulos, T., & Childe, S. J. (2016). Big Data and supply chain management: a review and bibliometric analysis. Annals of Operations Research, 1-24.
Mishra, D., Luo, Z., Jiang, S., & Dubey, R. (2017). A bibliographic study on big data: concepts, trends and challenges. Business Process Management Journal, 23(3), 555-573.
Moshtari, M. (2016). Inter‐Organizational Fit, Relationship Management Capability, and Collaborative Performance within a Humanitarian Setting. Production and Operations Management, 25(9), 1542-1557.
Pagell, M., & Krause, D. R. (1999). A multiple-method study of environmental uncertainty and manufacturing flexibility. Journal of Operations Management, 17(3), 307-325.
Papadopoulos, T., Gunasekaran, A., Dubey, R., & Fosso Wamba, S. (2017). Big data and analytics in operations and supply chain management: managerial aspects and practical challenges. Production Planning & Control, 28(11-12), 873-876.
Peng, D. X., & Lai, F. (2012). Using partial least squares in operations management research: A practical guideline and summary of past research. Journal of Operations Management, 30(6), 467-480.
Peteraf, M. A. (1993). The cornerstones of competitive advantage: A resource‐based view. Strategic Management Journal, 14(3), 179-191.
Podsakoff, P. M., & Organ, D. W. (1986). Self-reports in organizational research: Problems and prospects. Journal of management, 12(4), 531-544.
Podsakoff, P. M., MacKenzie, S. B., Lee, J. Y., & Podsakoff, N. P. (2003). Common method biases in behavioral research: a critical review of the literature and recommended remedies. Journal of Applied Psychology, 88(5), 879.
Porter, M.E. (1985). Competitive advantage: Creating and sustaining superior performance. New York: Free Press.
Pratono, A. H. (2016). Strategic orientation and information technological turbulence: Contingency perspective in SMEs. Business Process Management Journal, 22(2), 368-382.
Prescott, M.E. (2014). Big data and competitive advantage at Nielsen. Management Decision, 52(3), 573-601.
Raffoni, A., Visani, F., Bartolini, M., & Silvi, R. (2018). Business Performance Analytics: exploring the potential for Performance Management Systems. Production Planning & Control, 29(1), 51-67.
Reed, R., & DeFillippi, R. J. (1990). Causal ambiguity, barriers to imitation, and sustainable competitive advantage. Academy of Management Review, 15(1), 88-102.
Ren, S. J-F, Fosso Wamba, S., Akter, S., Dubey, R., & Childe, S. J. (2017). Modelling quality dynamics, business value and firm performance in a big data analytics environment. International Journal of Production Research, 55(17), 5011-5026.
Roden, S., Nucciarelli, A., Li, F., & Graham, G. (2017). Big data and the transformation of operations models: a framework and a new research agenda. Production Planning & Control, 28(11-12), 929-944.
Rosenthal, R., & Rosnow, R. L. (1991). Essentials of behavioral research: Methods and data analysis. McGraw-Hill Humanities Social.
Sambamurthy, V., Bharadwaj, A., & Grover, V. (2003). Shaping agility through digital options: Reconceptualizing the role of information technology in contemporary firms. MIS quarterly, 27(2), 237-263.
Sanchez, R. (1993). Strategic flexibility, firm organization, and managerial work in dynamic markets: A strategic options perspective. Advances in Strategic Management, 9(1), 251-291.
Sanchez, R. (1995). Strategic flexibility in product competition. Strategic Management Journal, 16(S1), 135-159.
Sanchez, R. (1997). Preparing for an uncertain future: Managing organizations for strategic flexibility. International Studies of Management & Organization, 27(2), 71-94.
Sanchez, R., & Mahoney, J. T. (1997). Modularity, flexibility, and knowledge management in product and organization design. IEEE Eng Manage Rev, 25(4), 50-61.
Sangari, M. S., & Razmi, J. (2015). Business intelligence competence, agile capabilities, and agile performance in supply chain: An empirical study. The International Journal of Logistics Management, 26(2), 356-380.
Sharma, M. K., Sushil, & Jain, P. K. (2010). Revisiting flexibility in organizations: exploring its impact on performance. Global Journal of Flexible Systems Management, 11(3), 51-68.
Singh, D., Singh Oberoi, J., & Singh Ahuja, I. (2013). An empirical investigation of dynamic capabilities in managing strategic flexibility in manufacturing organizations. Management Decision, 51(7), 1442-1461.
Sirmon, D. G., Hitt, M. A., Arregle, J. L., & Campbell, J. T. (2010). The dynamic interplay of capability strengths and weaknesses: investigating the bases of temporary competitive advantage. Strategic Management Journal, 31(13), 1386-1409.
Sousa, R., & Voss, C. A. (2008). Contingency research in operations management practices. Journal of Operations Management, 26(6), 697-713.
Srinivasan, R., & Swink, M. (2017). An investigation of visibility and flexibility as complements to supply chain analytics: An organizational information processing theory perspective. Production and Operations Management, https://doi.org/ doi: 10.1111/poms.12746.
Suarez, F. F., Cusumano, M. A., & Fine, C. H. (1996). An empirical study of manufacturing flexibility in printed circuit board assembly. Operations Research, 44(1), 223-240.
Swafford, P. M., Ghosh, S., & Murthy, N. (2006). The antecedents of supply chain agility of a firm: scale development and model testing. Journal of Operations Management, 24(2), 170-188.
Swafford, P. M., Ghosh, S., & Murthy, N. (2008). Achieving supply chain agility through IT integration and flexibility. International Journal of Production Economics, 116(2), 288-297.
Swamidass, P. M., & Newell, W. T. (1987). Manufacturing strategy, environmental uncertainty and performance: a path analytic model. Management Science, 33(4), 509-524.
Teece, D. J., Pisano, G., & Shuen, A. (1997). Dynamic capabilities and strategic management. Strategic Management Journal, 18(7), 509-533.
Tenenhaus, M., Vinzi, V. E., Chatelin, Y. M., & Lauro, C. (2005). PLS path modeling. Computational Statistics & Data Analysis, 48(1), 159-205.
Tracey, M., Vonderembse, M. A., & Lim, J. S. (1999). Manufacturing technology and strategy formulation: keys to enhancing competitiveness and improving performance. Journal of Operations Management, 17(4), 411-428.
Upton, D. M. (1994). The management of manufacturing flexibility. California Management Review, 36(2), 72-89.
Volberda, H. W. (1996). Toward the flexible form: How to remain vital in hypercompetitive environments. Organization Science, 7(4), 359-374.
Vorhies, D. W., & Morgan, N. A. (2005). Benchmarking marketing capabilities for sustainable competitive advantage. Journal of Marketing, 69(1), 80-94.
Wagner, S. M., & Neshat, N. (2012). A comparison of supply chain vulnerability indices for different categories of firms. International Journal of Production Research, 50(11), 2877-2891.
Waller, M. A., & Fawcett, S. E. (2013). Data science, predictive analytics, and big data: a revolution that will transform supply chain design and management. Journal of Business Logistics, 34(2), 77-84.
Fosso Wamba, S., Akter, S., Edwards, A., Chopin, G., & Gnanzou, D. (2015). How ‘big data’ can make big impact: Findings from a systematic review and a longitudinal case study. International Journal of Production Economics, 165, 234-246.
Fosso Wamba, S. (2017). Big data analytics and business process innovation. Business Process Management Journal, 23(3), 470-476.
Fosso Wamba, S., Gunasekaran, A., Akter, S., Ren, S. J. F., Dubey, R., & Childe, S. J. (2017). Big data analytics and firm performance: Effects of dynamic capabilities. Journal of Business Research, 70, 356-365.
Wang, G., Gunasekaran, A., Ngai, E. W., & Papadopoulos, T. (2016). Big data analytics in logistics and supply chain management: Certain investigations for research and applications. International Journal of Production Economics, 176, 98-110.
Whitten, G. D., Green, K. W. Jr,, & Zelbst, P. J. (2012). Triple-A supply chain performance. International Journal of Operations & Production Management, 32(1), 28-48.
Yusuf, Y. Y., Gunasekaran, A., Adeleye, E. O., & Sivayoganathan, K. (2004). Agile supply chain capabilities: Determinants of competitive objectives. European Journal of Operational Research, 159(2), 379-392.
Yusuf, Y. Y., Gunasekaran, A., Musa, A., Dauda, M., El-Berishy, N. M., & Cang, S. (2014). A relational study of supply chain agility, competitiveness and business performance in the oil and gas industry. International Journal of Production Economics, 147, 531-543.