PAPER • OPEN ACCESS
Nonparametric predictive inference for combining
diagnostic tests with parametric copula
To cite this article: Noryanti Muhammad et al 2017 J. Phys.: Conf. Ser. 890 012129
View the article online for updates and enhancements.
Related content
On the application of copula in modeling maintenance contract
B P Iskandar and H Husniah
-Pattern recognition of obstructive sleep apnoea and Cheyne--Stokes respiration Gerhard Weinreich, Jeff Armitstead and Helmut Teschler
-The influence of intuition and communication language in generating student conceptions
J. Handhika, C. Cari, A. Suparmi et al.
Content from this work may be used under the terms of theCreative Commons Attribution 3.0 licence. Any further distribution
Nonparametric predictive inference for combining
diagnostic tests with parametric copula
Noryanti Muhammad1, F P A Coolen2 and T Coolen-Maturi3
1Fakulti Sains & Teknologi Industri, Universiti Malaysia Pahang, 26300 Gambang, Kuantan,
Pahang, Malaysia
2Department of Mathematical Sciences, Durham University, Durham, DH1 3LE, UK 3
Durham University Business School, Durham University, Durham, DH1 3LB, UK E-mail: [email protected]
Abstract. Measuring the accuracy of diagnostic tests is crucial in many application areas including medicine and health care. The Receiver Operating Characteristic (ROC) curve is a popular statistical tool for describing the performance of diagnostic tests. The area under the ROC curve (AUC) is often used as a measure of the overall performance of the diagnostic test. In this paper, we interest in developing strategies for combining test results in order to increase the diagnostic accuracy. We introduce nonparametric predictive inference (NPI) for combining two diagnostic test results with considering dependence structure using parametric copula. NPI is a frequentist statistical framework for inference on a future observation based on past data observations. NPI uses lower and upper probabilities to quantify uncertainty and is based on only a few modelling assumptions. While copula is a well-known statistical concept for modelling dependence of random variables. A copula is a joint distribution function whose marginals are all uniformly distributed and it can be used to model the dependence separately from the marginal distributions. In this research, we estimate the copula density using a parametric method which is maximum likelihood estimator (MLE). We investigate the performance of this proposed method via data sets from the literature and discuss results to show how our method performs for different family of copulas. Finally, we briefly outline related challenges and opportunities for future research.
1. Introduction
Many researchers have discussed ways for combining test results, for example in [1, 2]. Often, linear combinations of the test results are used. For example, Su and Liu [3] derived an optimal linear combination that maximises the AUC when the test results for the non-diseased and diseased categories follow bivariate normal distributions. Pepe and Thompson [4] considered an empirical search of the optimal linear combination that maximises the Mann-Whitney U statistic of AUC, but this method is computationally complex as a search algorithm must be used. Liu et al. [5] proposed a linear combination by combining the minimum and maximum values of the test results. This involves searching for a single coefficient that maximises the Mann-Whitney U statistic of AUC but not all test results are measured on the same scale [5]. Esteban et al. [2] proposed a step-by-step algorithm for estimating the parameter of a linear combination of the test results, which is close to the maximizing the AUC corresponding to the best linear combination. Kang et al. [6] proposed a nonparametric stepwise approach
2
for the linear combination of the test results to search coefficient that maximises the Mann-Whitney U statistic of AUC. Both methods proposed by Esteban et al. [2] and Kang et al. [6] are computationally tractable. Recently, Yan et al. [7] proposed a combination method called pairwise approach, to maximize the AUC, by pairing one biomarker with the other biomarkers separately specifically for weak biomarkers (0.50<AUC<0.70).
All researchers mentioned above did not take dependence structures into account, such as using copula except Ghosh [8] and Sen [9]. Sen [9] presented the concept of copulas for multivariate distributions and dependence, and motivated the benefit of copulas via a number of applications including the design of clinical trials, microarray studies with survival endpoints and the analysis of dependent ROC curves. Ghosh [8] presented a binormal model for ROC curve estimation to accommodate multiple test results by considering the dependence using copulas. As mentioned by Bansal and Pepe [10], the dependence could be very important among the test results. They investigated the increment in the performance of measure accuracy that is possible by combining a novel continuous test result with a moderately performing standard continuous test result (AUC around 0.70 to 0.80) and found that an uncorrelated continuous test result with moderate performance on its own usually yields only minimally improved performance on the AUC [10]. The novel test result that has very poor performance on its own but is highly correlated with the standard test result, and a novel test result with poor (AUC<0.70) to moderate performance that is highly correlated with the standard test result gives large improvements in the performance of measure accuracy [10].
Many articles have addressed the problem of finding the optimal linear combinations to maximise the AUC, as mentioned above. In this paper, we introduce NPI for combining two diagnostic test results which detail discussed in [11]. We use NPI with a parametric copula introduced in [12], to combine two test results. NPI has been used for accuracy of the diagnostic tests with ordinal outcomes, with the inferences based on data for a disease group and non-disease group [13]. For accuracy of binary tests, NPI has been presented and discussed by Coolen-Maturi et al. [14], and for continuous test results in [15]. As NPI does not aim at inference for an entire population but instead explicitly considers a future observation, this provides an attractive alternative to standard methods [14].
2. Mathematical Modelling
Consider a bivariate random quantity of diagnostic test results, (X, Y), let (XnD
D+1, Y
D nD+1) be the next future bivariate random quantity of diagnostic test results and TnD
D+1 = αX
D nD+1 + (1−α)YnD
D+1 be the weighted average of the future two test results where α ∈ [0,1] and D denote as disease status, where D = 1 for the diseased group and D = 0 for the non-diseased group. For the diseased group, the lower probability for the event that the sum of the next future observations will exceed a particular threshold ξ is
S1c(t) =P(Tn11+1> ξ) = X (i,l)∈L1
t
h1il(θb1) (1)
with L1t ={(i, l) :αx1i−1+ (1−α)yl1−1> ξ}, and the corresponding upper probability is
S1c(t) =P(Tn11+1 > ξ) = X (i,l)∈U1
t
h1il(θb1) (2)
with Ut1={(i, l) :αx1i + (1−α)yl1 > ξ}where ξ∈(−∞,∞), andS1c(t) and S1c(t) are the lower and upper survival functions for the sum of the next future observations,Tn11+1 with considering copula denotes by subscript c. In line with [12], the probabilities h1il(θb1) are defined as
h1il(θb1) =PC(Xen1 1+1 ∈ i−1 n1+ 1 , i n1+ 1 ,Yen1 1+1 ∈ l−1 n1+ 1 , l n1+ 1 |θb1) (3)
fori, l= 1,2, . . . , n1+ 1 where PC(·|θˆ1) represents the copula-based probability with estimated copula where ˆθ1 is a parameter value from parametric copula for diseased group.
For the non-diseased group, the lower probability for the event that the sum of the next future observations will exceed a particular threshold ξ is
S0c(t) =P(Tn00+1> ξ) = X (j,k)∈L0
t
h0jk(θb0) (4)
with L0
t ={(j, k) :αx0j−1+ (1−α)yk0−1 > ξ}, and the corresponding upper probability is
S0c(t) =P(Tn00+1 > ξ) = X (j,k)∈U0
t
h0jk(θb0) (5)
withUt0 ={(j, k) :αx0j+ (1−α)y0k> ξ} whereξ∈(−∞,∞), andS0c(t) andS0c(t) are the lower and upper survival functions for the sum of the next future observation,Tn00+1. In line with [12], the probabilities h0jk(θb0) are defined as
h0jk(θb0) =PC(Xen0 0+1 ∈ j−1 n0+ 1 , j n0+ 1 ,Yen0 0+1∈ k−1 n0+ 1 , k n0+ 1 |θb0) (6) forj, k= 1,2, . . . , n0+ 1 wherePC(·|θˆ0) represents the copula-based probability with estimated copula where ˆθ0is a parameter value from parametric copula for non-diseased group. Throughout this paper, the subscript c is used to show the functions are considering the copula.
The NPI lower and upper survival functions from equations (1) - (5) are used to derive lower and upper false positive fraction (FPF) and true positive fraction (TPF) for the weighted average of the next future observation per group, for different threshold values ξ, and we combined to derive the corresponding NPI lower and upper ROC curves. The NPI lower and upper survival functions are optimal bounds for all survival functions corresponding toA(n)[16], which leads to the following optimal bounds for the TPF and FPF when considering the dependence structure
TPFc(ξ) =S1c(ξ) =P(Tn11+1 > ξ) = X (i,l)∈L1 t h1il(θb1) (7) TPFc(ξ) =S 1 c(ξ) =P(Tn11+1> ξ) = X (i,l)∈U1 t h1il(θb1) (8) FPFc(ξ) =S0c(ξ) =P(Tn00+1> ξ) = X (j,k)∈L0 t h0jk(θb0) (9) FPFc(ξ) =S 0 c(ξ) =P(Tn00+1> ξ) = X (j,k)∈U0 t h0jk(θb0) (10)
whereP andPthe are NPI lower and upper probabilities [17]. As the ROC combines the survival functions for the two groups, the NPI lower and upper ROC curves are again defined to be the optimal bounds for all such curves corresponding to any pair of survival functions S1
c(t) and
Sc0(t) forTn11+1 and Tn00+1 in between their respective NPI lower and upper survival functions, as given by equations (7) - (10). The ROC curve with copula clearly depends monotonously on the survival functions, it is easily seen that the optimal bounds, which are the NPI lower and upper ROC curves with copula, are
ROCc= F P Fc(ξ), T P Fc(ξ)
4 ROCc= F P Fc(ξ), T P Fc(ξ) , ξ ∈(−∞,∞) . (12)
In order to optimize the diagnostic accuracy of the weighted average of the future two diagnostic test results, we maximize the area under ROC curve by finding the value ofαsuch that
TnDD+1=αXnDD+1+(1−α)YnDD+1maximizes the AUC. For each blockBil1 = (x1i−1, x1i)(y1l−1, yl1), generated by the observed data, let t1i−1,l−1 = αxi1−1+ (1−α)yl1−1 be the combined weighted value corresponding to the left-bottom of the block. Andt1i,l=αx1i+ (1−α)yl1 be the combined weighted value corresponding to the right-top of the block. The same can be defined for each blockB0
jk = (x0j−1, x0j)(yk0−1, yk0), lett0j−1,k−1=αx0j−1+ (1−α)yk0−1 be the combined weighted value corresponding to the left-bottom of the block, andt0j,k =αx0j+ (1−α)y0kbe the combined weighted value corresponding to the right-top of the block. In line with equations (1) - (6), the NPI lower and upper probabilities AUC associated with the weighted average for the bivariate diagnostic test results with parametric copula can directly be defined as
AU Cc=P(Tn11+1 > Tn00+1) = n1+1 X i=1 n1+1 X l=1 h1il( ˆθ1) n0+1 X j=1 n0+1 X k=1 1{t0j,k < t1i−1,l−1}h0jk( ˆθ0) (13) AU Cc=P(Tn11+1> T 0 n0+1) = n1+1 X i=1 n1+1 X l=1 h1il( ˆθ1) n0+1 X j=1 n0+1 X k=1 1{t0j−1,k−1 < t1i,l}h0jk( ˆθ0) (14)
where 1{A} is an indicator function which is equal to 1 if event A occurs and 0 else. The optimal coefficients, αopt’s that maximizes the AUC in equations (13) and (14) can be denoted by ˆαLc and ˆαcU, respectively.
3. Results and Discussions
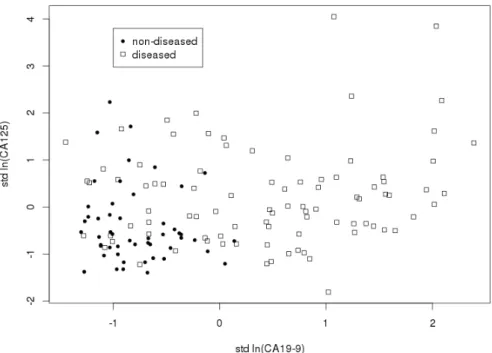
The data set considers diagnostic markers for pancreatic cancer and consists of 141 patients [18]; 90 pancreatic cancer patients and 51 control group patients with pancreatitis. Two serum markers were measured on these patients, the antigens CA125 and CA19-9 which are positively correlated [4]. To illustrate our approach, we have adjusted the data to avoid tied observations as discussed in [11]. Let antigen CA19-9 be theXvariable and antigen CA125 be theY variable. In this example, the data are transformed to a natural logarithmic scale as used by Pepe and Thompson in [4]. Then we standardize the data to have mean zero and variance one in order to assist in the interpretation of α as a relative weight of Y to X in the combination. The mean values for X are 0.44 for the diseased group and −0.78 for the non-diseased group, and the mean values for Y are 0.22 for the diseased group and −0.40 for the non-diseased group. The scatter plot of this data set is presented in figure 1. We consider the dependence structure by using parametric copulas, as before in [12], we use the Normal, Frank, Clayton and Gumbel copulas. It should be emphasized that any parametric copulas can be used. Consider a weighted average, TnDD+1=αXnDD+1+ (1−α)YnDD+1 for NPI with copula method as discussed in Section 2. The optimal coefficients and the corresponding AUC values for the method of different family of copulas are shown in table 1.
Based on table 1, we have different values of ˆαcL, ˆαcU and the AUC values depending on the choice of copula. The Clayton copula gives the highest lower and upper AUC values compared to the other parametric copulas used, AUCc= 0.8364 and AUCc= 0.8947, with corresponding
ˆ
αcL= 0.7066 and ˆαcU = 0.7061, respectively. This feature occurs due to the data set for diseased and non-diseased groups have a great dependence on the negative tails compared to positive
Figure 1. Scatter plot for pancreatic cancer data set.
Table 1. AUC values for different family of copulas. ˆ
αc
L AU Cc αˆcU AU Cc
NPI with Normal Copula 0.7160 0.8306 0.7151 0.8896 NPI with Frank Copula 0.7077 0.8324 0.7077 0.8920 NPI with Clayton Copula 0.7066 0.8364 0.7061 0.8947 NPI with Gumbel Copula 0.7215 0.8301 0.7226 0.8880
tails, which is captured by the Clayton copula. This can be seen from figure 1, where for each group, small x and y observation values are close to each other compared to large x and y
observation values. The second highest of NPI lower and upper AUC values are achieved by the Frank copula and followed by Normal and Gumbel copulas as shown in table 1.
By considering the weighted average in the combination of these two random quantities, a quite large increment on AUC values for all approaches is achieved as compared to only one test results used discussed in [4]. In terms of weighted values, we can see that the NPI with Gumbel copula puts more weight on X compared to other copula families, as the difference between mean values of the diseased and non-diseased groups for X greater than Y. We also saw this effect in the simulation study in [11].
4. Conclusion
As conclusion, the use of a linear combination of the two variables may effectively deal with this linear dependence, hence the copula has no further opportunity to pick up other aspects of dependence in the data. We expect that the use of the copula, and particularly nonparametric copulas which discussed by [19], in our method will make a positive difference to the ROC approach in this paper if the underlying data have a nonlinear dependence structure.
6
References
[1] Pepe M S, Cai T and Longton G 2006Biometrics 62221–229
[2] Esteban L M, Sanz G and Borque A 2011Journal of Applied Statistics 38899–911 [3] Su J Q and Liu J S 1993Journal of the American Statistical Association 881350–1355 [4] Pepe M S and Thompson M L 2000Biostatistics1123–140
[5] Liu C, Liu A and Halabi S 2011Statistics in Medicine302005–2014
[6] Kang L, Liu A and Tian L 2013Statistical Methods in Medical Research SAGE Publications [7] Yan L, Tian L and Liu S 2015Statistics in Medicine343811–3830
[8] Ghosh D May 2004 The University of Michigan Department of Biostatistics Working Paper Series Http://biostats.bepress.com/umichbiostat/paper39
[9] Sen K O P K 2003Metron 61323–353
[10] Bansal A and Sullivan Pepe M 2013Statistics in Medicine 321877–1892
[11] Muhammad N 2016Predictive inference with copulas for bivariate dataPh.D. thesis Durham University [12] Coolen-Maturi T, Coolen F P and Muhammad N 2016Journal of Statistical Theory and Practice [13] Elkhafifi F F and Coolen F P A 2012Journal of Statistical Theory and Practice6681–697
[14] Coolen-Maturi T, Coolen-Schrijner P and Coolen F P A 2012Journal of Statistical Theory and Practice 6 665–680
[15] Coolen-Maturi T, Coolen-Schrijner P and Coolen F P A 2012Journal of Statistical Planning and Inference 1421141 – 1150
[16] Coolen F P A, Coolen-Schrijner P and Yan K J 2002Reliability Engineering & System Safety 78185–193 [17] Augustin T and Coolen F P A 2004Journal of Statistical Planning and Inference 124251–272
[18] Wieand S, Gail M H, James B R and James K L 1989Biometrika76585–592 [19] Muhammad N, Coolen F P A and Coolen-Maturi T 2015AIP Conference Proceedings