Calhoun: The NPS Institutional Archive
Theses and Dissertations Thesis and Dissertation Collection
2016-12
Cost-benefit analysis of implementing a
car-sharing model to the Navy's passenger
vehicle fleet
Allen, Christopher
Monterey, California: Naval Postgraduate School http://hdl.handle.net/10945/51677
NAVAL
POSTGRADUATE
SCHOOL
MONTEREY, CALIFORNIA MBA PROFESSIONAL REPORT
COST-BENEFIT ANALYSIS OF
IMPLEMENTING A CAR-SHARING
MODEL TO THE NAVY’S
PASSENGER VEHICLE FLEET
December 2016
By: Christopher Allen
Robert Cullinan Gregory McCleery Advisors: Glenn Cook
Douglas MacKinnon
REPORT DOCUMENTATION PAGE Form Approved OMB No. 0704–0188
Public reporting burden for this collection of information is estimated to average 1 hour per response, including the time for reviewing instruction, searching existing data sources, gathering and maintaining the data needed, and completing and reviewing the collection of information. Send comments regarding this burden estimate or any other aspect of this collection of information, including suggestions for reducing this burden, to Washington headquarters Services, Directorate for Information Operations and Reports, 1215 Jefferson Davis Highway, Suite 1204, Arlington, VA 22202-4302, and to the Office of Management and Budget, Paperwork Reduction Project (0704-0188) Washington, DC 20503.
1. AGENCY USE ONLY
(Leave blank) 2. REPORT DATEDecember 2016 3. REPORT TYPE AND DATES COVEREDMBA professional report
4. TITLE AND SUBTITLE
COST-BENEFIT ANALYSIS OF IMPLEMENTING A CAR-SHARING MODEL TO THE NAVY’S PASSENGER VEHICLE FLEET
5. FUNDING NUMBERS 6. AUTHOR(S) Christopher Allen, Robert Cullinan, and Gregory
McCleery
7. PERFORMING ORGANIZATION NAME(S) AND ADDRESS(ES)
Naval Postgraduate School Monterey, CA 93943-5000
8. PERFORMING
ORGANIZATION REPORT
NUMBER
9. SPONSORING /MONITORING AGENCY NAME(S) AND ADDRESS(ES)
N/A
10. SPONSORING / MONITORING AGENCY REPORT NUMBER
11. SUPPLEMENTARY NOTES The views expressed in this thesis are those of the author and do not reflect the official policy or position of the Department of Defense or the U.S. Government. IRB Protocol number
____N/A____.
12a. DISTRIBUTION / AVAILABILITY STATEMENT
Approved for public release. Distribution is unlimited. 12b. DISTRIBUTION CODE 13. ABSTRACT (maximum 200 words)
The Navy leases more than 3,300 vehicles annually to commands and bases throughout the United States; however, the management model is antiquated, and there are now new fleet management options available.
The purpose of this study is to examine the costs and benefits of utilizing a commercial car-sharing model or implementing a Fleet-Sharing solution to replace the current ownership model administered by Naval Facilities Engineering Command (NAVFAC). We will use a Cost-Benefit Analysis (CBA) framework to analyze a data set provided by NAVFAC for the Naval Air Station (NAS) Jacksonville (JAX) locality and compare the net benefit of three available alternatives. The first alternative is continued operation with the current model (Status Quo). The second alternative is replacement of the current model with a contractor operated commercial car-sharing model. The third alternative involves integrating a fleet management hardware/software solution (fleet-sharing).
The goal of this CBA is to compare alternatives in order to identify the one with the highest net benefit. The data set conclusively supports alternative three, which provides a reduced initial cost versus the status quo and a cumulative net present value. Therefore, we recommend implementing a fleet-sharing solution to the existing fleet at NAS JAX.
14. SUBJECT TERMS
cost-benefit analysis, car-sharing, fleet-sharing 15. NUMBER OF PAGES
131 16. PRICE CODE 17. SECURITY CLASSIFICATION OF REPORT Unclassified 18. SECURITY CLASSIFICATION OF THIS PAGE Unclassified 19. SECURITY CLASSIFICATION OF ABSTRACT Unclassified 20. LIMITATION OF ABSTRACT UU
NSN 7540–01-280-5500 Standard Form 298 (Rev. 2–89)
Approved for public release. Distribution is unlimited.
COST-BENEFIT ANALYSIS OF IMPLEMENTING A CAR-SHARING MODEL TO THE NAVY’S PASSENGER VEHICLE FLEET
Christopher Allen, Lieutenant Commander, United States Navy Robert Cullinan, Lieutenant Commander, United States Navy Gregory McCleery, Lieutenant Commander, United States Navy Submitted in partial fulfillment of the requirements for the degree of
MASTER OF BUSINESS ADMINISTRATION
from the
NAVAL POSTGRADUATE SCHOOL December 2016
Approved by: Glenn Cook
Douglas MacKinnon
Glenn Cook
Academic Associate
COST-BENEFIT ANALYSIS OF IMPLEMENTING A
CAR-SHARING MODEL TO THE NAVY’S PASSENGER VEHICLE
FLEET
ABSTRACT
The Navy leases more than 3,300 vehicles annually to commands and bases throughout the United States; however, the management model is antiquated, and there are now new fleet management options available.
The purpose of this study is to examine the costs and benefits of utilizing a commercial car-sharing model or implementing a Fleet-Sharing solution to replace the current ownership model administered by Naval Facilities Engineering Command (NAVFAC). We will use a Cost-Benefit Analysis (CBA) framework to analyze a data set provided by NAVFAC for the Naval Air Station (NAS) Jacksonville (JAX) locality and compare the net benefit of three available alternatives. The first alternative is continued operation with the current model (Status Quo). The second alternative is replacement of the current model with a contractor operated commercial car-sharing model. The third alternative involves integrating a fleet management hardware/software solution (fleet-sharing).
The goal of this CBA is to compare alternatives in order to identify the one with the highest net benefit. The data set conclusively supports alternative three, which provides a reduced initial cost versus the status quo and a cumulative net present value. Therefore, we recommend implementing a fleet-sharing solution to the existing fleet at NAS JAX.
TABLE OF CONTENTS
I. INTRODUCTION...1
A. BACKGROUND ...1
B. PURPOSE ...1
C. LIMITATIONS OF RESEARCH ...2
II. PILOT STUDY REVIEW ...3
A. 2009-2011 NAVFAC FLEET SHARE PILOT ...5
1. Pilot Summary ...5
2. Pilot 1A. Norfolk, VA, Details ...6
3. Pilot 1B. Bangor, WA Details...7
4. Pilot 1C. Great Lakes, IL Details ...7
5. Costs and Assumptions ...7
6. Challenges ...8
B. 2011 GSA FLEET SHARE PILOT ...9
1. Pilot Summary ...9
2. Assumptions and Costs ...9
3. Challenges ...10
4. Results ...10
C. 2014 GSA FLEET SHARE PILOT ...11
D. 2015 GSA CAR-SHARING PILOT (AIKEN, 2016) ...11
1. Pilot Summary ...11
2. Pilot 4B. Providence, RI, Details...12
3. Pilot 4A. Washington, DC, Details ...12
4. Costs, Assumptions, and Usable Metrics ...12
5. Results ...13
III. METHODOLOGY ...15
A. COST-BENEFIT ANALYSIS (CBA) ...15
B. OPTIMUM FLEET SIZE ...15
C. SUMMARY ...21
IV. COST-BENEFIT ANALYSIS...23
A. SPECIFY SET OF ALTERNATIVES ...23
1. Status Quo...23
2. Alternative I: Commercial Car-Sharing ...26
1. NAVFAC ...32
2. GSA ...32
3. Tenant Commands & Customers (End Users) ...33
4. NAVFAC Employees ...33
5. Base Commanding Officer (CO) ...33
6. Potential Contractors...34
7. Taxpayers...34
C. CATALOG OF IMPACTS AND MEASUREMENT INDICATOR SELECTION ...34
1. Base Support, Vehicles and Equipment (BSVE) Program Costs ...36
2. Fuel Costs ...39
3. Additional Parking...39
4. Salvage Value ...40
5. Project Management, Setup and Training Costs ...40
6. Administrative Labor Costs ...41
7. Training Costs ...41
8. Car-Share Usage Costs ...42
9. Car-Share Membership and Application Fees ...43
10. Ca- Share Fees and Non-Cancellation Charges ...43
11. Fleet-Share Hardware Installation and Transfer Costs ...44
12. Fleet-Share Recurring Costs ...45
13. Smart Card Costs ...45
14. Additional Impacts that were Considered but not Included ...46
D. QUANTITATIVE IMPACT PREDICTION OVER PROJECT LIFE ...46
1. Base Support, Vehicles and Equipment (BSVE) Program Costs ...47
2. Fuel Costs ...48
3. Additional Parking...49
4. Salvage Value ...50
5. Project Management, Setup and Training Costs ...50
6. Administrative Labor Costs ...50
7. Training Costs ...51
8. Car-Share Usage Costs ...51
9. Car-Share Membership and Application Fees ...51
10. Car-Share Fees and Non-Cancellation Charges ...52
11. Fleet-Share Hardware Installation and Transfer Costs ...52
13. Smart Card Costs ...52
E. IMPACT MONETIZATION ...53
1. Base Support Vehicle and Equipment (BSVE) Program Costs ...53
2. Fuel Costs ...58
3. Additional Parking...60
4. Salvage Value ...62
5. Project Management, Setup and Training Costs ...65
6. Administrative Labor Costs ...66
7. Training Costs ...67
8. Car-Share Usage Costs ...69
9. Car Share Application and Membership Fees ...72
10. Car Share Fees and Non-Cancellation Charges ...74
11. Fleet-Share Hardware Installation and Transfer Costs ...75
12. Fleet-Share Recurring Costs ...76
13. Smart Card Costs ...76
F. DISCOUNTING TO OBTAIN PRESENT VALUE ...79
1. Car-Share Alternative ...79
2. Fleet-Share Alternative ...81
G. NET PRESENT VALUE COMPUTATION ...82
1. Car-Sharing Alternative ...82
2. Fleet-Sharing Alternative ...84
3. Summary ...85
H. SENSITIVITY ANALYSIS ...86
1. Methodology ...86
2. Car-Sharing Sensitivity Analysis ...87
3. Sensitivity Analysis for Fleet-Sharing Alternative...95
4. Summary ...100
V. RECOMMENDATION AND FUTURE RESEARCH ...101
A. CONCLUSIONS ...101
B. RECOMMENDATION ...102
C. OPPORTUNITIES FOR FUTURE RESEARCH ...103
1. CBA Increased Scope to Include Costs and Benefits at the DOD or National Level ...103
2. Evaluate the Impact of the Manning Requirements due to Changes in the Vehicle Management. ...103
3. Perform a Monte Carlo Analysis ...103
4. Cost of Adding Common Access Cards (CAC) RFID capability ...104
5. Daily and Hourly Rates for Car-Sharing...104
6. Disaggregate Base Support, Vehicle and Equipment (BSVE) Costs ...104
7. Utilization as Metrics are Tracked ...105
8. Increased Use due to Increased Ease of Vehicle Availability...105
9. Right Sized Fleet to more Sedans Instead of Trucks ...105
LIST OF REFERENCES ...107
LIST OF FIGURES
Figure 1. Status Quo Process Flow for B-Pool ...25
Figure 2. Commercial Car-Sharing Process Flow ...27
Figure 3. Fleet-Sharing Process Flow ...29
Figure 4. Stakeholder Salience Model. Adapted from Mitchell et al. (1997). ...31
Figure 5. Car-Sharing Discounted Costs and Benefits by FY. ...80
Figure 6. Fleet-Sharing Discounted Costs and Benefits by FY. ...82
Figure 7. Net Present Value Comparison ...85
Figure 8. 5-Year Net Benefits of Worst-Case Values. ...94
LIST OF TABLES
Table 1. Pilot Accepted Minimum Metrics. ...5
Table 2. Estimated Cost Savings of Fleet Reduction. Adapted from Cook et al. (2013) ...8
Table 3. Hourly Car-Sharing Costs versus GSA Fleet Lease. Adapted from Aiken (2016) ...13
Table 4. Enterprise Car Share versus GSA Fleet Lease. Source: Aiken (2016) ...13
Table 5. Major Steps in a CBA. ...15
Table 6. Determination of Vehicle Eligibility for Vehicle Sharing ...16
Table 7. Vehicles Eligible for Car-Sharing at NAS Jacksonville. ...18
Table 8. Miles Driven to Utilization Conversion. ...19
Table 9. Current Utilization of Eligible Vehicles at NAS Jacksonville. ...20
Table 10. Recommended Number of Vehicles at NAS Jacksonville. ...21
Table 11. Stakeholder Analysis. Adapted from Mitchell et al. (1997) ...32
Table 12. Impacts, Sources, and Measurements of Costs ...35
Table 13. Fees and Penalty Charges. Source: Aiken (2016) ...44
Table 14. BSVE Rates for Navy Region Southeast. ...48
Table 15. Average Fuel Prices for the United States ...49
Table 16. GS13 Step 5 Payscale for Jacksonville Locality...50
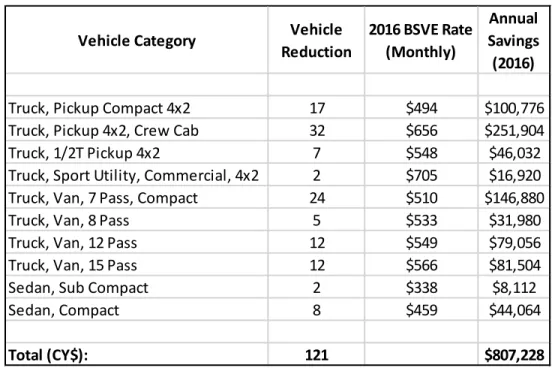
Table 17. Car-Sharing Annual Savings from reduced BSVE Program Costs (CY$). ...54
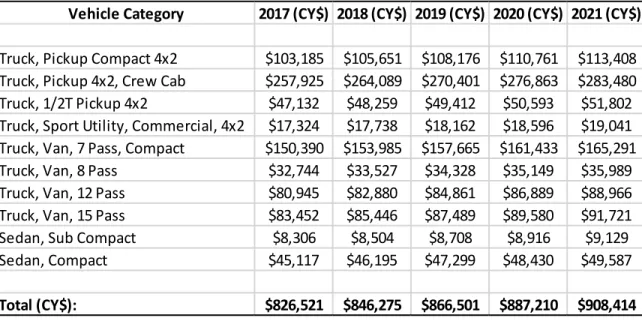
Table 18. Car-Sharing Savings from Reduced BSVE Program Costs Over Project Life (CY$). ...55
Table 19. Fleet-Sharing Number of Vehicles Selected for Salvage. ...56
Table 20. Fleet-Sharing Annual Savings from Reduced BSVE Program Costs (2016$). ...57
Table 21. Fleet-Sharing Savings from Reduced BSVE Program Costs over
Project Life (CY$). ...58
Table 22. Annual Fuel Consumption per Vehicle Type. ...59
Table 23. Total Fuel Costs assuming 5.14% Annual Growth in Fuel Prices (CY$). ...60
Table 24. Monthly Rates at City Managed Parking Facilities. ...61
Table 25. Benefit of Additional Parking (WTP). ...61
Table 26. Average Annual Vehicle Mileage by Category. ...62
Table 27. Average Total Vehicle Mileage by Category. ...63
Table 28. Net Salvage Value (FY$) for Car-Sharing Alternative. ...64
Table 29. Net Salvage Value (FY$) for Fleet-Sharing Alternative. ...65
Table 30. Historic Inflation Rates. Adapted from Historical Inflation Rates 1914–2016 (n.d.) ...66
Table 31. Administrative Labor Hours at Norfolk and Great Lakes Pilots. Adapted from Cook et al. (2013) ...66
Table 32. Calculated Vehicle Administrative Time Costs. ...67
Table 33. GS13 Step5 Pay Scale for Jacksonville, FL...67
Table 34. Initial Employee Enrollment Estimates. ...68
Table 35. Calculated Hourly Cost for a GS-11 Step 5. ...69
Table 36. Calculated Training Costs assuming 50% Enrollment. ...69
Table 37. Ratio of Hourly Rate to Vehicle MSRP. ...70
Table 38. Calculated Car-Sharing Hourly Rates. ...71
Table 39. Calculated Annual Car-Sharing Costs ...72
Table 40. Calculated Car-Sharing Application Fee for NAS, Jacksonville. ...73
Table 41. Estimated Annual Membership Fees. ...73
Table 42. Fees Accumulated During Washington, DC. Pilot. Adapted from Aiken (2016) ...74
Table 43. Total Fees and Non-Cancellation Charges Incurred. ...75
Table 44. Hardware Installation & Transfer Costs. ...76
Table 45. Annual Recurring Service Costs. ...76
Table 46. Smart Card Costs. ...77
Table 47. Car-Sharing Cost and Benefit Summary...78
Table 48. Fleet-Sharing Cost and Benefit Summary. ...78
Table 49. Car-Sharing Discounted Costs and Benefits by FY. ...80
Table 50. Fleet-Sharing Discounted Costs and Benefits by FY. ...81
Table 51. Car-Sharing NPV Computation. ...83
Table 52. Car-Sharing NPV Ratio ...83
Table 53. Fleet-Sharing NPV Computation ...84
Table 54. Fleet-Sharing NPV Ratio ...85
Table 55. Car-Sharing Base-Case Values and Level of Uncertainty. ...87
Table 56. Estimated Worst-Case Values. ...88
Table 57. BSVE Static Rate Assumption. ...89
Table 58. Worst-Case Estimated Fuel Costs per Calendar Year. ...89
Table 59. Worst-Case Estimated Parking Costs base on WTP ...90
Table 60. Worst-Case Vehicle Salvage Values. ...90
Table 61. Worst-Case Labor Wage Growth Estimate. ...91
Table 62. Worst-Case Enrollment Costs. ...91
Table 63. Worst-Case Car Share Usage Costs. ...92
Table 64. Worst-Case Car Share Application Fees. ...92
Table 65. Worst-Case Car Share Membership Fees. ...93
Table 68. Fleet-Sharing Worst-Case Values. ...96
Table 69. Worst-Case BSVR Program Costs Saved. ...97
Table 70. Worst-Case Salvage Value. ...98
Table 71. Worst-Case Fleet-Share Hardware Installation and Transfer Costs. ...98
Table 72. Worst-Case Fleet-Share Recurring Costs. ...99
LIST OF ACRONYMS AND ABBREVIATIONS
AO Authorizing OfficialBSVE Base Support, Vehicles, & Equipment CAC Common Access Card
CBA Cost-Benefit Analysis CNO Chief of Naval Operations CO Commanding Officer CONUS Contiguous United States
CY Current Year
DOD Department of Defense DOT Department of Transportation
EC Equipment Code
ENGCOM Engineering Command
EXWC Engineering and Expeditionary Warfare Center FEC Facility Engineering Commands
FHWA Federal Highway Administration FMIS Fleet Management Information System
FY Fiscal Year
GS General Schedule
GSA General Services Administration HAZMAT Hazardous Material
IA Information Assurance IO Inventory Objective IT Information Technology JAX Jacksonville, FL MIDLANT Mid-Atlantic MIDWEST Mid-Western MPG Miles per Gallon
MSRP Manufacturers Suggested Retail Price NAS Naval Air Station
NAVSTA Naval Station
NPU Number at Peak Usage NPV Net Present Value
OMB Office of Management and Budget POV Privately Owned Vehicles
PVB Present Value Benefits PVC Present Value Costs
RFID Radio-frequency Identification RMF Risk Management Framework ROB Regional Office Building T&T Travel and Transportation USN United States Navy WCF Working Capital Fund WTP Willingness to Pay
VAM Vehicle Allocation Methodology XO Executive Officer
I.
INTRODUCTION
A. BACKGROUND
The U.S. Navy currently maintains a fleet of approximately 3,300 motor vehicle assets to support its operations and mission requirements across the globe. Many of these vehicles are leased by individual Navy commands on a long-term basis and are then utilized for a few hours each day, or sometimes less, spending the remaining time idle in the parking lot. In an era of shrinking budgets and increased financial accountability, requirements such a large and potentially underutilized fleet represents a significant cost driver for the Navy. Naval Facilities Engineering Command (NAVFAC), the government entity charged with the responsibility for managing the Navy’s motor vehicle fleet, believes there is a potential for significant cost avoidance and efficiency gains through a reduction in motor vehicle fleet size and its associated costs. Two alternatives identified to achieve this reduction identified by NAVFAC are the adoption of a commercial car-sharing model, exemplified by Zip-Car and Enterprise Car Share, or the adoption of a fleet-share model, which integrates commercial fleet-sharing technology into the pre-existing motor vehicle fleet. Collectively, these two options are referred to as vehicle sharing for the duration of this cost-benefit analysis. NAVFAC estimates the potential introduction of a vehicle-sharing alternative to the existing model on a naval installation to be feasible and the return relatively high.
B. PURPOSE
The purpose of this analysis is to develop a robust methodology encompassing key parameters, such as vehicle mileage and utilization rates, to determine the optimum number and mix of vehicles required to operate a vehicle-sharing operation for long-term lease vehicle assets (B-Pool) at Naval Air Station (NAS) Jacksonville, Florida. Then, using the previously determined optimum number of vehicles, conduct a cost-benefit analysis for the implementation of a vehicle-sharing model at NAS Jacksonville to answer the following questions:
• Could implementation or integration of a commercial car-sharing model or commercially procured fleet-sharing hardware/software be financially beneficial to the Navy? If so, how?
• Can vehicle utilization be increased, while reducing fleet size using available alternatives? If so, by how much?
• What are additional pros and cons of the available alternatives, and what are the specific challenges from the Navy perspective?
C. LIMITATIONS OF RESEARCH
Ideally, data would be collected using installed hardware and software packages, known as telematics, on each General Services Administration (GSA)-owned vehicle. Unfortunately, during the installation phase, which ran from October 2015 to January 2016, there were complications stemming from the addition of new regulatory requirements introduced in the Department of Defense Instruction (DoDI) 8510.01 (Department of Defense [DOD], 2014). This Risk Management Framework for Department of Defense (DOD) Information Technology (IT) required that all Navy systems that record and transmit Navy data incorporate numerous security controls and be certified as compliant with Navy cybersecurity requirements (Takai, 2014). The administrative and fiscal burden associated with DoDI 8510.01 prevented the successful completion of the implementation of telematics devices in the Navy motor vehicle fleet and the project remains ongoing. NAS Jacksonville, the location chosen by NAVFAC for this analysis, does not yet have the telematics technology installed on their vehicle fleet so the analysis was conducted using available data retrieved from NAVFAC’s MAXIMO system. MAXIMO is the enterprise resource used by NAVFAC to manage all data associated with the motor vehicle program.
This analysis conclusively supports the adoption of a fleet-sharing model at NAS Jacksonville. Based on the findings of this cost-benefit analysis, the integration of fleet-sharing telematics technology greatly reduces fleet size and operating costs while potentially increasing customer satisfaction and user convenience. This model also has significant potential for expansion to additional Navy locations with similar reductions in fleet size and operating costs.
II.
PILOT STUDY REVIEW
Currently, the Navy maintains an enormous fleet of vehicles to sustain the daily operations of the fleet and all of its supporting commands. Naval Facilities Engineering Command (NAVFAC) is the entity designated by the Navy with responsibility for managing all aspects of the Navy’s motor vehicle fleet. Under the current motor vehicle management and procurement model, NAVFAC leases or buys vehicles from the General Services Administration (GSA) and then leases them to other Navy commands, from here on referred to as customers, using a two tiered leasing model based on term length. Assets used to fill short-term rental needs for non-standard or non-recurring requirements and are rented on an hourly or daily basis are C-Pool assets. B-Pool assets are used to fill customer’s full time vehicle requirements and are leased on a long-term basis with a flat monthly lease rate. This monthly fee, known as the Base Support, Vehicle and Equipment (BSVE) rate, also covers all fuel, maintenance and repair costs associated with the vehicle. Once leased on a long-term basis the vehicle is completely at the leasing commands disposal to be used as needed to meet mission requirements. When not in use, the vehicle sits idle until needed. Data provided by NAVFAC suggests that the current motor vehicle fleet is underutilized and GSA, NAVFAC and other government departments continue to research innovative alternatives to the current motor vehicle model that offer potential cost savings to the Navy and its customers. The purpose of this paper is to analyze vehicle sharing as a potential alternative to the current motor vehicle model. The two vehicle-sharing alternatives that will be studied and compared to the current model are car-sharing and fleet-sharing.
Commercial car-sharing companies, such as Zipcar and Enterprise Car Share, are becoming more common in densely populated areas and share similar functionality. The vehicles are parked in designated areas and reserved using mobile or Internet connected applications. An approved reservation allows the leasee to pick up the specific vehicle at a designated time and place and use it as required until the reservation period ends. Fuel is included in the hourly price and borrowers pay only for the duration of their reservation.
Fleet-sharing companies provide telematics and vehicle access hardware such as Radio-Frequency Identification (RFID) cards to organizations to allow them to self-manage their fleets in a manner similar to commercial car-sharing companies. Telematics is a system of hardware and software options integrated into the motor vehicle that collects, stores, and transmits utilization data such as time and mileage to a management server. The fleet-sharing technology provider allows customers’ access to the server to track utilization and manage fleet maintenance and other requirements. They also provide customers with access to a technology-]based server that allows the customer’s employees to reserve shared vehicles via mobile or Internet connected applications.
The primary difference between commercial car-sharing and fleet-sharing is the ownership of the vehicles. With a car-sharing alternative, all shared vehicles are owned and managed by the commercial car-sharing company. With fleet-sharing, all shared vehicles are owned and managed by the government using commercially provided vehicle telematics technology. Both options offer the potential to significantly reduce total fleet size since the total pool of vehicles is now shared among all of the commands and rented on an hourly basis as needed, rather than leased by individual commands on a monthly basis and left idle for long periods when not in use.
This chapter will present an analysis of the most recent pilot studies conducted by government entities and determine whether the data is accepted as relevant to the current pilot study to be conducted at Naval Air Station (NAS) Jacksonville in Florida, as shown in Table 1. The pilots are grouped into separate car-sharing and fleet-sharing categories.
Since 2009, NAVFAC and GSA have conducted four pilot studies in selected regions around the country with a wide range of results. A review of the car-sharing and fleet-sharing pilots conducted by the government will provide insight on how these models could be implemented on a full scale operational basis instead of an isolated segment within a base operation.
Table 1 lists the pilots considered and accepted for review based on the following pilot acceptance criteria.
Fleet-Sharing Hardware/Software to the existing GSA fleet issuance model.
• Pilot time ≥ 30 days
• ≥ 10 drivers supported by assigned vehicles
• ≥ 10 vehicles altered (Fleet-Sharing programs only)
• Vehicles used to support varied tasks (not all used on a recurring route)
Table 1. Pilot Accepted Minimum Metrics. Pilot
No.
Pilot Year
(date) Share Fleet Share Car- days ≥ 30 drivers ≥ 10 vehicles ≥ 10 vehicle Varied use 1A NAVFAC 2009
(Norfolk, VA) X 6 mo (400) Yes (33) Yes X 1B NAVFAC 2011
(Bangor, WA) X 5 mo (300) Yes (13) Yes X 1C NAVFAC 2011 (Great Lakes, IL) X 5 mo Yes (150) (20) Yes X 2 GSA 2011 (San
Diego, CA) X 6 mo (203) Yes (20) Yes X 3 GSA 2014
(Chicago, IL) X 2 mo (40) Yes No (3) X
4A GSA 2015 (Wash DC) X 6 mo (17) Yes NA X 4B GSA 2015 (Providence, RI) X 4 mo No (2) NA X
A. 2009-2011 NAVFAC FLEET SHARE PILOT
1. Pilot Summary
Cook, Ahn, & Rotty (2013) analyzed a three-year pilot program testing a fleet-sharing model. The pilot was a coordinated effort by NAVFAC Engineering and
Expeditionary Warfare Center (EXWC) to test and demonstrate a vehicle fleet management suite as an alternative to manual reservation and assignment. INVERS Mobility Solutions Inc. was contracted by EXWC to install a varied level of hardware and software in GSA or Navy owned passenger vehicles. The locations selected for testing were three NAVFAC Mid-Atlantic (MIDLANT) Engineering Command (ENGCOM) Facility Engineering Commands (FEC), each in different places in the contiguous United States (CONUS). Respective regions received a vehicle access/ ignition key management and vehicle reservation system, but the level of vehicle installation varied. The following metrics were evaluated by Cook et al. based on pilot performance.
• Connectivity: Remote connectivity between the key management units, the vehicle computers, and the web server.
• Durability: Measure of hardware resistance to failure throughout the pilot demonstration.
• Installation: Ability to install equipment throughout the three regions.
• Key management: Ability to track and manage keys using IT solutions.
• Reliability: Measure of system connectivity throughout the pilot demonstration.
• Reporting: Database reporting capability (billing/reports/ utilization)
• Value added: Overall results of Information Technology (IT) solution for fleet management and whether it allowed a fleet reduction or a utilization increase.
• Web-access: System remote accessibility
2. Pilot 1A. Norfolk, VA, Details
NAVFAC MIDLANT on Naval Station (NAVSTA) Norfolk maintains a combination of 33 GSA- and Navy-owned vehicles. The Navy vehicles received the onboard computer systems but the GSA vehicles only received a non-operative placebo unit. Prior to the pilot, the facility reported excessive idle time, and billing and timing
conflicts. At the conclusion of the six month pilot, Cook et al. (2013) reported the efficiencies gained in vehicle utilization were so high, they reduced the fleet size by 27% (9 vehicles) and further reduced fuel and rental costs by replacing their fleet minivans with sedans. The command ultimately opted to retain the system at the completion of the pilot and established a contract to expand to other locations within the region.
3. Pilot 1B. Bangor, WA Details
NAVFAC NORTHWEST on Naval Base Kitsap (NBK) maintains a small fleet of 13 GSA vehicles. Although the shore base management-system hardware was used, none of the vehicles received the onboard computer systems. Prior to the pilot, the facility reported an insufficient number of vehicles to meet the user’s needs, a lack of a formal reservation process, and a lack of accountability. At the conclusion of the five month pilot, the data analysis supported an increase in the fleet size from 13 to 15 and the command opted to retain the utilized system components at the completion of the pilot due to the user efficiencies gained (Cook et al., 2013).
4. Pilot 1C. Great Lakes, IL Details
NAVFAC Mid-Western (MIDWEST) on NAVSTA Great Lakes maintains a fleet of 20 Navy owned vehicles between two buildings, all of which received the onboard computer systems. Prior to the pilot, the facility reported sufficient vehicles and a self-checkout document with openly accessible keys. At the conclusion of the five month pilot, the efficiencies gained in vehicle utilization supported a fleet reduction of 30%. Additionally, the command opted to retain the system at the completion of the pilot and expand the system usage within the region (Cook et al., 2013).
5. Costs and Assumptions
Table 2 summarizes the potential costs saving that were obtained by reducing the fleet size based on the utilization observed during the pilot study. Bangor is not listed due to the absence of vehicle installed hardware. The table savings are based on the following assumptions.
• Monthly vehicle cost (2013) of $210 based on composite passenger prices.
• Monthly service charges: Navy Web Server $170, vehicle installation $20 each, key cabinets $80 each.
• No change in administrative labor for vehicle management Table 2. Estimated Cost Savings of Fleet Reduction.
Adapted from Cook et al. (2013) Fleet
Management Baseline Fleet Adjusted Fleet Differential Cost (Baseline-Adjusted)1 Monthly Car-Sharing Fees2 Monthly Savings NAVSTA Norfolk 33 24 $2,160 $810 $1,350 NAVSTA Great Lakes 20 13 $1,680 $629 $1,051 NAVSTA Bangor, WA 13 15 ($480) $550 (1,030) Total 53 37 $3,360 $1,989 $1,371 6. Challenges
A comparative analysis between each pilot presents some challenges when common requirements are not used. The following list details some of the issues that complicate the comparison:
• The pilot used the commercial servers to manage the data for users and vehicle reservations, contrary to the new Navy Information Assurance (IA) policy, which now requires Navy data to be hosted on contracted Navy servers.
• A process for preventing users from holding keys past the vehicle usage was not used.
• The study did not include a solution for providing vehicle fuel. Presently, commands are issued their own fuel cards to be used for the command assigned vehicle.
B. 2011 GSA FLEET SHARE PILOT
1. Pilot Summary
In this pilot report, Serafino (2011) analyzed a GSA-coordinated pilot contract that was awarded to Zipcar based on a request for proposals. The pilot was located at the Naval Facilities Engineering Command Southwest (NAVFAC SW) in San Diego, CA. It was active for six months with an additional month for setup and training. NAVFAC SW maintained a fleet of 20 Navy owned vehicles. Each vehicle received a telematics unit for GPS tracking and management server connectivity, and an RFID card reader that allowed vehicle access. Each driver was assigned a personal RFID card and training for program use.
The primary goals were to:
• Determine the feasibility of Fleet-Sharing with telematics and Radio-frequency Identification (RFID) cards for vehicle access. • Determine capability of users to use a web-based self-service
reservation system.
A secondary goal upon data collection was to identify a course of action to achieve a utilization of 60–65% during a 10 hour business day.
2. Assumptions and Costs
Although no specific assumptions or contract costs were published in Serafino’s report, some approximate data can be extrapolated from the percentage improvements provided.
• Business hours are defined as Monday-Friday, 0730 to 1730 for purposes of utilization calculations.
• Reservation averages in shared fleets outside the pilot are between 5 and 20 miles per trip.
3. Challenges
Many of the vehicles used in this pilot are driven over 300 miles during a single reservation based on mission requirements. This extended range creates a difficult comparison to the users in Jacksonville, which are estimated to be far lower but without installed telematics, cannot be verified.
4. Results
Although the San Diego Pilot was a small sample and included most personnel with a similar mission, it was met with a high degree of user popularity and provided usable data for our comparison CBA. Specifically targeting our primary analysis question, Serafino concluded that reducing unused time by 40% (2,000 hours) and removing 1–4 vehicles from the fleet could help achieve the secondary goal (achieve 60– 65% utilization) while reducing fleet size. Serafino (2011) reported additional data analysis indicating:
• Both primary goals were met with success. The telematics and RFID readers performed as designed and the users were adept at using the web-based reservation system.
• The fleet-sharing pilot averaged 52% utilization during regular business hours. Due to the nature of the mission (longer range, longer trip duration), identifying a target usage may be less than in the Jacksonville area.
• Unused reservation time, or time at the beginning and end of the reservation where the vehicle is reserved but idle, accounted for over 25% (over 5,000 hours) of all reservations.
• Reservation No-Shows accounted for over 750 hours (over 100 No-Shows in total) of reservation time, however improved policy and training can reduce the No-Show time.
A post-pilot survey was provided to the users regarding the fleet-sharing program. On average, over 85% of the users that responded felt the fleet-sharing model was easier, faster, and more flexible (obtaining the right vehicle for the mission) than the NAVFAC fleet model in use prior to the pilot (Serafino, 2011).
C. 2014 GSA FLEET SHARE PILOT
In 2015, General Services Administration, released a report analyzing a pilot program at the Federal Garage in downtown Chicago, IL. The pilot contract was awarded to Local Motion (now a subsidiary of ZipCar) in 2014 based on a small-business set aside invitation for bids to provide a full functionality mobile application based platform. The GSA vehicles were scheduled to receive onboard autonomous computer systems while the rest of the facility located system would be managed by Local Motion Inc. Although the initial contract was for a 10-vehicle fleet, technical difficulties with vehicle installation prevented full installation. Additionally, a maximum of three cars were used during the pilot because the contractor defaulted on the contract only two months after vehicle usage commenced (and just two weeks before a planned hardware installation on 10 more cars). Therefore, the low number of cars used and the short duration rendered this pilot insufficient for a full comparison.
D. 2015 GSA CAR-SHARING PILOT (AIKEN, 2016)
1. Pilot Summary
In the report by Aiken (2016), he investigates a coordinated effort by the GSA Office of Travel and Transportation (T&T) to test and demonstrate multiple commercial car-sharing/hourly rental models as an alternative to manual reservation and assignment. The GSA T&T awarded a Blanket Purchase Agreement (BPA) to four commercial car-sharing companies in four CONUS cities. Of those, only the GSA Regional Office Building (ROB) in Washington, DC, was identified as a potential candidate for the study. Additionally, the Department of Transportation (DOT) Federal Highway Administration (FHWA), Rhode Island Division, which was not one of the selected BPA options, engaged GSA about testing a car-sharing model and was accepted.
It is important to acknowledge the major difference between this case study and the previous pilot studies. This pilot studied a direct replacement of a GSA owned fleet using commercial car-sharing companies in a pre-established car-sharing market instead of implementing fleet management hardware/software into a pre-existing fleet.
The remote vehicle reservation and on-site vehicle use operations for both locations are similar. Reservations are made online via computer or mobile application and access is given to the vehicle if the associated membership card is present at the time of reservations. The keys and a fuel card are located inside the vehicle. The companies have standard hourly usage fees and additional fees for returning the vehicle late, with low fuel, dirty, etc.)
2. Pilot 4B. Providence, RI, Details
The DOT FHWA RI only has one fleet vehicle assigned and 11 registered drivers. A contract was awarded to Zipcar to support the registered users for the duration of the pilot study. Unfortunately, the DOT office announced that use of the Zipcar vehicles was not mandatory and therefore, only four users registered with Zipcar, one of which never activated the member card and another never made a reservation. Therefore, the low number of actual users renders this pilot insufficient for a full comparison.
3. Pilot 4A. Washington, DC, Details
The ROB in DC designated 17 users to register and use the car-sharing platform instead of the fleet vehicles (which were not impacted by the study). The Office of Administrative Services subsequently revoked those users’ motor pool access in support of the pilot study. Enterprise was selected as the vendor and awarded a six-month contract to provide support services to the selected users. The vehicles did not have telematics to report actual usage so the data provided is based on the web based reservation system.
4. Costs, Assumptions, and Usable Metrics
The DC area is difficult to relate to NAS Jacksonville (JAX) due to the excessive traffic density, however the averages reported by Aiken (2016) may still be applied to our model in lieu of available telematics data.
• Average trip: 39 miles
• Average reservations: 6.5 hours
• Average use cost: 36.50 (not including fees)
Table 3 lists the per hour charges and rental time requirements as well as vehicle availability.
Table 3. Hourly Car-Sharing Costs versus GSA Fleet Lease. Adapted from Aiken (2016)
Hourly Car-sharing GSA Fleet Lease Average Hourly Rate (economy
sedan) $8.14 (includes fuel) N/A
Average Daily Rate (economy sedan) $55 (Unlimited mileage) $5.56 *(based on $169/mo and $0.15/mi)
Vehicle Types Sedans, SUVs All GSA vehicles
Reservation min lead time 1 Hour Days to weeks (varies based on availability)
Rental extension availability >15 min of scheduled
reservation end time (pending availability)
Open ended reservation (no time limit)
* Based on compact sedan rates
5. Results
Table 4 breaks down the charges that the ROB incurred with Enterprise versus what the cost would have been had the GSA fleet been used. It is important to note that though the average trip distance is 39 miles, which would be significantly lower in Jacksonville, the number of trips taken in Jacksonville would also be higher based on a higher demand and therefore a higher utilization.
Table 4. Enterprise Car Share versus GSA Fleet Lease. Source: Aiken (2016)
Enterprise Car-Share GSA Fleet Lease
Rental/Lease Rate $7.00/hr $169/mo
Mileage Charges (2,351 miles) N/A $0.153/mile Total Costs (minus fees) $2,193.25 $1,373.70 Average Monthly Cost (minus fees) $365.54 $228.95 Total Costs (including fees) $2,642.25 $1,373.70 Average Monthly Cost (including fees) $440.38 $228.95
The fees listed on the total costs row in Table 4 for Enterprise are a result of user agreement violations. These fees are relatively standard for car-sharing companies and include the following (Aiken, 2016):
• Late returns
• Low fuel returns (less than1/4 tank) • Returning vehicle dirty
• Returning vehicle to the wrong location
• Losing vehicle key or failing to place key in the car upon return • Losing membership card
• Unauthorized driver operating vehicle • Unreported vehicle damage/theft
Additionally, though not considered a violation fee, reservation no-shows accounted for almost 100 hours (23%) of reservation time. Commercial car-sharing vendors charge for time reserved not time used.
Some of the Aiken’s findings were non-quantitative and difficult to apply to a Cost-Benefit Analysis (CBA) (Aiken, 2016). Some of them are listed here.
• Reservations can be made up to 15 minutes prior to requirement. • Reservations can be extended ad-hoc if the vehicle does not
III.
METHODOLOGY
A. COST-BENEFIT ANALYSIS (CBA)
A CBA identifies, quantifies, and monetizes the variables that affect the selected stakeholders in every facet of a selected project to facilitate rational decision making by providing a data driven recommendation. The selected CBA method will be an Ex Ante CBA (prior to execution) to provide a recommendation for decision making before an alternative is selected. The CBA nine-step method in Table 5 provides the framework for constructing the analysis and making a recommendation.
Table 5. Major Steps in a CBA. 1) Specify the Set of Alternatives
2) Determine Standing
3) Catalog of Impacts and Measurement Indicator Selection 4) Quantitative Impact Prediction Over Project Life
5) Impact Monetization 6) Calculate Present Value 7) Calculate Net Present Value 8) Perform a Sensitivity Analysis 9) Make a Recommendation
Source: Boardman, Greenberg, Vining, & Weimer (2011)
B. OPTIMUM FLEET SIZE
The primary impetus behind the investigation of vehicle-sharing options at Naval Air Station (NAS) Jacksonville is the intuitive understanding that the majority of long-term lease (B-Pool) fleet assets are significantly underutilized by commands and the knowledge that costs savings can be achieved by right sizing the vehicle fleet to improve per unit vehicle utilization. The reduction in B-Pool vehicle inventory represents the single most important monetized benefit of adopting a vehicle-sharing program, and as such, the calculations adopted to determine the recommended fleet size will have an enormous impact on the outcome of this cost-benefit analysis.
The first step in optimizing the fleet size is determining the total number of vehicles in Jacksonville that would be eligible for vehicle sharing. Some vehicles, because of mission requirements and others because of location or vehicle type are not good candidates for a vehicle-sharing program. The raw data provided by Naval Facilities (NAVFAC) from their MAXIMO database management system includes 411 individual vehicles managed by the NAVFAC operation at NAS Jacksonville (S. Kurup, personal communication, 13 September 2016), of which only 121 of those vehicles were determined to be eligible for the car-sharing project, per Table 6.
Table 6. Determination of Vehicle Eligibility for Vehicle Sharing
Total Fleet Size 411
Less: Vehicles Pending Sale 27
Less: Low Speed Vehicles 65
Less: Buses 9
Less: Commercial Vans 24
Less: Pickup Trucks, 4x4 19
Less: Commercial Trucks 40
Less: Public Safety 29
Less: Public Works 43
Less: Navy Band 6
Less: Offbase Vehicles 27
Less: Duplicate Tag # 1
Vehicle Population Eligible for Car Share 121
Of the 411 total vehicles, 29% of them were removed from the sharing population for the following reasons:
• 27 vehicles were removed from consideration because they are listed as pending sale, which means that NAVFAC has already identified these assets as excess.
• 65 low speed vehicles were removed from the data under consideration because this type of vehicle is not eligible for car-sharing.
• Nine buses, 24 commercial vans, 40 commercial trucks and 19 four-wheel drive pickup trucks were similarly removed because these are specialized vehicle types, which do not fit into the vehicle-sharing model. The commercial vans include panel vans utilized by maintenance personnel and five-ton cargo vans utilized by base personnel to move bulk cargo and equipment. The commercial trucks include large stake trucks used to move cargo and equipment around base as well as fuel trucks and tractor trailers essential to airfield operations.
• 29 public safety vehicles utilized by the base police force, security department and fire department, as well as the Commanding Officer (CO) and Executive Officer (XO) command vehicles, were also excluded because these vehicles are mission essential for these operations.
• Six passenger vans utilized by the Navy Southeast Region Band were also excluded because band members travel all over the region to play at concerts, changes of command, and other official Navy events. The longer distances and times associated with these trips make the vehicles poor candidates for vehicle sharing.
• 43 public works vehicles were excluded because these are work vehicles that are used by individuals and commands on a daily basis to carry out maintenance, hazardous material (HAZMAT) and inspection operations on base.
• 27 additional vehicles were removed because they were listed as being located at various locations off base and in some cases outside of the Jacksonville geographic area, such as Puerto Rico, Altoona and Cecil Field. Although these vehicles are managed by the NAVFAC operation at NAS JAX, they fall outside of the geographic radius of the car-sharing project and were therefore deemed ineligible. A small subset of the 27 vehicles had no location given so it was impossible to determine if they were located off base or on base. Because of the uncertainty, these vehicles were removed from consideration.
• Finally, one vehicle was listed twice in the MAXIMO extract and the duplicate entry was removed from the list of eligible vehicles.
The population of vehicles at NAS Jacksonville determined to be eligible for a vehicle-sharing program was 121. Table 7 displays the breakdown of the eligible vehicles including numbers, types, and applicable Navy Equipment Codes (EC).
Table 7. Vehicles Eligible for Car-Sharing at NAS Jacksonville.
Vehicle Category Navy EC Qty
Truck, Pickup Compact 4x2 0319 17
Truck, Pickup 4x2, Crew Cab 0327 32
Truck, 1/2T Pickup 4x2 0313 7
Truck, Sport Utility, Commercial, 4x2 Midsize 0308 2
Truck, Van, 7 Pass, Compact 0330-08 24
Truck, Van, 8 Pass 0330-01 5
Truck, Van, 12 Pass 0330-03 12
Truck, Van, 15 Pass 0330-05 12
Sedan, Sub Compact 0103 2
Sedan, Compact 0104 8
Total: 121
The second step in the process is determining whether the vehicle fleet in Jacksonville is actually underutilized by calculating the current utilization of the B-Pool assets at NAS Jacksonville. The actual utilization levels must be estimated because telematics has not yet been installed on NAVFAC’s fleet in Jacksonville to record this data. The utilization of a vehicle includes the time it is physically used to drive from the point of origin to a destination, the idle time at that destination where the vehicle is not available to another driver, and the time that it is used to return to the point of origin. NAVFAC tracks the average annual miles that a vehicle is driven, but they do not record the number of hours that each vehicle is in use, so an estimate will be made to convert miles driven into hours utilized. Table 8 presents data from the fleet-sharing pilot conducted by GSA at Naval Station (NAVSTA) San Diego, CA and the car-sharing pilot conducted by GSA at their facilities in Washington, DC.
Table 8. Miles Driven to Utilization Conversion.
Pilot San Diego, CA Washington, DC
Hours 20,500 397
Miles 190,000 2,351
Hours/Mile 0.11 0.17
Avg. Hours/Mile 0.14
Adapted from Aiken (2016) and Serafino (2011)
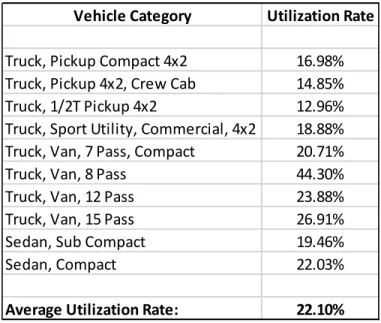
The average number of hours per mile driven in the San Diego pilot study was .11 Hours/Mile and the average number of hours per mile driven in the Washington pilot study was .17 Hours/Mile. The average of these two calculations is .14 Hours/Mile. Although vehicle utilization at NAS Jacksonville is expected to more closely reflect the conditions during the pilot study in San Diego, CA than the pilot study in Washington, DC, due to the limited amount of existing data, the average of the two calculations was selected as a conservative estimate. This average (0.14 hours/mile) will be used as the factor in this CBA to convert miles driven into utilization. There are on average 21 workdays in a given month, and eight working hours in a given workday. This equates to 2016 working hours in a fiscal year, which is the factor that will be used to convert utilization hours to a utilization percentage or rate. For the remainder of this CBA, 2016 working hours will be used as the average number of working hours in a fiscal year. Table 9 displays the calculated utilization rate by platform for the NAS Jacksonville fleet. The overall utilization rate over the eight-hour workday is quite low at 22.10%. This equates to an average daily utilization rate of 7.37% based on a 24-hour day, which is the car-sharing industry standard.
Table 9. Current Utilization of Eligible Vehicles at NAS Jacksonville.
Vehicle Category Utilization Rate
Truck, Pickup Compact 4x2 16.98% Truck, Pickup 4x2, Crew Cab 14.85% Truck, 1/2T Pickup 4x2 12.96% Truck, Sport Utility, Commercial, 4x2 18.88% Truck, Van, 7 Pass, Compact 20.71%
Truck, Van, 8 Pass 44.30%
Truck, Van, 12 Pass 23.88% Truck, Van, 15 Pass 26.91%
Sedan, Sub Compact 19.46%
Sedan, Compact 22.03%
Average Utilization Rate: 22.10%
The next step is determining the desired utilization level for the motor vehicle fleet at NAS Jacksonville. According to a 2016 study on the future of car-sharing, the Boston Consulting Group estimates that by 2021, the typical car-sharing vehicle “will run at a utilization rate of 15%, which allows time for fueling maintenance, and repositioning” (Bert, Collie, Gerrits, & Xu, 2016). They also argue that while 15% may seem low it is in the best interest of car-sharing service providers to “maintain what may sound like a lower-than-expected usage rate in order to ensure that vehicles are available during peak periods” (Bert et al., 2016, p.10). In the case of NAS Jacksonville, lack of vehicle availability when needed would negatively affect both customer satisfaction and mission accomplishment.
A 15% utilization rate over a 24-hour period equates to a 45% utilization rate over an eight hour period. Therefore, a 45% utilization rate over the course of an eight hour working day, which is considered the peak period at NAS Jacksonville, is the target selected for this CBA. An increase in utilization from 22.1% to 45% effectively doubles the vehicle utilization rate at NAS Jacksonville, which is an achievable goal that balances NAVFAC’s desire to both significantly increase vehicle utilization and shrink the government vehicle fleet while maintaining high levels of customer satisfaction. It is also
vehicle-sharing pilot conducted at NAVSTA San Diego in 2010 and 2011, which was the only pilot to report utilization results (Serafino, 2011).
The eight-hour workday is also a conservative estimate. In reality the working day at most naval facilities is well in excess of eight hours, especially for military and other duty personnel. The actual utilization over a 24-hour day will certainly exceed 15% if 45% utilization is maintained over the assessed eight hour peak period.
A 45% utilization rate over an eight hour day equates to a target utilization of 3.6 hours per vehicle per work day or 907.2 hours per vehicle per year. Using the average annual mileage for NAS Jacksonville and the previously derived factor of 0.14 hours/mile, the required number of vehicles at NAS Jacksonville, per Table 10, is 54. This is significantly less than the current fleet size of 121 vehicles.
Table 10. Recommended Number of Vehicles at NAS Jacksonville. Vehicle Category Average Miles
(Annual) Average Hours/Mile Average Total Hours (Annual) Desired Utilization (%) Desired Utilization (Hours/Day) Desired Utilization (Hours/Year) Required Vehicles Truck, Pickup Compact 4x2 41,574 0.14 5,820 45% 3.6 907.2 6 Truck, Pickup 4x2, Crew Cab 68,448 0.14 9,583 45% 3.6 907.2 11 Truck, 1/2T Pickup 4x2 13,069 0.14 1,830 45% 3.6 907.2 2 Truck, Sport Utility, Commercial, 4x2 5,437 0.14 761 45% 3.6 907.2 1 Truck, Van, 7 Pass, Compact 71,587 0.14 10,022 45% 3.6 907.2 11 Truck, Van, 8 Pass 31,897 0.14 4,466 45% 3.6 907.2 5 Truck, Van, 12 Pass 41,267 0.14 5,777 45% 3.6 907.2 6 Truck, Van, 15 Pass 46,497 0.14 6,510 45% 3.6 907.2 7 Sedan, Sub Compact 5,605 0.14 785 45% 3.6 907.2 1 Sedan, Compact 25,377 0.14 3,553 45% 3.6 907.2 4
Total: 350,758 49,106 54
C. SUMMARY
By implementing a vehicle-sharing operation at NAS Jacksonville, target per vehicle utilization can be increased from 22.1% to the target utilization rate of 45%, with a 16.3% (67 out of the 411 currently in use) overall reduction in fleet size. A completed analysis of the vehicle cost and use data provided by NAVFAC, GSA, and other public domains will result in an apples-to-apples comparison of Net Present Value (NPV)
IV.
COST-BENEFIT ANALYSIS
A. SPECIFY SET OF ALTERNATIVES
This study is under the guidance of Naval Facilities Engineering Command (NAVFAC), and therefore will focus on the alternative options that are most relevant to current technology and commercial availability. The Cost-Benefit Analysis (CBA) will use the steps listed in Chapter III to compare the net social benefits of the specified alternatives to the net social benefits of the status quo (in this case the existing General Services Administration (GSA) Fleet Management).
1. Status Quo
GSA purchases a wide range of vehicles from commercial trucks and vans to battery-powered vehicles. GSA then leases the vehicles to various government entities, such as the Department of Defense (DOD). Within the Navy, NAVFAC is the primary management entity responsible for issuing, maintaining, and returning the leased vehicles as required. NAVFAC has two primary levels of vehicle issue management.
“B-Pool” Long-Term Rentals (continuous assignments)
“C-Pool” Short-Term Rentals (daily assignments leased as needed). Any portion of a day leased counts as a full day. Vehicles are limited to 100 miles or seven gallons of fuel per day.
Per NAVFAC guidelines, B-Pool vehicle assets are the sole focus of this cost-benefit analysis. The NAVFAC Base Support Vehicles & Equipment (BSVE) Department assigns vehicles after a command has established an initial Inventory Objective (IO). Additionally, each command will conduct an annual Vehicle Allocation Methodology (VAM) as required by a presidential memorandum by reporting vehicle information in the Fleet Management Information System (FMIS) to ensure only required vehicles are being maintained and leased. Operational differences arise between shore commands and operational commands only in the frequency with which the vehicles are assigned.
Due to the process flow for B-Pool assets existing in a steady state, it is possible to accurately predict total vehicle fleet number requirements through the identification of flow rates and inventory stores within the process flow. Actual customer demand for the status quo is assessed though the current vehicle inventories assigned to supported tenants. Customer demand for the proposed commercial car-sharing and fleet-sharing alternatives are assessed through the cost-benefit analysis and the assumptions contained therein. For possible inventory stores not related to vehicles under customer assignment, such as the various categories of maintenance, process capacity is such that inflows cause no backlog. It is assumed that any future alternative will scale current processes to maintain this lack of inventory scores. This is the case throughout all of the alternatives with the exception of the unassigned vehicle lot for the status quo, which is not present in the other options.
a. Operational Command Lease Process
Although operational commands experience periods in which no vehicles are required due to deployment or training, the IO is not required every time. Due to the nature of Naval Air Station (NAS) Jacksonville tenant commands and their assigned missions, this report will focus primarily on the shore command process. Further analysis in support of operational commands is listed in Chapter V for future research.
b. Shore Command Lease Process
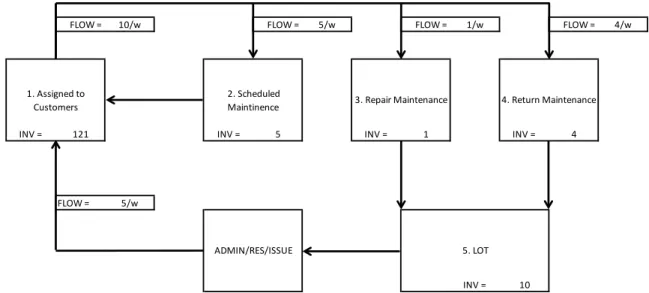
Shore commands retain a relatively static workforce and mission and subsequently a static vehicle demand throughout the year. Figure 1 provides a detailed process model for how vehicles are issued, maintained, and returned with the current shore command leasing process. Inventory flows are given in cars per week and the values are provided as examples only.
FLOW = 10/w FLOW = 5/w FLOW = 1/w FLOW = 4/w
INV = 121 INV = 5 INV = 1 INV = 4
FLOW = 5/w
INV = 10
4. Return Maintenance 1. Assigned to
Customers 2. Scheduled Maintinence 3. Repair Maintenance
5. LOT ADMIN/RES/ISSUE
Figure 1. Status Quo Process Flow for B-Pool
The current state of the Naval Air Station vehicle fleet is based on a legacy system centered on long-term assignments to tenant commands with near constant demand over a fiscal year. With the exception of rare tenant relocations or drastic increases or reductions in workforces, NAVFAC and its local vehicle program administrators can expect predictable usage over long periods.
The process flow chart for the status flow includes five activities, two of which regularly function as inventory buffers. The bulk of the vehicle inventory is maintained in the Assigned to Customers (#1) activity. This represents vehicles currently assigned to tenant commands in accordance with their allotment as per their IO or VAM. During a fiscal year, most vehicles will remain assigned to a command except for scheduled maintenance.
There are three identified outflows from Assigned to Customers that operate independently but concurrently. The first is Scheduled Maintenance (#2). This covers all the routine maintenance a vehicle may require. While a vehicle trip log is required to be maintained by instruction, the program is ineffective. There is no easy method to have mileage reported to NAVFAC outside of when they flow through an activity they control (i.e., not while assigned). For this reason, maintenance is scheduled based on set periods,
in this case semiannually. Vehicles undergoing scheduled maintenance are returned directly to their assigned commands.
The next concurrent outflow is Repair Maintenance (#3). This encompasses all unforeseen maintenance such as normal wear and tear, part failures, and vehicle accidents. While not a scheduled event, the average frequency can be used. Being nonstandard in nature repair times vary wildly.
The last concurrent activity is Return Maintenance (#4). Vehicles returned from assignment permanently receive a standard inspection and servicing before being made available for future assignments. Generally, there is no maintenance action taken. If a vehicle is approaching a scheduled maintenance window, it may be done early while in this activity. Rarely there will be some issue discovered during inspection that may require further investigation and/or redress from the returning command. This may cause a vehicle to be maintained in this activity long-term creating an inventory buffer.
Vehicles in the Repair Maintenance and Return Maintenance activities are returned to the unassigned inventory pool after completion. Vehicles returned to the unassigned inventory are placed in the activity Lot. Here vehicles are maintained in ready status for assignment and represents one of the steady inventory buffers in the process flow chart. Vehicles are issued from the lot via the Admin/Res/Issue activity from which they are transitioned to the Assigned to Customer activity. The process of issuing vehicles in negligible.
2. Alternative I: Commercial Car-Sharing
There is a multitude of commercial vendors in today’s car-sharing market and the number is growing at a steady rate. Some of the major auto manufacturers are getting their hands into the sharing market, including Ford, GM, and Fiat. The first alternative selected for analysis is the use of a commercial contracted vendor. The shared vehicles would be a direct replacement for the fleet operation currently in use (there would no longer be a B-pool). The administrative and management profile would be dynamically different as well. Maintenance would be contracted to a vendor and the administrative
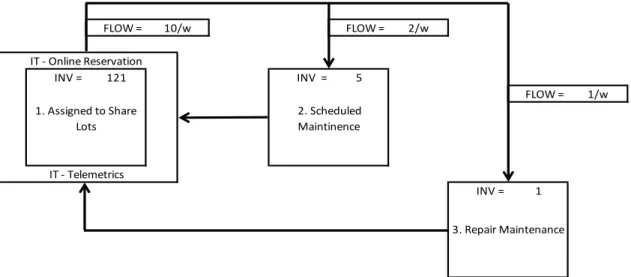
responsibility would be shared with a civilian company. Figure 2 provides a process flow diagram that illustrates the simplicity of using a commercial vendor on base.
FLOW = FLOW = 2/w INV = 121 INV = 5 FLOW = 1/w INV = 1 3. Repair Maintenance 10/w IT - Online Reservation IT - Telemetrics 1. Assigned to Share Lots 2. Scheduled Maintinence
Figure 2. Commercial Car-Sharing Process Flow
From a vehicle pool standpoint, the process flow of a commercial car-sharing model has significant differences from the legacy process. The most drastic difference is there is no longer a Lot to stock unused vehicles for future assignments, as long-term reservations have been eliminated from the business model. The car-sharing model makes all vehicles available for immediate use in multiple lots based on demand signals from the supported tenant commands. All vehicles are located in these lots with the exceptions of those that are in use or at a maintenance activity. Essentially the Lot (Figure 1) exists concurrently with Assigned to Customers (Figure1), creating the combined inventory buffer and activity Assigned to Share Lots (Figure 2).
The next major difference is that there will no longer be a physical Admin/Res/Issue activity. Instead, an online IT application that will run concurrently with Assigned to Share Lots. While the application can support long lead reservations, it is equally able to support walk up reservations removing the previous need for paper or email reservations, vehicle transportation from or pick up at the Lot, as well as handling all of the accountability and accounting functions transparent to administrators and users.
Finally, there will no longer be a Return Maintenance activity, as these assets will no longer support long-term assignments. At the end of each short-term reservation, vehicles are returned directly to their lot and made available to other users. Maintenance issues previously screened for via the return process will now be reported by the next user to find unsatisfactory conditions (whether justified general issues or those attributable to the previous user that may require investigation) and treated as repair maintenance. This is made possible by the inclusion of instantaneous reporting options in the reservation application which will also handle check out and check in requirements outside the scope of the simple fob activation or automatic key box key issue.
In this option, all of the activities of the process can be contracted out to commercial entities, either in whole or in part, and the IT solutions would be leased from and operated by contractors. Vehicles would also be leased from either the same contractors or another third party.
3. Alternative II: Fleet-Sharing Software
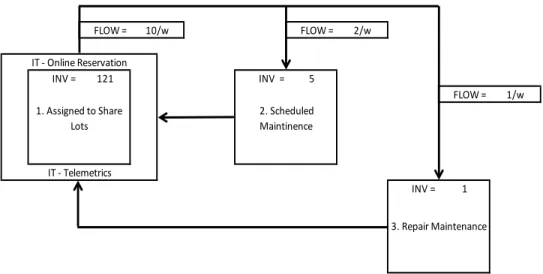
The implementation of a commercial fleet-sharing platform is the second alternative. A fleet-sharing platform implements software and hardware for administrative and control functions while the fleet vehicles remain the responsibility of the owning/leasing agency. Figure 3 provides a process flow diagram that illustrates the process simplification gained by implementing fleet-sharing software/hardware into the existing GSA owed/leased vehicles.
FLOW = FLOW = 2/w INV = 121 INV = 5 FLOW = 1/w INV = 1 3. Repair Maintenance 10/w IT - Online Reservation IT - Telemetrics 1. Assigned to Share
Lots 2. Scheduled Maintinence
Figure 3. Fleet-Sharing Process Flow
The fleet-sharing option mimics the commercial car-sharing option. The difference is that the activities are performed by government employees utilizing government facilities and resources instead of contracted employees and that the vehicles would be government owned.
B. DECIDE WHICH COSTS AND BENEFITS COUNT
The next step in the cost-benefit analysis (CBA) framework is determining feasibility and relevancy for all costs and benefits that impact (or could impact) the public good. This CBA will be conducted using a federal government perspective and standing (whose costs and benefits will be counted) will be assigned pursuant to this perspective.
One major challenge is to analyze the data objectively without applying a political or biased lens to the CBA. The Guardian Perspective is a position, or lens, easily overlooked when viewing data from a federal financial employee viewpoint (Boardman, Greenberg, Vining, & Weimer, 2011). The Guardian tends to see the project from a simple financial viewpoint where costs equals money spent and benefits equals revenue. For financial decision making, the Guardian Perspective may seem to be beneficial on the surface, however there are significant downsides to it such as: