04 August 2020
Repository ISTITUZIONALE
SmartBike: an IoT Crowd Sensing Platform for Monitoring City Air Pollution / CORNO, Fulvio; MONTANARO, TEODORO; Migliore, Carmelo; Castrogiovanni, Pino. - In: INTERNATIONAL JOURNAL OF ELECTRICAL AND COMPUTER ENGINEERING. - ISSN 2088-8708. - ELETTRONICO. - 7:6(2017), pp. 3602-3612.
Original
SmartBike: an IoT Crowd Sensing Platform for Monitoring City Air Pollution
Publisher: Published DOI:10.11591/ijece.v7i6.pp3602-3612 Terms of use: openAccess Publisher copyright
(Article begins on next page)
This article is made available under terms and conditions as specified in the corresponding bibliographic description in the repository
Availability:
This version is available at: 11583/2679363 since: 2017-11-06T10:10:03Z
International Journal of Electrical and Computer Engineering (IJECE)
Vol. 7, No. 6, December 2017, pp. 1 – 10
ISSN: 2088-8708 1
Institute of Advanced Engineering and Science
w w w . i a e s j o u r n a l . c o m
SmartBike: an IoT Crowd Sensing Platform for Monitoring
City Air Pollution
Fulvio Corno*, Teodoro Montanaro*, Carmelo Migliore*, and Pino Castrogiovanni**
*Department of Control and Computer Engineering, Politecnico di Torino **
SWARM Joint Open Lab, TIM, Torino, Italy
Article Info Article history: Received September 7, 2017 Revised Accepted Keyword: Internet of Things Smart City Crowd Sensing bike pollution location ABSTRACT
In recent years, the Smart City concept is emerging as a way to increase efficiency, reduce costs, and improve the overall quality of citizen life. The rise of Smart City solutions is encouraged by the increasing availability of Internet of Things (IoT) devices and crowd sensing technologies. This paper presents an IoT Crowd Sensing platform that offers a set of services to citizens by exploiting a network of bicycles as IoT probes. Based on a survey conducted to identify the most interesting bike-enabled services, the SmartBike plat-form provides: real time remote geo-location of users’ bikes, anti-theft service, inplat-formation about traveled route, and air pollution monitoring. The proposed SmartBike platform is composed of three main components: the SmartBike mobile sensors for data collection in-stalled on the bicycle; the end-user devices implementing the user interface for geo-location and anti-theft; and the SmartBike central servers for storing and processing detected data and providing a web interface for data visualization. The suitability of the platform was evaluated through the implementation of an initial prototype. Results demonstrate that the proposed SmartBike platform is able to provide the stated services, and, in addition, that the accuracy of the acquired air quality measurements is compatible with the one provided by the official environmental monitoring system of the city of Turin. The described platform will be adopted within a project promoted by the city of Turin, that aims at helping people making their mobility behavior more sustainable.
Copyrightc 2017 Institute of Advanced Engineering and Science. All rights reserved.
Corresponding Author:
Teodoro Montanaro Politecnico di Torino
Corso Duca degli Abruzzi, 24 - Torino, Italy 10129 +390110907191
teodoro.montanaro@polito.it
1. INTRODUCTION
Recently, the concept of Smart City has emerged as a way to “exploit the Information and Communication Technologies (ICT) in making better use of the public resources, increase the quality of services offered to the citizens and, in turn, the quality of life in urban areas, while reducing the operational costs of the public administrations” [1]. In Smart Cities, a broad network of IoT sensors (such as smartphones, smart vehicles, or surveillance cameras) is spread across the city with the aim of collecting data to foster the development of innovative applications for citizens, companies, and public administrations [2]. One of the ways used to enhance the contribution of IoT sensors to Smart Cities is by exploiting crowd sensing solutions. Crowd sensing is an alternative to the traditional way of gathering and delivering information from and to the environment: sensing is “distributed across a large number of (often mobile) individuals rather than by any individual or set of sensors in fixed locations” [3]. Essentially, every device owned by a person (e.g., smartphone, smartwatch, etc.) can be used to acquire geo-located data thus permitting spatial and temporal resolution improvements in services provided by a smart city.
The goal of this paper is the design and the development of an IoT crowd sensing platform (the SmartBike platform) able to monitor air city conditions while providing services that are interesting for both users and institutions. This platform will be adopted within the OpenAgor`a project [4], one of the proposals selected by the city of Turin for the Torino Living Lab Campidoglio experimentation [5]. Involving different partners (Turin TIM Joint Open Lab,
Journal Homepage:http://iaesjournal.com/online/index.php/IJECE
Institute of Advanced Engineering and Science
Politecnico di Torino, and two startups, Move Plus [6] and Ponyzero [7]), the Open Agor`a project aims at developing and testing solutions for helping people to make their mobility behavior more sustainable. In addition, it aims, at the same time, at providing data and tools that can be used by the city institutions to enhance the overall quality of life of their citizens.
Due to the extensive use of bicycles observed in literature for monitoring smart cities ([8, 9, 10, 11, 12]), the bicycle was selected as a crowd sensing probe for monitoring the city environment. The development of the proposed platform was divided into four main steps. At first, a survey was conducted to identify the most interesting bike-enabled features for users. This step is based on the observation reported by Alam et al. [13] about the usefulness of involving users in designing new services: authors demonstrate that user involvement in designing new services facilitates the development of better and differentiated new services that match exactly customer needs. Then, in the second phase, the four most preferred features emerging from the survey results were selected to inform the definition of the services provided by the platform. The selected features are the following: a) real time remote geo-location of user bikes, b) anti-theft service, c) information about traveled route (distance, duration, and rise), and d) air pollution monitoring. Based on them, in this phase, the architecture of an IoT crowd sensing platform was designed. After that, an initial prototype of the presented platform was implemented in the third phase and used in the forth phase to test the feasibility of the approach and the suitability of the platform.
It was demonstrated that the proposed SmartBike platform is able to provide the designed services, and, in addition, that the air pollution measures provided by the platform are compatible with the ones provided by the official environmental monitoring system of the city of Turin.
The remainder of the paper is organized as follows: Section 2. analyzes related works, while Section 3. presents the results of the user survey. Section 4. describes the proposed architecture and Section 5. analyzes the first developed prototype. Finally, results obtained by testing the feasibility of the platform are discussed in Section 6. and Section 7. concludes the paper and discusses future works.
2. RELATED WORKS
The current section presents existing environmental monitoring systems and, specifically, air quality detection solutions based on IoT technologies. Particular attention is paid to the services for citizens provided by each presented solution.
Environmental monitoring and air quality detection systems have been subject of extensive studies in the literature ([14, 15, 16]). Mehta et al. [17], for example, developed a cloud based air quality detection system that analyzes data for providing atmospheric quality measurements to the user in real time. They proposed the architecture of a AMS (Air Monitoring Sensor) system that consists of a device equipped with nine sensors placed in strategic locations across the city. The device is responsible for collecting data about the toxicity of the air, informing users about the air quality of the area in which they are moving and suggesting alternative routes. Xiaojun et al. [18] presented an IoT-based air pollution monitoring and forecasting system. The designed system is based on low cost air quality monitoring stations that can be laid out in sensible points of the city. These stations enhance the network of sensors spread all over the city and increase the precision of revealed air quality information. The presented solution does not actually supply any service to users, but it constitutes a real and effective decision-making basis for emergency response that can be used to develop and provide new future services.
In addition, different other works were found in literature aiming at monitoring ambient conditions using crowd-sensing based devices, such as bicycles, and complementing local environmental monitoring stations. Liu et al. [8, 10] presented a platform that exploits a custom-made sensor box mounted on public shared bicycles to monitor air pollution. They demonstrate that these devices can be used to improve the accuracy of the existing local environmental monitoring stations. The air quality of the entire city is presented, in both works, on a website and is available to every citizens and/or institutions.
Furthermore, Zeiger et al. [9] described a system for environmental monitoring based on participatory sens-ing. Mobile environmental sensors carried by citizens (pedestrians or cyclists) are used to measure pollutant con-centrations. Acquired data are then used to build a pollution map. Another interesting system, similar to the one presented in this paper, is the SensorWebBike, proposed by Vagnoli et al. [11]. The main component of their system
is a device equipped with air quality sensors (such as, noise, humidity, temperature,CO,CO2,O3,N O2, andCH4
sensors) that monitors the environment by using users’ bicycles as probes. However, the main difference with the platform presented in this paper is related to the services directly supplied to citizens. The SensorWebBike provides only a web application that shows a pollution map of the city to citizens without other user-related services such as anti-theft. Finally, Velasco et al. [19] present a mobile wireless sensor network system aiming at complementing the already existing official air quality monitoring systems of the city of Torino. Some tests were carried out by mounting the proposed system on bicycles in order to increase their mobility. The main difference from the one described in the
IJECE ISSN: 2088-8708 3
current paper is that their system does not offer direct services to citizens and, specifically, to cyclists.
3. USER SURVEY
As the first step in developing the SmartBike platform, an online survey was conducted with the aim of identi-fying the most interesting bike-enabled features. 288 persons were involved among Politecnico di Torino students and TIM employees that usually move around the city of Turin (Italy) riding their bikes. The survey has been accessible for two months and consisted of 10 questions divided into three main sections. The first section aimed at acquiring user demographic and habits information. The second section, instead, had the objective of analyzing user preferences for the future design of aesthetic characteristics of the proposed solution. The questions asked users to express their preferences about the preferred type of bike (e.g., mountain bike, city bike, etc.) and the most desired bike accessories (e.g., basket, baggage holder, etc.). Finally, the third section was related to the identification of the most interesting services for cyclists in the context of a smart city. The language used within the survey was Italian, results were then translated for the purposes of this paper.
3.1. Demographic information about interviewees
Aiming at recruiting users that usually move around the city of Turin (Italy) riding their bikes, 500 pro-motional tags with a printed QR code (which pointed to the surveys link) were attached to the bikes parked in the Politecnico di Torino courtyard. Moreover, an email promoting the survey was sent to TIM employees. A population of 288 people replied to the study, with 221 males and 67 females. Most participants were aged in the interval “36 -50” (Figure 1).
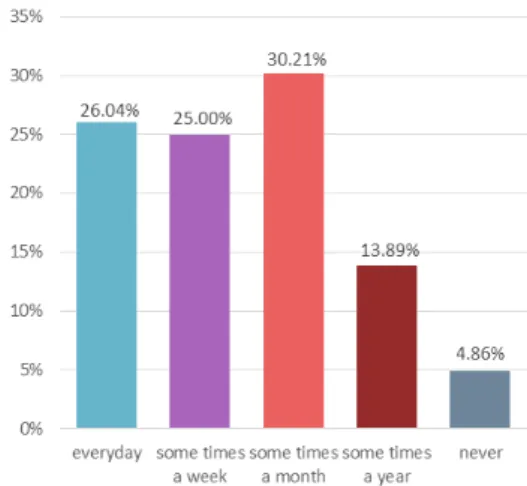
Furthermore, Figure 2 shows the frequency with which users declared to use their bicycles: most of the interviewees (81%) commonly use their bikes several times a month, and 50% at least weekly.
Figure 1. User Survey: age distribution
Figure 2. User Survey: frequency of bicycle usage
3.2. Preferred type of bike and most used bike devices
In the second section of the survey, respondents were asked to select the preferred type of bike among the following four types:
• budget bike
• city bike
• mountain bike
• racing bike.
Results reveals that the most preferred type of bike is the city bike (45.8%), followed by the mountain bike (26.7%), the racing bike (22.0%) and, finally the budget bike (5.5%). Furthermore, users were asked to declare if they usually desire one or more of the following bike accessories:
• baggage holder
• basket
• frontal light
• spoke light.
In this case, results reveals that the most preferred device is the frontal light (87.7%), followed by the spoke light (54.8%), the baggage holder (46.6%) and, finally, the basket (28.8%).
3.3. Most interesting bike-enabled features
In the final section of the survey, users were asked to select up to six possible future high tech bike im-provements out of those listed in Table 1. The reported values represent the percentage of users that selected each feature.
As can be observed from table 1, the six most requested features are: real time geo-location detection of the bike in case of loss or theft, anti-theft service which can send notifications to an end-user device, information about traveled route (traveled distance, duration, difference in altitude), air pollution level of traveled roads, GPS navigation device, and information about the speed.
Table 1. List of possible technological bike improvements with percentage of users that selected each of them
Feature Percentage of selections
(over 288 users)
Real time remote geo-location detection of the bike in case of loss or theft 67.72%
Anti-theft feature which can send notification to an end-user device 64.67%
Information about traveled routes (traveled distance, duration, difference in altitude) 47.48%
Air pollution level of traveled roads 42.07%
GPS navigation device 31.49%
Average, minimum, and maximum speed 30.25%
Automatic call for assistance in case of accidents (e-call) 29.70%
Bicycle maintenance status 23.79%
Information about high injury risk roads 22.28%
Burned calories 13.09%
Traffic information 13.05%
Audio instructions about navigation 11.81%
Heartbeat monitoring 9.69%
Reminders based on location on the route 7.98%
Point of interest 7.42%
Information about not accessible roads 6.93%
4. ARCHITECTURE
In the second phase of the SmartBike platform development, the four most requested features resulting from the survey were selected. Based on them, two different services were, then, designed and the architecture of the platform was devised. The selected features are:
(a) real time remote geo-location detection of the users’ bikes; (b) anti-theft;
(c) information about traveled route (distance, duration, and rise); (d) air pollution monitoring.
IJECE ISSN: 2088-8708 5
4.1. Scenario
Starting from the survey results, the following enabling scenario was designed and used to inform the defi-nition of the SmartBike platform provided services. The scenario concerns the use of the system by a typical cyclist
(named Ann) whose bike is stolen:Ann is at her home and wants to use her bike to go to work by avoiding areas with
too much pollution. Consequently, she takes her smartphone, opens the SmartBike app and, by using the built in maps chooses the best route to go to her works. Then, she enters her garage to take the bike, she deactivates the anti-theft service and then she goes working by bike. When Ann arrives at her workplace, she parks the bike in nearby park, activates the anti-theft system by using her smartphone and enters her office. While she is working, someone tries to steal her bike, so a notification is sent to her smartphone. Immediately she exits her office to scare the thief, but he is already gone. However, by using the SmartBike app she can locate her bike in real time, so she contacts the police and they finally recover her bike.
4.2. Provided services
Looking at the scenario, the following two main services were identified as the ones that should be provided by the SmartBike platform:
1. the “city monitoring” service gathers the features (a, c and d of the first list of this section) aimed at collecting and showing air pollution information of areas traveled by involved cyclists. Considering that air pollution can be influenced by temperature, relative humidity and barometric pressure, those data should be acquired through appropriate sensors in addition to the air pollution information. The collected data should be geo-located and periodically sent to SmartBike central servers able to store it. Likewise, the platform should provide a web map showing the traveled routes and the level of pollution of the areas of the city monitored by available bikes. These services should be accessible into two different modes: a “personal” mode showing only user related information to logged users (e.g., the position of the owned bikes) and a “public” mode showing aggregated information obtained by merging data collected by each user;
2. the “anti-theft” service, instead, gathers the anti-theft feature (b of the list reported at the beginning of this section). The SmartBike platform should allow an authenticated user to enable/disable an anti-theft service that, by monitoring movements of the bike, should generate a notification whenever a thief tries to steal the bike. In addition, the platform should provide real time information about the bike location and the device status (e.g., battery level).
Figure 3 shows the designed logical architecture of the SmartBike platform. It is composed of three main components: the SmartBike devices, the end-user devices (e.g., smartphones and tablets), and the SmartBike central servers.
Figure 3. High level architecture design of the SmartBike platform
4.3. Architecture design
TheSmartBike devicesblock represents the IoT objects that are mounted on the bicycles. They should be autonomous (i.e., always active and connected to the Internet even when the user smartphone/tablet is not close to them) and should provide the following functionalities to support the two services described in Section 4.2.:
• environmental monitoring functionality able to collect data about air pollution, temperature, relative humidity and barometric pressure;
• bike status monitoring functionality able to detect any movement of the bike while the anti-theft service is
enabled;
• data synchronization functionality able to periodically send acquired data to the SmartBike central servers.
When the anti-theft service is enabled the information should be sent in real time to the SmartBike central servers;
• location functionality used to geo-tag acquired information and locate the bike in case of theft or loss;
• communication functionality used to provide interactions with end-user devices.
Theend-user devicesblock represents the smartphones or tablets on which a dedicated SmartBike applica-tion is installed. This app permits the following funcapplica-tionalities with the SmartBike devices and the SmartBike central servers:
• authenticate the user and enable interactions with her own SmartBike devices;
• enable/disable anti-theft service;
• generate theft alert notifications whenever it is informed about a theft by the SmartBike central servers;
• present the current status information (i.e., gas concentration, temperature, relative humidity, barometric
pres-sure and battery level) about all SmartBike devices owned by the user;
• visualize the location of the device on a map;
• show information about traveled route.
Finally, theSmartBike central serversrepresent one or more back-end servers that provide three different
kinds of functionalities as parts of both the two described services:
1. a data collection functionality, able to periodically receive data sent by SmartBike devices owned by different users. These data are useful for both final users and city institutions;
2. a web interface similar to the one provided by the app run on end-user devices to supply a) a map to geo-locate in real time the user bikes, b) a map based on historical information to show the air pollution conditions of the areas traveled by involved cyclists, c) information about personal traveled route. This interface, and specifically, the functionalities described in b) and c) will be interesting for both cyclists and city institutions;
3. an anti-theft functionality that a) redirects theft notifications sent by SmartBike devices to the right end-user devices and b) sends an anti-theft notification if no data are received from a SmartBike device for a certain amount of time.
5. PROTOTYPE
In order to evaluate the suitability of the platform, an initial prototype of the presented architecture has been implemented. As an initial prototype, the main assumption considered in the following description is that a user owns only one bike and one end-user device (e.g., smartphone and tablet). However, the prototype can be easily extended to cases in which a single user owns more than one bicycle and/or more end-user devices. In addition, in this prototype, the air pollution was monitored through the carbon monoxide concentration, only.
The following subsections illustrate the details of the components that compose the presented platform.
5.1. SmartBike devices
Figure 4 shows the implemented SmartBike device prototype.
It was implemented using the STM32 Nucleo L476RG board [20] equipped with the ARM mbed 3.0 Oper-ating System [21] as control board. The board contains the basic components (i.e., the CPU, memory and some ports) but it can be easily extended with a large number of specialized application hardware add-ons and shields. In this work it was expanded by adding the following shields:
IJECE ISSN: 2088-8708 7
• Adafruit FONA808 [22], as GSM/GPRS and GPS module for transmitting data to the SmartBike central servers
and provide the location of the bikes;
• ST X-Nucleo-IDB05A1 [23], as Bluetooth Low Energy 4.1 shield for providing connections with near end-user
devices;
• ST X-Nucleo-IKS01A1 [24], as environmental and motion sensor shield for acquiring temperature, humidity,
pressure and motion (acquired through the accelerometer);
• Nemoto NAP-505 [25] with Texas Instruments LMP91002 Analog Front End (AFE) [26], as electrochemical
CO sensor chosen for its low power consumption and good reading accuracy at a reasonable cost.
The device is autonomous: a battery guarantees its power supply and the GSM/GPRS module guarantees its
connec-tivity functions even when it is not connected to a smartphone/tablet. As a requirement of this prototype, a 10AhLiPo
battery was chosen to let the device be active for 48 hours while collecting data with an interval of 12 seconds.
5.2. End-user devices
Figure 5 shows two screenshots of the designed end-user prototype application. The application was de-veloped for Android devices running at least Android 5.0 and was dede-veloped using the Android Studio IDE. The implemented user interface is minimal and is composed of two activities providing different functionalities. The main activity is shown in Figure 5a. It implements the following functionalities:
• it provides a button to connect the end-user device to the hardware device via a Bluetooth Low Energy
connec-tion;
• if connected to the hardware device, it provides the current status of the hardware device showing the revealed
carbon monoxide, temperature, relative humidity and pressure;
• if connected to the hardware device, it provides a button to activate or deactivate the anti-theft service.
The second activity, i.e., the map activity, is shown in Figure 5b and provides a map showing the current location of the bike.
Figure 4. The SmartBike device pro-totype
Figure 5. Screenshots of the designed prototy-pal application
In addition, two background services were implemented: the first one provides an interface for receiving notifications from the SmartBike central servers in case of theft, while the second one manages the connections needed to periodically send collected data to the SmartBike central servers.
5.3. SmartBike central servers
To provide the designed services, a solution integrating a back-end and a front-end platform was adopted in implementing the SmartBike central servers block. SiteWhere [27], an open source IoT server platform, was used as back-end to collect and store all the data sent by both SmartBike devices and end-user devices and to provide this data to the mobile and the web applications. It collected: a) air pollution information, b) location information, c) bike motion (acquired through accelerometer), d) SmartBike devices’ statuses.
The web application, acting as front-end platform, was implemented based on Meteor [28], a full-stack JavaScript platform for developing modern web and mobile applications. The implemented Meteor application grants a) access to a map showing traveled routes and the level of pollution of the areas of the city monitored by available bikes, and b) the generation of all the notifications sent to users to report theft attempts. The solution was deployed on a free Amazon EC2 [29] instance.
Figure 6 shows the map reported in the web interface to let the user know her bike current location and the recently traveled route.
Figure 6. The position of the bike can be remotely visualized on a map with the traveled route
6. RESULTS
To evaluate the feasibility of the approach, the suitability of the platform and the accuracy of the implemented prototype, the whole prototype has been subjected to a test phase. A volunteer cyclist was invited to reproduce the sample scenario reported in section 4.: the implemented prototype of the SmartBike device was placed inside the basket of his bike and the Android application was installed on his smartphone running Android 6.0.1 (a Karbonn Sparkle V smartphone).
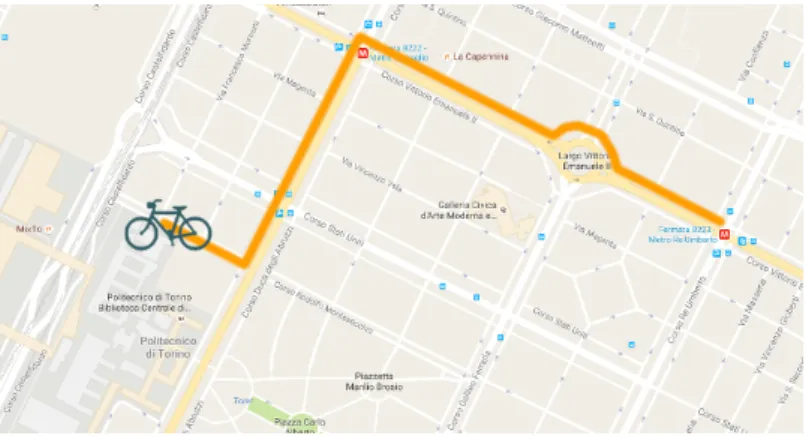
The experiment was conducted on the 26th of May 2016 for 30 minutes between 14:00 and 14:30. The user went through the area of Turin (Italy) shown in Figure 7 and located near Politecnico di Torino.
Air pollution information were collected simultaneously using a) the implemented platform prototype and b) the closest ARPA (Italian acronym of “Regional Environmental Protection Agency”) city monitoring station situated
about 3kmfar from the area of experiment (it is precisely located in Via della Consolata in Turin, Italy). Moreover,
the anti-theft service was tested by trying to move the parked bike to simulate a theft attempt without the presence of the bike owner.
The analysis of collected data actually demonstrated that the implemented prototype was able to provide all the services described in the previous sections:
• a notification arrived on the user smartphone after a few seconds from the beginning of the theft attempt;
• the CO value measured by the SmartBike device was compatible with the one measured by the ARPA station.
The average value of carbon monoxide acquired by the SmartBike device and calculated over 180 samples (1
every 12 seconds) is 1.2±0.5ppm(part per million). Instead the one monitored by the ARPA station1, calculated
as the average value of the two measures acquired at 14:00 and 15:00, is 0.892ppm(1.1mg m−3) and the two
measurements are compatible.
1Actual values acquired through the ARPA monitoring station were taken from the ARPA official website [30].
IJECE ISSN: 2088-8708 9
Figure 7. Map of the area of Turin (Italy) monitored within the test
7. CONCLUSION AND FUTURE WORKS
In this paper we present an IoT Crowd Sensing platform that offers a set of services to citizens by exploiting a network of bicycles as IoT probes. A survey aimed at identifying the most interesting bike-enabled services for users was conducted among 288 users that usually use a bike in their daily life. The following services were identified: a) real time remote geo-location detection of the users’ bikes, b) anti-theft service, c) information about traveled route (distance, duration, and rise), and d) air pollution monitoring. Then, starting from an enabling scenario, the details of each service were defined and the architecture of the SmartBike platform was designed. It is composed of three main components: the SmartBike devices for data collection, the end-user devices (e.g., smartphones and tablets) as user interfaces for the real time bike geo-location detection and the anti-theft service, and the SmartBike central servers for storing revealed data and providing a web interface for data visualization. To evaluate the feasibility of the approach and the suitability of the platform, an initial prototype of the presented platform was implemented and the platform was tested by a volunteer.
Results demonstrate that the proposed SmartBike platform is able to provide the designed services, and, in addition, that the accuracy of the air pollution measures provided by the proposed platform are compatible with the ones provided by the official environmental monitoring system of the city of Turin.
Future works will include the development of missing functionalities and a large-scale field experimentation: the described platform will be adopted in the OpenAgor`a project [4] within the Torino Living Lab Campidoglio experimentation [5]. The OpenAgor`a project aims at helping people making their mobility behavior more sustainable and, at the same time, providing data and tools that can be used by the city institutions to enhance the overall quality of life of their citizens.
In addition, new air quality parameters will be monitored by introducing new sensors in the SmartBike devices. Finally, starting from the results of the first part of the survey regarding the preferred type of bicycle and the most used bike accessories, the aesthetic design of the SmartBike devices will be subjected to a new study that will involve again users.
ACKNOWLEDGMENT
This work was supported by a fellowship from TIM (SWARM Joint Open Lab) for Teodoro Montanaro. The authors wish to thank Roberta Giannantonio and Ilaria Zonda who designed and conducted the survey about SmartBike features.
REFERENCES
[1] A. Cenedese, A. Zanella, L. Vangelista, and M. Zorzi, “Padova smart city: An urban internet of things
experi-mentation,” inWorld of Wireless, Mobile and Multimedia Networks (WoWMoM), 2014 IEEE 15th International
Symposium on a, June 2014, pp. 1–6.
[2] A. Zanella, N. Bui, A. Castellani, L. Vangelista, and M. Zorzi, “Internet of things for smart cities,”IEEE Internet of Things Journal, vol. 1, no. 1, pp. 22–32, Feb 2014.
[3] L. G. Jaimes, I. J. Vergara-Laurens, and A. Raij, “A survey of incentive techniques for mobile crowd sensing,”
IEEE Internet of Things Journal, vol. 2, no. 5, pp. 370–380, Oct 2015.
[4] “OpenAgor´a Project: Mobility as a service.” [Online]. Available: http://openagora.it/index-en.html [5] “Torino Living Lab - Campidoglio.” [Online]. Available: http://torinolivinglab.it/bandi/tllcampidoglio/ [6] “Move Plus: car pooling,” http://www.moveplus.it/ and http://www.easymoove.it/.
[7] “Ponyzero: sustainable urban logistics.” [Online]. Available: http://www.ponyzero.com/
[8] X. Liu, B. Li, A. Jiang, S. Qi, C. Xiang, and N. Xu, “A bicycle-borne sensor for monitoring air pollution near
roadways,” inConsumer Electronics - Taiwan (ICCE-TW), 2015 IEEE International Conference on, June 2015,
pp. 166–167.
[9] F. Zeiger and M. Huber, “Demonstration abstract: Participatory sensing enabled environmental monitoring in
smart cities,” inProceedings of the 13th International Symposium on Information Processing in Sensor Networks,
ser. IPSN ’14. Piscataway, NJ, USA: IEEE Press, 2014, pp. 337–338.
[10] X. Liu, C. Xiang, B. Li, and A. Jiang, “Collaborative bicycle sensing for air pollution on roadway,” in 2015
IEEE 12th Intl Conf on Ubiquitous Intelligence and Computing and 2015 IEEE 12th Intl Conf on Autonomic and Trusted Computing and 2015 IEEE 15th Intl Conf on Scalable Computing and Communications and Its
Associated Workshops (UIC-ATC-ScalCom), Aug 2015, pp. 316–319.
[11] C. Vagnoli, F. Martelli, T. D. Filippis, S. D. Lonardo, B. Gioli, G. Gualtieri, A. Matese, L. Rocchi, P. Toscano,
and A. Zaldei, “The sensorwebbike for air quality monitoring in a smart city,” inFuture Intelligent Cities, IET
Conference on, Dec 2014, pp. 1–4.
[12] Y. Taniguchi, K. Nishii, and H. Hisamatsu, “Evaluation of a bicycle-mounted ultrasonic distance sensor for
mon-itoring road surface condition,” inComputational Intelligence, Communication Systems and Networks (CICSyN),
2015 7th International Conference on, June 2015, pp. 31–34.
[13] I. Alam, “An exploratory investigation of user involvement in new service development,”Journal of the Academy
of Marketing Science, vol. 30, no. 3, pp. 250–261, 2002.
[14] C.-Y. Hsieh, “Model study for temperature microchange by wsn technology,”International Journal of Electrical
and Computer Engineering (IJECE), vol. 2, no. 5, pp. 632–638, October 2012.
[15] S. S. P. Deekla, R. Phatthanakun and N. Chomnawang, “Al microheater and ni temperature sensor set
based-on photolithography with closed-loop cbased-ontrol,”International Journal of Electrical and Computer Engineering
(IJECE), vol. 5, no. 4, pp. 849–858, August 2015.
[16] C. Ryu and C. Hur, “A monitoring system for integrated management of iot-based home network,”International
Journal of Electrical and Computer Engineering (IJECE), vol. 6, no. 1, pp. 375–380, February 2016.
[17] Y. Mehta, M. M. M. Pai, S. Mallissery, and S. Singh, “Cloud enabled air quality detection, analysis and prediction
- a smart city application for smart health,” in2016 3rd MEC International Conference on Big Data and Smart
City (ICBDSC), March 2016, pp. 1–7.
[18] C. Xiaojun, L. Xianpeng, and X. Peng, “Iot-based air pollution monitoring and forecasting system,” inComputer
and Computational Sciences (ICCCS), 2015 International Conference on, Jan 2015, pp. 257–260.
[19] A. Velasco, R. Ferrero, F. Gandino, B. Montrucchio, and M. Rebaudengo, “A mobile and low-cost system for
environmental monitoring: A case study,”Sensors, vol. 16, no. 5, p. 710, May 2016.
[20] “Stm32 nucleo l476rg website.” [Online]. Available: http://www.st.com/content/st com/en/products/evaluation-tools/product-evaluation-tools/mcu-eval-tools/stm32-mcu-eval-tools/stm32-mcu-nucleo/nucleo-l476rg.html [21] “ARM mbed OS website.” [Online]. Available: https://www.mbed.com/en/platform/mbed-os/
[22] “Adafruit FONA808 module documentation.” [Online]. Available: https://www.adafruit.com/product/2542 [23] “ST X-NUCLEO-IDB05A1 shield documentation.” [Online]. Available:
http://www.st.com/en/ecosystems/x-nucleo-idb05a1.html
[24] “ST X-NUCLEO-IKS01A1 shield documentation.” [Online]. Available: http://www.st.com/en/ecosystems/x-nucleo-iks01a1.html
[25] “NAP-505 electrochemical CO sensor specifications.” [Online]. Available: http://www.nemoto.eu/nap-505.html [26] “LMP91002: configurable AFE for low power H2S and CO-Sensing applications.” [Online]. Available:
http://www.ti.com/product/LMP91002
[27] “SiteWhere website.” [Online]. Available: http://www.sitewhere.org/ [28] “Meteor website.” [Online]. Available: https://www.meteor.com/
[29] “Amazon EC2 documentation.” [Online]. Available: https://aws.amazon.com/ec2/?nc1=h ls
[30] “Arpa website for accessing data acquired through city monitoring stations situation in piedmont region.” [Online]. Available: http://www.sistemapiemonte.it/ambiente/srqa/consultadati.shtml