Investigating the Dynamics of Knowledge
Acquisition in Learning Using Differential
Equations
Gilbert Makanda, Roelf Sypkens
Abstract—A mathematical model for knowledge acquisition in teaching and learning is proposed. In this study we adopt the mathematical model that is normally used for disease modelling into teaching and learning. We derive mathematical conditions which facilitate knowledge acquisition. This study compares the effects of dropping out of the course at early stages with later stages of learning. The study also investigates effect of individual interaction and learning from other sources to facilitate learning. The study fits actual data to a general mathematical model using Matlab ODE45 and lsqnonlin to obtain a unique mathematical model that can be used to predict knowledge acquisition. The data used in this study was obtained from the tutorial test results for mathematics 2 students from the Central University of Technology, Free State, South Africa in the department of Mathematical and Physical Sciences. The study confirms already known results that increasing dropout rates and forgetting taught concepts reduce the population of knowledgeable students. Increasing teaching contacts and access to other learning materials facilitate knowledge acquisition. The effect of increasing dropout rates is more enhanced in the later stages of learning than earlier stages. The study opens up a new direction in further investigations in teaching and learning using differential equations.
Keywords—Differential equations, knowledge acquisition, least squares nonlinear, dynamical systems.
I. INTRODUCTION
K
NOWLEDGE acquisition is a requirement for survival and happens throughout one’s life span; it occurs through theory formulation and revision [1]. A change in behaviour due to earlier experience can show knowledge acquisition, though some experiences caused by injury or similar situations are not included [2]. Knowledge is acquired by implementing different strategies such as selection of adequate and relevant material to suit the students’ expertise [3]. Woda also pointed out that knowledge acquisition is better facilitated by finding easier ways to explain concepts. The learning difficulties encountered by students in higher learning is as a result of poor background in their early learning career especially in primary school [4], [5]. Extensive research shows poor performance in mathematics [6]. The reasons for this high failure rate have been associated with historical background of the education system, poor educator training and lack of facilities [7]. Spaull pointed out that the effects of apartheid are still responsible for some of the failures experienced at this stage. As a result, the national examinations in mathematics and science have failed to adequately prepare school leaving Gilbert Makanda and Roelf Sypkens are with the Department of Mathematical and Physical Sciences, Central University of Technology, Bloemfontein, South Africa, ZA, 9300 (e-mail: [email protected]).students for university education [8]. The acquisition of certain cognitive, social and emotional capabilities helps students to learn better in later years [4].
Education is a social process [9]. Dewey suggested that learning be facilitated in a classroom in which interaction happen with teachers and amongst themselves. People learn best when they interact with other people [10]. Russian psychologist Levy Vygotsky studied social interaction and concluded that it is important to children’s learning [11]. He pointed out that children learn how to solve problems by talking about them. He used the term Zone of Proximal Development (ZPD) to describe the range of a child’s certain experiences; the lower being what the child is able to do independently and the upper being what the child does with the help of others with advanced knowledge.
In this study we take into consideration the effects of dropout rates on the process of knowledge acquisition. Twenty-five per cent of all students drop out in their first year of study and only 21% graduate within the stipulated time allocated for the degree [8]. This study pointed out that lack of available finance and a big articulation gap between secondary education and higher education is the major cause of drop out. Admission of students into the university is based on their performance in the matriculation (Grade Twelve) examinations. Some students get into the university without meeting entry requirements [12]. A study by Letseka and Maile placed South Africa’s graduation rate amongst the lowest with 15%across all South African Universities. With this context in mind we incorporate this aspect in the proposed mathematical model for knowledge acquisition.
In this paper we propose a mathematical model which is normally used to describe how the disease spreads. Vygotsky’s knowledge acquisition model of the need to interact to facilitate knowledge acquisition is analogous to the situation which facilitates transmission of a disease. In knowledge acquisition, a knowledgeable individual (teacher) is introduced into a classroom and passes it on to others who then interact to acquire it. Similarly, in the case of a disease, an infected individual is introduced into a susceptible group of people who then acquire the disease after what is known as adequate contact. The most important aspect to note is that; in knowledge acquisition we favour the progression of knowledge acquisition yet in disease modelling we do not favour the progression of a disease. The proposed mathematical model can easily be modified to deal with this aspect. We therefore adopt a mathematical model first proposed by Kermak and
Mackendrick in 1927. This model divides the population into two groups the susceptible and the infected individuals. Incorporating the laws of mass action, the mathematical model is constructed.
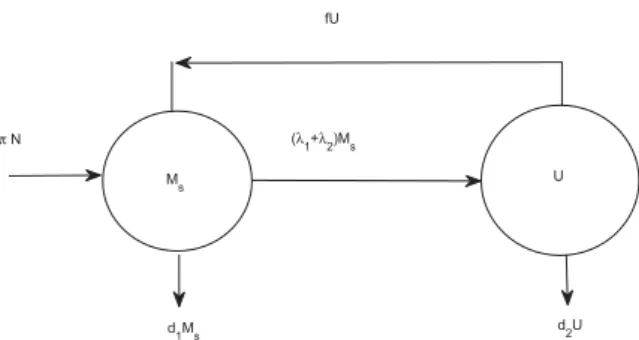
II. MATHEMATICALFORMULATION ANDASSUMPTIONS In this section we develop a mathematical model for knowledge acquisition. We assume that those who teach transmit their knowledge to students. In this regard we incorporate the use of the compartmental model to this situation. We further assume that the population of study is divided into two; those students who are recruited into the departments before teaching commences Ms and those who have acquired the knowledge U. Their contact with lectures and other learning facilities is modelled by the mass action principle. The rates of knowledge acquisition through teaching and contact with other sources are given by βT and β0 respectively. π is recruitment rate into the respective department from the entire applicants to the university. d1 is
the dropout rate in the first groupMs associated with various reasons such as movement to other courses and financial constraints. d2 is the dropout rate in the second group U;
those who already have acquired knowledge. f is the rate of forgetting the acquired concepts, these then move back to the group that require teaching. We further assume that concepts cannot be forgotten in the initial stages of teaching. The compartmental model for the situation described above is shown below.
A. Mathematical Formulation and Assumptions
In this section we develop a mathematical model for knowledge acquisition. We assume that those who teach transmit their knowledge to students. In this regard we incorporate the use of the compartmental model to this situation. We further assume that the population of study is divided into two; those students who are recruited into the departments before teaching commences Ms and those who have acquired the knowledge U. Their contact with lectures and other learning facilities is modelled by the mass action principle. The rates of knowledge acquisition through teaching and contact with other sources are given by βT and β0 respectively. π is recruitment rate into the respective
department from the entire applicants to the university. d1 is
the dropout rate in the first groupMs associated with various reasons such as movement to other courses and financial constraints. d2 is the dropout rate in the second group U;
those who already have acquired knowledge. f is the rate of forgetting the acquired concepts, these then move back to the group that require teaching. We further assume that concepts cannot be forgotten in the initial stages of teaching. The compartmental model for the situation described above is shown below.
The differential equations describing the knowledge acquisition dynamics is given as in Kermack and McKendrick
8 0V I8 λλ0V π1 G0V G8
Fig. 1 Compartmental model for knowledge acquisition
(1927) for a disease model by; dMs
dt =π+f U−(d1+λ1+λ2)Ms, (1) dU
dt = (λ1+λ2)Ms−(d2+f)U, (2) Ms(0) =M0s, U(0) = 1 (3) where λ1=βTU and λ2=β0U are the force of knowledge
acquisition from teaching contacts and exposure to other learning materials respectively. The initial conditions Ms(0) and U(0) stipulate the values of the number of students in the department of mathematics and the number of lecturers or teachers in the department.
III. STABILITYANALYSIS
In this section we investigate the ’knowledge free state’, the situation in which teaching has not started or done. We also compute the conditions under which knowledge acquisition progress. Unlike in the case of disease modelling, we desire the knowledge acquisition to progress which would correspond to the progression of a disease. We compute the equilibrium points for the system (1)-(3), the knowledge free state is given by E0(πN/d1,0). The condition under which knowledge acquisition progress is expressed by the second equilibrium point(Ms∗, U∗). At this stage we define the basic knowledge acquisition numberK0
The basic knowledge acquisition number K0, is the
number of secondary teaching contacts produced by one knowledgeable teacher/student introduced in the recruited group of students. If K0 < 1, then knowledge acquisition
does not progress and ifK0>1 then knowledge acquisition progresses.
In the above definition, it is assumed that the knowledge acquired by students is shared amongst themselves. It is therefore necessary at this stage to state that not all contacts amongst students result in successful knowledge transfer. For knowledge transfer to be successful, adequate contact should take place. According to Van den Driessche and Watmough [13], we calculate the value ofK0by considering the matrix of new knowledgeable individualsF from a rearranged system of equations (1)-(3)starting with the one responsible for knowledge acquisition. The second generation matrix was calculated and the value ofK0being the dominant Eigen value
of this matrix. The value ofK0 was found to be K0= (βT +β0)π
TABLE I
STUDENTSWHOPASSEDNOV2014INMATHEMATICSII
week 1 2 3 4 5 6 7
students passed 178 250 255 245 252 232 162
We now investigate the stability of the knowledge free state and the state in which knowledge progress. The equilibrium points are E0 = (π/d1,0) and E1 = (π/d1K0, π(K0−1)/K0d2) to determine the stability of
these points we compute the Jacobean matrix evaluated at these points. The Jacobean matrix evaluated at the knowledge acquisition free state is given by
J(π d1,0) = −d1 −(βT+β0)π/d1 0 (d2+f)(K0−1)
Evaluating |J−λI| = 0, the Eigen values of this matrix are α1 = −d1 and α2 = (d2+f)(K0−1). The point E0
is asymptotically stable for K0 < 1. The Jacobean matrix
evaluated at the knowledge acquisition state in terms ofK0is
given by J(Ms∗, U∗) = −d1−dd12(d2+f)(K0−1) −d2 d1 d2(d2+f)(K0−1) 0
The eigen values of this matrix is given by α1= −[d1+dd12A] + [d1+ dd12A]2−4d1A 2 α2= −[d1+dd12A]− [d1+ dd12A]2−4d1A 2
where A = (d2+f)(K0−1) If K0 > 1 the knowledge
acquisition state is asymptotically stable, otherwise it is unstable. This is the condition which facilitates knowledge acquisition. To make sure that this condition is achieved, the product of recruitment rate and the combined teaching effort and other learning materials should be greater than the product of the dropout rates with forgetting rate.
IV. RESULTS ANDDISCUSSION
In this section we study the data collected from students’ performance from the Central University of Technology in the Department of Mathematics. The data shows the number of students who passed tutorial tests as the semester progressed. The tests were administered every second week throughout the semester. We investigate how the availability of teaching and dropout rates affected the number of students who passed the tests. We then compared the actual trend to the theoretical trend. We used the data to fit to the proposed mathematical model using a combination of Matlab based numerical method ode45 and Levenberg- Marquardt algorithm. The proposed mathematical model can then be used to predict the pass rate given the initial conditions.
Table I shows the distribution of students who passed mathematics II in November 2014, the data is plotted in the bar chart below and fitted in the graph in Fig. 2 (b).
In Fig. 2 (a) shows the bar chart of the distribution of the number of students who passed the assessments throughout
(a) Bar chart of students passed November 2014
7LPHZHHNV .QRZOHGJHDEOHVWXGHQWSRSXODWLRQ )LWWHG 2EVHUYHG
(b) Fitted model for November 2014
Fig. 2 Bar chart and fitted model
the semester. The trend indicates an increase in the number of students who passed and later deceases as the semester progressed in November 2014. The drop in the number is associated with the dropout and failure to understand concepts. The actual data was fitted to a theoretical model shown in Fig. 2 (b). The fitted model shows the same trend of increasing in the beginning of the semester and then decreasing later at the end of the semester.
The error in fitting the observed data to the theoretical model was investigated and the differences are shown as a bar chart (Fig. 3 (a)). We note that high frequencies in differences are noted at the beginning and at the end of the semester. The differences at the beginning are as a result of the small initial number of knowledgeable individuals introduced into the population. In Fig. 3 (b) the goodness of fit of the data is shown. The red line indicates that if all points are close to the line, there would be no difference between the predicted values and the observed values. In this study we note that most of the
(a) Bar chart of students passed November 2014
(b) Fitted model for November 2014
Fig. 3 Bar chart and fitted model
TABLE II
STUDENTS WHOPASSEDJUNE2015INMATHEMATICSII
week 1 2 3 4 5 6 7
students passed 272 174 167 317 348 329 246
points are close to the red line indicating that the fit is good enough to predict the observed values. The Table II shows the distribution of passes in mathematics II in June 2015. The data is presented in the bar chart in Fig. 4 (a) and the data is fitted in the graph shown in Fig. 4 (b). In general the trend in the bar chart in Fig. 4 (a) shows an increase at the beginning and a decrease at the end as in the previous case. The graph Fig. 4 (b) shows the fitted data and the predicted model. In general, we observe that the predicted model behaves almost similar to the observed data.
The error in the fitted data was investigated in the form of the bar chart in Fig. 5 (a), the large differences are also noted at the beginning and at the end of the semester. The goodness of fit scatter diagram shows that most of the points are close to the red line indicating that the model is good enough to predict the observed data.
The data for the number of students who passed mathematics II in November 2015 is tabulated in Table III.
(a) Bar chart of students passed June 2015
(b) Fitted model for June 2015
Fig. 4 Bar chart and fitted model
TABLE III
STUDENTS WHOPASSEDNOV2015INMATHEMATICSII
week 1 2 3 4 5 6 7
students passed 126 128 142 150 127 100 70
The distribution is displayed in the bar chart in Fig. 6 (a). The bar chart in Fig. 6 (a) shows a distribution which increases from the beginning and then decreases at the end of the semester, these results follow the same trend as the others displayed in the previous figures. The data was then fitted in the graph shown in Fig. 6 (b) which shows the same trend in the predicted model. The fitted model shows a clear increase and then later a drop in the number of students who passed mathematics II.
The errors in data fitting is analysed in Figs. 7 (a) and (b). The differences in the observed data and the predicted model is shown in the bar chart, it is observed that in this data more differences are noticed in during the middle of the semester. The goodness of fit shows that most of the points lie close to the line in Fig. 7 (b), making it a good prediction to the observed data.
(a) Bar chart of students passed June 2015
(b) Fitted model for June 2015
Fig. 5 Bar chart and fitted model
TABLE IV
STUDENTS WHOPASSEDJUNE2016INMATHEMATICSII
week 1 2 3 4 5 6 7
students passed 208 250 195 188 184 175 186
The distribution of the students who passed mathematics II in June 2016 is shown in Table IV. The data was then presented on the bar chart in Fig. 8 (a).
The number of students who passed mathematics II in June 2016 is presented in Fig. 8. The data was fitted as shown in Fig. 8 (b). It is noted that most of the points are close to the fitted model. This prediction shown the increase in the beginning and a decrease at the end of the semester.
The trends depicted on the bar in Figs. 2-9 show that the number of students who pass the test increase up to a certain time during the semester and then starts decreasing to a certain level. The same trend seems to be shown in different data sets used in this study. (see bar charts Figs. 2 (a), 4 (a), 6 (a), 8 (a)). The predicted models for these assessments were obtained using the ode45 and the Levenberg-Marquardt
(a) Bar chart of students passed November 2015
(b) Fitted model for November 2015
Fig. 6 Bar chart and fitted model
algorithm, these show similar trends (Figs. 2 (b), 4 (b), 6 (b), 8 (b)). The goodness of fit for the predicted models shows a generally good fit as most of the data is close to the red line in Figs. 3, 5, 7 and 9. The increase in the numbers of students passing shows that knowledge was being acquired through teaching and access to other learning materials. The decrease is attributed to forgetting of taught concepts and dropout rates. In the next section we test theoretically the effect of changing these variables to knowledge acquisition.
V. MODELDYNAMICSDISCUSSION
In this section we fit the actual data of the performance of students taken from the department of mathematical and physical sciences at the Central University of Technology. The department realized that student performance was poor in mathematics. This was caused by various reasons among others poor lecture attendance, lack of tutorial practice and high dropout rate. To solve this problem, the department started administering weekly tutorial tests in which students were tested on concepts that were covered each week. In this
(a) Bar chart of students passed November 2015
(b) Fitted model for November 2015
Fig. 7 Bar chart and fitted model
section we used Matlab ode45 to analyze the model dynamics of the governing differential equations.
In Fig. 10, hypothetical parameters are used based on the assumptions. We use the values π= 0.3, d1=d2= 0.2, f= 0.05, βT = 0.8, β0 = 0.2. The recruitment rate π = 0.3 means that the studied group is 30% of the total number of recruited students. The dropout ratesd1andd2are assumed to be different. The teaching contact rate is more than acquiring knowledge from other sources βT > β0. The teaching and learning dynamics are shown, the few lecturers/teachersU are the ones with knowledge, as teaching starts it is noted that the number of students without knowledge increases until a time when they start understanding the concepts. The increase in the knowledgeable population indicates the acquisition of knowledge. A considerable number of students never get to understand the required concepts a phenomenon widely observed in teaching and learning.
In Fig. 11 (a) increasing the teaching contact rate result in the increase in the knowledgeable population of students.
7LPH:HHNV QXPEHURIVWXGHQWVSDVVHG
(a) Bar chart of students passed June 2016
(b) Fitted model for June 2016
Fig. 8 Bar chart and fitted model
Increasing teaching contacts also depend on a number of factors such as numbers of students attending classes. In Fig. 11 (b) increasing the contact with other learning resources result in the increase in the knowledgeable population of students. This means that, knowledge acquisition is also enhanced by exposing students to different learning materials such as books and access to internet.
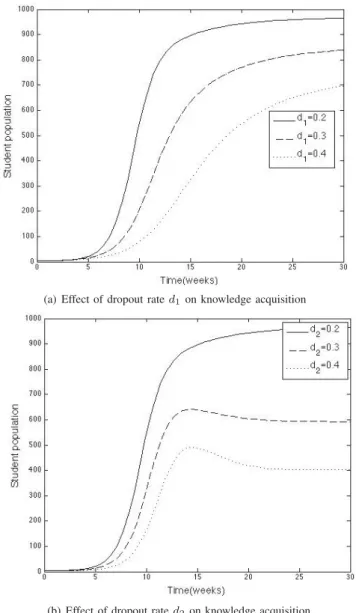
In Fig. 12 (a) it is observed that increasing the dropout rate d1, which is associated with students changing courses
to other departments, financial constraints result in decreasing the knowledgeable population. This means that interventions such as career guidance and provision of student finance might improve graduation rates in the departments of mathematics. In Fig. 12 (b), increasing the dropout rate d2, which is
associated with financial problems result in the sharp decrease in knowledgeable students. The effect of dropout rates in the group of those who have understood is more enhanced than in the group of students that are in their first stage of learning.
(a) Bar chart of students passed June 2016
(b) Fitted model for June 2016
Fig. 9 Bar chart and fitted model
Fig. 10 Knowledge acquisition dynamics in teaching and learning
(a) Effect of teaching contact rateβT on knowledge acquisition
(b) Effect of contact with other learning materials rateβ0on knowledge acquisition
Fig. 11 Effects of dropout rates on knowledge acquisition
Fig. 13 Effect on losing knowledge (forgetting) on knowledge acquisition
(a) Effect of dropout rated1 on knowledge acquisition
(b) Effect of dropout rated2on knowledge acquisition Fig. 12 Effects of dropout rates on knowledge acquisition
before they are examined, in Fig. 13 increasing the forgetting rate f result in decreasing the knowledgeable population of students. This can be kept in check by doing revision classes and other interventions.
VI. CONCLUSION
In this paper we deduce that indeed, the mathematical models that are normally used in disease models can be used in studying knowledge acquisition in education. We also conclude the following; the results reported in this study confirms already known results; these include the effect of dropout rates, teaching contact, contact with other learning materials and forgetting taught concepts to knowledge acquisition. The effect of dropout rate is more enhanced in the group of students that have already acquired concepts than those in their initial stage of learning. The stability analysis shows that the contribution of teaching and access to other learning material must be kept greater than the forgetting concepts and dropout rates. The agreement of actual data
and theoretical data trends show that it is accurate to use differential equations to model knowledge acquisition. The paper opens a new direction of application of differential equations in which effects of different aspects on knowledge acquisition can be explored. Interventions to improve teaching and learning can be incorporated into the model by suggesting appropriate functions that model those aspects.
ACKNOWLEDGMENT
The author would like to thank the department of Mathematical and Physical Sciences at the Central University of Technology for the data used in this study. The Faculty Research and Innovation Committee (FRIC) supported the funding of this publication.
REFERENCES
[1] D. Kuhn, M. Garcia-Milla, A. Zohar, C. Anderson, S. H. White, D. Klahr, S. M. Carver,Stratergies of knowledge acquisition, Monographs of the Society for Research in Child Development, 60, 1-157, (1995). [2] J. E. R. Staddon,Adaptive behaviour and learning, Cambridge University
Press, London, ISBN: 0521 256992 (1983).
[3] M. Woda (2010). Effective Knowledge Acquisition by Means of Teaching Strategies, Computational Intelligence and Modern Heuristics, Al-Dahoud Ali (Ed.), ISBN: 978-953-7619-28-2, InTech, Available from: http://www.intechopen.com/books/computational-intelligence-and -modern-heuristics/effective-knowledgeacquisition-by-means-of-teaching-strategies.
[4] N. Spaull, J. Kotze,Starting behind and staying behind in South Africa-The case of insurmountable learning deficits in mathematics, Int. J. Educational Development, 41 (2015) 13-24.
[5] M. Latseka,The Illusion of Education in South Africa, Clin Microbiol Infect, 5th World Conference on Educational Sciences - WCES 2013, Procedia - Social and Behavioural Sciences 116 ( 2014 ) 4864 4869. [6] H. Venkat, N. Spaull, What do we know about primary teachers’
mathematical content knowledge in South Africa? An analysis of SACMEQ 2007, Int. J. Educational Development, 41 (2015) 121-130. [7] N. Spaull,Poverty and privilege: Primary school inequality in South
Africa 2013, International Journal of Educational Development, 33 (2013) 436447.
[8] M. Murray, Factors affecting graduation and student dropout rates at the University of KwaZulu-Natal, South African Journal of Science, 2014;110(11/12), Art. 2014-0008. 6 pages, http://dx.doi.org/10.1590/sajs.2014/20140008.
[9] J. Dewey (1897).My pedagogic creed. In J. Dewey and A. W. Small, Teachers manuals (No.25). New York, NY: E. L. Kellogg and Co.. [10] C. G. Mooney (2000).Theories of childhood: An introduction to Dewey,
Montessori, Erikson, Piaget, and Vygotsky. St. Paul, MN: Redleaf Press. [11] L. S. Vygotsky (1978).Mind in society: The development of higher psychological processes. Cambridge, MA: Harvard University Press. (Original work published in 1934).
[12] T.E. Mabila, S.E. Malatje, A. Addo-Bediako, M.M.M. Kazeni, S.S. Mathabatha,The role of foundation programmes in science education: The UNIFY programme at the University of Limpopo, South Africa, International Journal of Educational Development, 26, (2006) 295304. [13] W. R. Derrick, P. van den Driessche,A disease transmission model in
a nonconstant population, Journal of Mathematical Biology, 31 (1993) 495-512.