Analysis of Spatial Variation in Flood Risk Perception Ajita Atreya and Susana Ferreira
Ajita Atreya Susana Ferreira 305 Conner Hall 313 Conner Hall
Department of Ag & Applied Economics Department of Ag & Applied Economics The University of Georgia The University of Georgia
Athens, GA 30602 Athens, GA 30602 Email: ajita@uga.edu Email: sferreir@uga.edu
Ajita Atreya is a Graduate student and Susana Ferreira is an Assistant Professor in the Department of Ag & Applied Economics at the University of Georgia.
Selected Paper prepared for presentation at Southern Agriculture Economics Association Annual meeting, Birmingham, Alabama, February 4- February 7, 2012
Copyright 2012 by A. Atreya and S. Ferreira. All rights reserved. Readers may make verbatim copies of this document for non-commercial purposes by any means; provide that this copyright notice appears on all such copies
Analysis of Spatial Variation in Flood Risk Perception Abstract
We use hedonic property models to estimate the spatial variation in flood risk in the city of Albany, GA. In addition to knowing whether a property is in the floodplain, we have a unique dataset with actual inundation maps from tropical storm Alberto that hit Albany in 1994. In the absence of information on the structural damages caused by a flood, having information on the actual inundated area can be useful to tease out information effect of a new flood from potential reconstruction cost. We find that the discount in actually inundated properties is larger which supports our hypothesis that homeowners respond better to what they have visualized (“seeing is believing”) and also the potential reconstruction cost in addition to information effect is capitalized in property prices.
Key words: Flood Risk, Inundation, Spatial, Discount I. Introduction
Flood damage has increased in the United States, despite local efforts and federal encouragement to mitigate flood hazards and regulate development in flood-prone areas (Pielke, et al., 2002). Flood damage refers to all sorts of harm caused by flooding: direct such as damage to buildings, economic goods, and loss of lives; and indirect such as disruption of social and economic activities. Other consequential effects of a flood include disturbances of markets after flood. This includes, for example, decreased price of real estate near floodplain (Messner and Meyer, 2006). This paper considers the 1994 flood in Albany as a source of flood risk information to households in Albany and examines the spatial variation in the perceived flood risk. Risk perception refers to intuitive risk judgment of individual and social group in the context of limited and uncertain information (Slovic, 1987). All the individuals of a community may assess the risk of being flooded differently, because there is discrepancy in the flow of information about the probability of flood hazard; and also because, each individual is exposed to different scenarios of flooding i.e. from being actually inundated to merely hearing about a flood event at
a distant in the same city. The actual amount of flood damage of a specific flood event is higher in an area that is more exposed to the hazard and intuitively, the flood risk perception of an individual should be pronounced in those areas that are directly hit by a flood. Previous studies have used FEMA designated flood hazard map as a proxy to flood risk zones and specific flood events to capture the informational effect on the perceived flood risk. In this study, we used actual inundation map as a proxy to flood risk zone in addition to FEMA designated maps. This is probably the first paper that uses actual inundation map to determine the effect of flood event on property prices. We hypothesize that the discount in these properties is larger as they are more likely to have experienced physical damages after the flood but also because homeowners respond better to what they have visualized (“seeing is believing”).
Two different areas are selected for the study: - one is the City of Albany and the other is an area within Albany where the majority of the damage occurred. The question that we attempt to answer in this paper is: - Is there spatial variation in the flood risk perception? Is the flood risk discount limited to the area directly affected by the flood or does it extend beyond the heavily affected areas?
We used a hedonic property model in a difference-in-difference framework to determine the risk perception in the city of Albany and also in the actually inundated study area near Flint River in Albany. Hedonic models (Rosen, 1974; Freeman, 2003) have been extensively used to estimate the contribution to the total value of a property of each characteristic possessed by the property. We find that there was significant discount of 24% in 100-year floodplain and a discount of 33% in 500-year floodplain immediately after the 1994 flood. The discount was even higher for the properties that were actually inundated. A significant discount of almost 46% was found in the
inundated areas. These results were robust to incorporating the spatial lag and spatial error term correction in the model.
II. Study Area
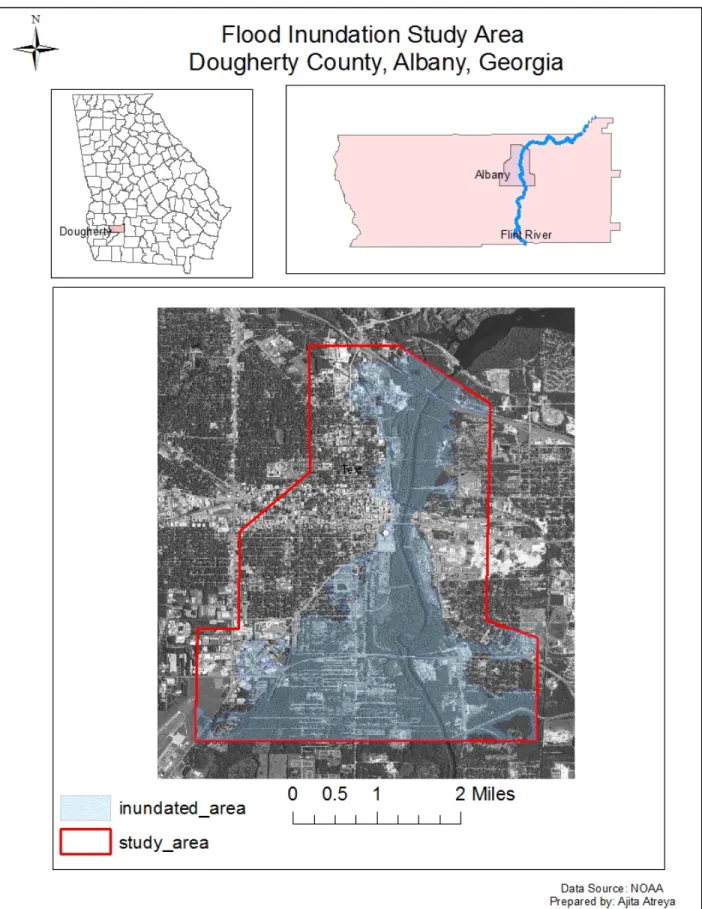
Albany was founded in the early 1800s along the Flint River in southwest Georgia. The city of Albany has a total area of 55.9 square miles, of which 55.5 square miles is land and 0.3 square miles is water (US Census Bureau, 2010). In 1994, a severe flood caused by tropical storm Alberto hit Albany, and destroyed parts of downtown and south Albany, causing 15 deaths and displacing almost 22,000 people. Peak discharges greater than the 100-year flood discharge were recorded at all USGS Flint River gauging stations (Stamey, 1996). According to USGS, at Albany, the Flint River peaked at a stage about 5 ft higher than the 1925 flood, which was the previous maximum flood at that gauging station. Figure 1 maps the Flint River, housing units and the associated floodplains for the Albany region. In figure 1, it is evident that there are many properties that fall in the floodplain. Almost 10 percent of the properties sold between the years of 1985 to 2010 fall in 100-year of 500-year floodplain.
According to FEMA, nearly 20,000 communities across the United States and its territories participate in the National Flood Insurance Program (NFIP) enacted in 1968, by adopting and enforcing floodplain management ordinances to reduce future flood damage. In exchange, the NFIP makes federally backed flood insurance available to homeowners, renters, and business owners in these communities. Community participation in the NFIP is voluntary. In order to actuarially rate new construction for flood insurance and create broad-based awareness of the flood hazards, FEMA maps 100-year and 500 year flood-plains in participating communities.
Albany, Georgia is one of the participating communities in NFIP since 1974. Homes and buildings in high risk flood areas, those with 1% or greater chance of flooding in any given year and with mortgages from federally regulated or insured lenders are required to have flood insurance.
In addition to the FEMA hazard maps, we also use maps of the area that was actually inundated by the 1994 flood in Albany to capture flood risk. With a major goal of reducing vulnerability of people and areas most at risk from natural hazard; United States Geological survey (USGS) along with partners the National Weather Service (NWS), U.S. Army Corps of Engineers (USACE), the Federal Emergency Management Agency (FEMA), state agencies, local agencies, and universities have developed a web-based tool, for flood response and mitigation. It provides digital geospatial flood-inundation maps that show flood water extent and depth on the land surface. USGS have modeled potential flow characteristics of future flooding along a 4.8-mile reach of the Flint River in Albany, Georgia, that was simulated using recent digital-elevation-model data and the U.S. Geological Survey finite-element surface-water digital-elevation-modeling system for two-dimensional flow in the horizontal plane. Simulated inundated areas, in 1-foot (ft) increments, were created for water-surface altitudes at the Flint River at Albany stream gage from 179.5-ft altitude to 192.5-ft altitude. 192.5-ft altitude corresponds to the 1994 flood stage at Flint River caused by tropical storm Alberto. Figure 2 shows the study area and the inundated area when the water surface altitude is 192.5 feet at Flint River, which corresponds to the 1994 flood caused by tropical storm Alberto and it is the altitude used in the paper to map inundated area.
III. Models
Difference- In-Difference Model
A quasi-experimental approach known as Difference-In-Difference (DD) method was employed to measure the effect of a flood event on flood prone property prices in Albany, Georgia. The DD method allows us to isolate the effect attributable to the flood event from the effect of other contemporaneous variables that might have influenced property prices. The control group in DD approach is composed of properties that are outside of floodplains. In order to determine the effect of the 1994 flood on property prices the Difference-in-Difference (DD) model traditionally used is:
100 500
100 500 (1)
In this model, the price of a property, P, is modeled as a function of structural characteristics, S, (e.g. number of rooms, size of the house), neighborhood and location characteristics, L, (e.g. distance to river, distance to parks), and an environmental variable of interest, in this case the flood risk zones: 100 and 500 . The variable 100yrFP (100-year floodplain) in this model is a dummy equal to 1 if the property falls within the 100-year floodplain and 0 otherwise. Similarly, the variable 500yrFP (500-year floodplain) is a dummy equal to 1 if the property falls within 500 year floodplain and 0 otherwise. The variable Flood in DD model is a dummy variable equal to one if the sale happened after the flood (July 1994 in our case). The interaction term between the 100-year floodplain variable (100yrFP) and Flood tells us how the 1994 flood might have affected the prices of properties that are in the 100-year floodplain and that are sold after the 1994 flood. Similar interpretation is true for 500-year floodplain and flood dummy
interaction. Census tract fixed effects (γi) were included to control for possible omitted variables such as crime rate or other unobserved characteristics in the community that are constant over time. Year fixed effects (δt) were included to capture yearly shocks that affect all the properties. White’s method was used to get estimates of standard error that are corrected for potential heteroskedasticity. The subscripts i and t represent property and time respectively.
We expanded the traditional DD model to incorporate the information decay effect in the model following Atreya and Ferreira, 2011. Thus, the new hedonic model in DD framework model is as follows:
100 500
100 500 (2)
100 500
To examine the persistence of risk premium over the years after the 1994 flood event we used interaction between years and floodplain variables. The variable “years” is a time trend that represents the number of years after the 1994 flood. The interaction term estimates how the risk premium changed over time after 1994 flood.
In order to address the issue of spatial variation in flood risk perception that the properties in inundated area will be discounted more heavily after a significant flood event since “seeing is believing” and also because there is structural damages in the actually inundated properties, we used the actual inundation map as a proxy to flood risk instead of floodplains in a DD framework. The specification used for the analysis is:
(3)
The term IND (inundation) is a dummy equal to 1 if the property was inundated by 1994 flood and 0 otherwise.
To tease out information effect of a new flood (information effect) from potential reconstruction cost (inundation effect), we used the interaction between floodplain dummy variable and the inundation dummy variable in a specification that as follows:
(4) We also divided the zones within study area into four mutually exclusive groups: inundated and in floodplain (IN_FP), inundated outside floodplain (IN_OFP), non-inundated and in floodplain (NIN_FP) and non-inundated outside floodplain (NIN_OFP). A DD model was employed to see the effect of the 1994 flood in these mutually exclusive groups.
Spatial Hedonic Model
In order to incorporate spatial effects into the regression model we considered spatial lag and spatial error the model. The spatial lag in a model implicitly assumes that the spatially weighted average of housing prices in a neighborhood affects the price of each individual house. In contrast, the spatial error assumes that there is one or more omitted variable in the hedonic price equation leading to measurement error. In order to measure the “true” effect of the explanatory variables and correct the influence of spatial autocorrelation leading to inefficient or inconsistent estimates we use Spatial Autoregressive Model with Spatial Autoregressive Disturbances and
exogenous regressors which is frequently referred to as a SARAR model (Anselin and Florax, 1995). The general form of our SARAR model is as follows:
ln 100 500
100 500 (5)
100 500
Where, ; |λ| < 1 and |ρ| < 1
In the model above P is the vector of housing prices, λ and ρ are the spatial autocorrelation parameter and spatial autoregressive coefficient respectively. W and M are n x n spatial weighting matrices that are taken to be known and non-stochastic. As many other studies, we impose W=M in our model (Fingleton, 2008; Fingleton and Le Gallo, 2008; Kissling and Carl, 2008; Kelejian and Prucha, 2010). We used a normalized spatial contiguity matrix from a coordinate dataset of the properties in city of Albany to account for the spatial dependence among the nearby properties. In a contiguity matrix, contiguous properties or the neighboring properties are assigned weights of 1 and non contiguous properties are assigned weights of 0. The existence of spatial autocorrelation increases the possibility that the errors will not be distributed normally. Maximum likelihood estimation procedures as those used by Bin and Landry (2011) depend on the assumption of normality of the regression error term, while the generalized moments approach does not. Thus, a generalized two stage least squares estimator that produces consistent estimates is employed (Arraiz, et al., 2010). The innovations uit are assumed to be independent and identically distributed (IID).
In order to determine the spatial variation in flood risk perception, a SARAR model was estimated to determine the price differential between inundated properties and non-inundated properties in city of Albany. It is hypothesized that the inundated properties will be discounted more heavily than the non-inundated properties irrespective of whether the property fall in 100-year or 500-100-year floodplain. The SARAR model employed to inundation study area is:
ln
(6)
Where, ; |λ| < 1 and |ρ| < 1 IV. Data
Three data sources are used to construct our data: individual property sales data for residential homes in city of Albany from the Dougherty County’s Tax Assessor’s Office; parcel level Geographic information System (GIS) database from Georgia’s GIS clearinghouse; and simulated flood inundation maps of Flint River at Albany, Georgia prepared by USGS. Each property is a single-family residence sold at least once between 1985 and 2010. Individual property sales data contain information on housing characteristics such as number of bedrooms, number of bathrooms, heated square feet, presence of garage etc. in addition to sale date and sale price. Property sale prices were adjusted to 2010 constant dollars, using the housing price index for Albany metropolitan area from the Office of federal Housing Enterprise Oversight. The GIS database was utilized to determine the location attributes of the properties such as proximity to river, railroad, major roads, parks etc. The floodplain map published as Q3 data by FEMA was used to determine if the parcel was in 100-year, 500-year or outside floodplain. Simulated flood
inundation for a water surface altitude of 192.5 feet at Albany stream gauge that corresponds to 1994 flood was used to determine the inundated area.
Over 18,000 single family residences in Albany were used in the analysis after outliers such as properties containing missing data, properties that were sold for more than $10 million and less than $2000 were removed from the sample.
To better capture the effect of flood in inundated area vs. non-inundated area, we confined our study area to flood inundation study area at Flint River, Albany, prepared by USGS (Figure 2). A little over 3000 single family residences were used to study the variation in risk perception within city of Albany.
Table I reports the summary statistics for the variables included in the final empirical model for City of Albany. The mean property price was 106,951 in 2010 constant dollars. The oldest property was built in 1841 with 0.41 average acres. The maximum elevation of the property was 290 meters and the minimum was 150 meters. Mean distance to Flint River was 15,524 feet. Twenty-one census tracts were included in the model as fixed effects. Of all the sales between 1985 and 2010, 8.7% of the properties were in high risk zone that has 1% annual chance of getting flooded or 26% chance of getting flooding at least once in 30 year mortgage. 1.3% of the properties were in low risk zone that has 0.2% probability of getting flooded each year.
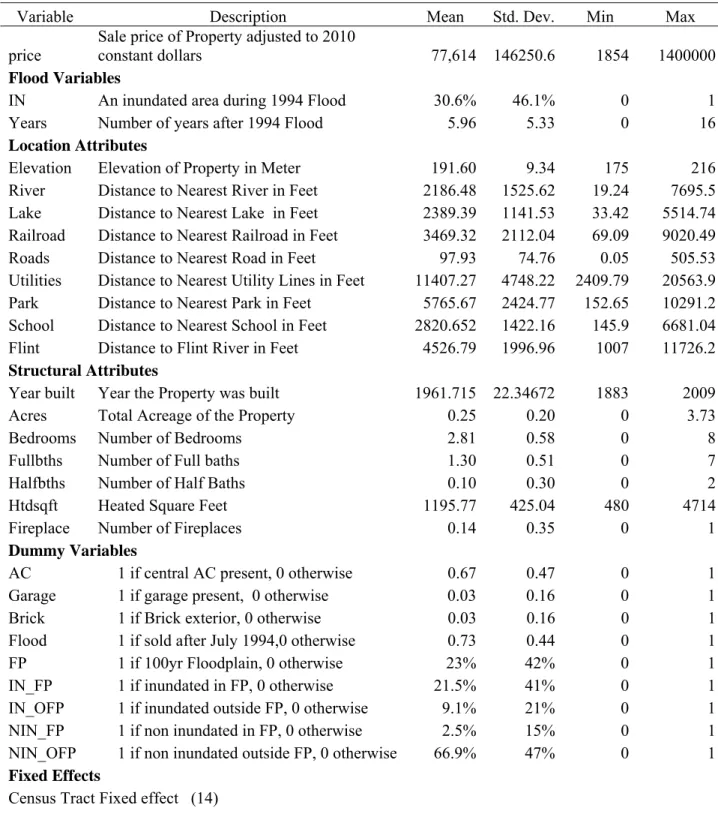
The summary statistics of the variables for the flood inundation study area is presented in table II. The average property price in the study area was $ 77,614. Mean elevation of the property in study area was 191 meters which is 16 meters less than an average elevation of a property elevation in Albany. Average distance of a property in the study area to Flint River was 4,526 feet. During the 1994 flood, 30.6% of the properties in the study area were inundated.
V. Results
Flood Risk Perception: City of Albany
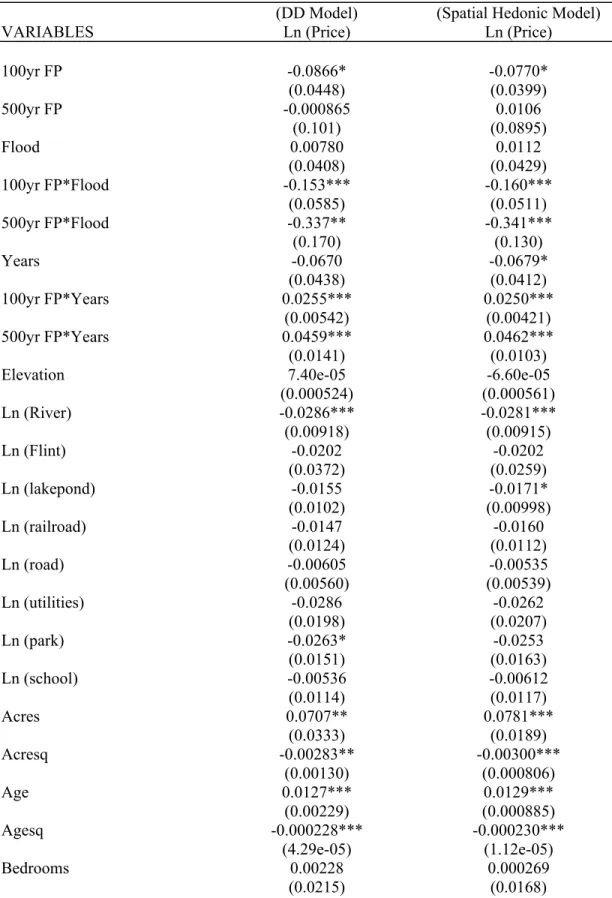
Table III reports our estimates of the effect of 1994 flood as risk information in the City of Albany using standard DD and SARAR models. The DD estimates show that there was a significant discount of almost 9% before 1994 flood, indicating that Albany residents capitalized the flood risk in property prices even prior to the flood event. OLS regression on pooled data for all sale dates prior to 1994 flood also showed us the same results.1 Immediately after the flood there was a significant discount of 15% and 33% in 100-year and 500-year floodplain respectively. However, the perception of flood risk was decreasing over time by 2.5% and 4.5% annually for 100-year and 500-year floodplain respectively. Consistent with results of Atreya & Ferreira (2011), annually, the value of the properties in 100-year and 500-year floodplain increased by $2654 and $4776 respectively indicating the shortsightedness of the homeowner’s regarding the flood risk perception. Spatial lag and spatial error was incorporated in the model since the Wald statistics suggested the presence of error dependence and lag dependence in the data set2. Incorporating the spatial effect in the model however did not change the results as seen in column 2, Table III.
People’s perception of flood risk is also expected to rely on the information about the location of the property at risk, their elevation, their proximity to the river, their closeness to inundation areas etc. The results indicate that proximity to river, lakes & ponds and other amenities such as school, roads, and parks increased the property prices in Albany. There was no significant premium associated with elevated properties. The results show that increasing the acres, number of bathrooms; having a fireplace and a central A/C would increase the property prices. It seems
1 Results are available upon request
2
that Albany residents would pay more for historic homes because there is a price premium of 7% for the older homes.
Flood Risk Perception: Inundated Study Area, Albany
In order to test the hypothesis that property prices in the actually inundated area will be discounted more heavily, we estimated the effect of the 1994 flood in an area around Flint River where majority of damage due to inundation took place. Table IV reports the estimates of a DD model.
In Specification (1), the effect of 1994 flood in the flood prone properties in the study area is determined. We find that the floodplain properties in the study area sell for 35% less than the properties outside floodplain. We included properties in 500-year floodplain in the “outside floodplain” sample since there were very few of them and also because the homeowner’s are not required to buy flood insurance if they are located in 500-year floodplain and, therefore; might be unaware of the flood hazard associated with being in 500-year floodplain.
In specification (2), we determined the after flood effect of being in inundated area. We find that immediately after the 1994 flood the property price discount in actually inundated area is as high as 46%.
To tease out the effect of being inundated and being in floodplain we used specification (3). We find that the inundated properties were discounted by 46% immediately after the flood but there was no significant discount associated with being in floodplain and being inundated.
We divided the entire study area into four mutually exclusive groups3 to see the effect of the 1994 flood in those areas in specification (4). We find that there was a significant discount of 47% and 43% respectively for properties that lie on the inundated and in floodplain and inundated and outside floodplain. We believe that this discount is because of the inundation effect rather than only the information effect since in specification (3) we did not see any discount for being in floodplain.
Surprisingly, we find that in this study area increase in acres, age and bedrooms would decrease the home value whereas having fireplace, a brick exterior and a garage would add value to the property4.
VI. Conclusion
Natural hazards provide exogenous risk information to the households. Studies have found that the risk information is capitalized to property prices. This provides researchers the ability to determine the reduction in the value of a property for increment in serious risk of flooding. When a flood event occurs, spatially differentiated group is assumed to experience different levels of risk. For some household the exposure to the flood risk is high while for others it is extraneous or unnoticed. Our analysis of 1994 flood in Albany allowed us to evaluate the difference in risk perception between the all Albany city and the area where most of the inundation occurred due to the 1994 flood. City of Albany was heavily affected due to the 1994 flood while the damage in the inundation study area was even more brutal. Our finding supports the hypothesis that the risk perception in the area where the actual inundation took place was higher as compared to rest of the area.
3 Definitions of each mutually exclusive group are given in descriptive statistics.
4
Table I: Variables and Descriptive Statistics for City of Albany
Variable Description Mean Std. Dev. Min Max
Price
Sale price of Property adjusted to 2010
constant dollars 106,951 116117.6 1854 3254400
Flood Variables
100yr FP An Area Inundated by 100-year Flooding 8.7% 28.30% 0 1
500yr FP An Area Inundated by 500-year Flooding 1.3% 11.40% 0 1
Years Number of Years after 1994 Flood 5.49 5.19 0 16
Location Attributes
Elevation Elevation of Property in Meter 207.84 15.57 150 290
River Distance to Nearest River in Feet 2233.99 1560.09 10.67 7695.5
Lake Distance to Nearest Lake in Feet 1802.67 1240.54 0 6410.27
Railroad Distance to Nearest Railroad in Feet 5786.86 4787.93 51.87 21872.46
Roads Distance to Nearest Road in Feet 118.40 99.14 0.02 1383.66
Utilities Distance to Nearest Utility Lines in Feet 9790.06 4792.89 313.09 21944.55
Park Distance to Nearest Park in Feet 8068.55 5526.33 148.41 24556.23
School Distance to Nearest School in Feet 3586.35 2413.21 83.51 13591.46
Flint Distance to Flint River in Feet 15524.12 9777.15 274.36 38899.21
Structural Attributes
Year built Year the Property was built 1966 18 1841 2010
Acres Total Acreage of the Property 0.41 0.64 0.01 32.41
Bedrooms Number of Bedrooms 3.03 0.72 0 30
Fullbths Number of Full baths 1.66 0.66 0 7
Halfbths Number of Half Baths 0.16 0.37 0 2
Htdsqft Heated Square Feet 1615.2 663.1 0 7576
Fireplace Number of Fireplaces 0.49 0.57 0 8
Dummy Variables
AC 1 if central AC present, 0 otherwise 0.87 0.32 0 1
Garage 1 if garage present, 0 otherwise 0.17 0.38 0 1
Brick 1 if Brick exterior, 0 otherwise 0.01 0.12 0 1
Flood 1 if sold after July 1994,0 otherwise 0.69 0.45 0 1
Fixed Effects
Census Tract Fixed effect (21)
Table II: Variables and Descriptive Statistics of “Flood Inundation Study Area”, Albany
Variable Description Mean Std. Dev. Min Max
price
Sale price of Property adjusted to 2010
constant dollars 77,614 146250.6 1854 1400000
Flood Variables
IN An inundated area during 1994 Flood 30.6% 46.1% 0 1
Years Number of years after 1994 Flood 5.96 5.33 0 16
Location Attributes
Elevation Elevation of Property in Meter 191.60 9.34 175 216
River Distance to Nearest River in Feet 2186.48 1525.62 19.24 7695.5
Lake Distance to Nearest Lake in Feet 2389.39 1141.53 33.42 5514.74
Railroad Distance to Nearest Railroad in Feet 3469.32 2112.04 69.09 9020.49
Roads Distance to Nearest Road in Feet 97.93 74.76 0.05 505.53
Utilities Distance to Nearest Utility Lines in Feet 11407.27 4748.22 2409.79 20563.9
Park Distance to Nearest Park in Feet 5765.67 2424.77 152.65 10291.2
School Distance to Nearest School in Feet 2820.652 1422.16 145.9 6681.04
Flint Distance to Flint River in Feet 4526.79 1996.96 1007 11726.2
Structural Attributes
Year built Year the Property was built 1961.715 22.34672 1883 2009
Acres Total Acreage of the Property 0.25 0.20 0 3.73
Bedrooms Number of Bedrooms 2.81 0.58 0 8
Fullbths Number of Full baths 1.30 0.51 0 7
Halfbths Number of Half Baths 0.10 0.30 0 2
Htdsqft Heated Square Feet 1195.77 425.04 480 4714
Fireplace Number of Fireplaces 0.14 0.35 0 1
Dummy Variables
AC 1 if central AC present, 0 otherwise 0.67 0.47 0 1
Garage 1 if garage present, 0 otherwise 0.03 0.16 0 1
Brick 1 if Brick exterior, 0 otherwise 0.03 0.16 0 1
Flood 1 if sold after July 1994,0 otherwise 0.73 0.44 0 1
FP 1 if 100yr Floodplain, 0 otherwise 23% 42% 0 1
IN_FP 1 if inundated in FP, 0 otherwise 21.5% 41% 0 1
IN_OFP 1 if inundated outside FP, 0 otherwise 9.1% 21% 0 1
NIN_FP 1 if non inundated in FP, 0 otherwise 2.5% 15% 0 1
NIN_OFP 1 if non inundated outside FP, 0 otherwise 66.9% 47% 0 1
Fixed Effects
Census Tract Fixed effect (14) Year Fixed Effect (1985-2010)
Table III: A Difference-In-Difference (DD) Model and Spatial Hedonic Model Results for City of Albany
(DD Model) (Spatial Hedonic Model)
VARIABLES Ln (Price) Ln (Price)
100yr FP -0.0866* -0.0770* (0.0448) (0.0399) 500yr FP -0.000865 0.0106 (0.101) (0.0895) Flood 0.00780 0.0112 (0.0408) (0.0429) 100yr FP*Flood -0.153*** -0.160*** (0.0585) (0.0511) 500yr FP*Flood -0.337** -0.341*** (0.170) (0.130) Years -0.0670 -0.0679* (0.0438) (0.0412) 100yr FP*Years 0.0255*** 0.0250*** (0.00542) (0.00421) 500yr FP*Years 0.0459*** 0.0462*** (0.0141) (0.0103)
Elevation 7.40e-05 -6.60e-05
(0.000524) (0.000561) Ln (River) -0.0286*** -0.0281*** (0.00918) (0.00915) Ln (Flint) -0.0202 -0.0202 (0.0372) (0.0259) Ln (lakepond) -0.0155 -0.0171* (0.0102) (0.00998) Ln (railroad) -0.0147 -0.0160 (0.0124) (0.0112) Ln (road) -0.00605 -0.00535 (0.00560) (0.00539) Ln (utilities) -0.0286 -0.0262 (0.0198) (0.0207) Ln (park) -0.0263* -0.0253 (0.0151) (0.0163) Ln (school) -0.00536 -0.00612 (0.0114) (0.0117) Acres 0.0707** 0.0781*** (0.0333) (0.0189) Acresq -0.00283** -0.00300*** (0.00130) (0.000806) Age 0.0127*** 0.0129*** (0.00229) (0.000885) Agesq -0.000228*** -0.000230*** (4.29e-05) (1.12e-05) Bedrooms 0.00228 0.000269 (0.0215) (0.0168)
Bedsq 0.000266 0.000320 (0.000916) (0.000685) Fullbths 0.246*** 0.259*** (0.0446) (0.0402) Fullbathsq -0.0418*** -0.0446*** (0.0109) (0.00931) Halfbths 0.0290 0.0232 (0.0439) (0.100) Halfbathsq 0.0273 0.0370 (0.0362) (0.0967) Htdsqft 0.000335*** 0.000337*** (3.96e-05) (3.92e-05) Htsqftsq -1.15e-08 -1.14e-08 (7.39e-09) (7.50e-09) Fireplace 0.0636*** 0.0572*** (0.0120) (0.0122) AC 0.120*** 0.122*** (0.0272) (0.0196) Brick 0.0335 0.0352
Census Tract Fixed Effect Year fixed Effect
(0.0478) Y Y (0.0437) Y Y Constant 12.25*** 12.40*** (0.830) (0.779) Lambda 0.0135*** Rho Observations 18,647 (0.00306) 0.562*** (0.0285) 18,647 Number of id 9,332
Robust standard errors in parentheses *** p<0.01, ** p<0.05, * p<0.1
Table IV: A Difference-In-Difference (DD) Model for Flood Inundation Study Area, Albany5
(1) (2) (3) (4) VARIABLES lnprice lnprice lnprice lnprice
FP -0.155 -0.124 (0.101) (0.199) IN -0.148 -0.0747 (0.0906) (0.140) FP*IN -0.00553 (0.252) FP*Flood -0.357*** 0.0893 (0.122) (0.270) Flood*IN -0.461*** -0.466** (0.115) (0.189) FP* IN *Flood -0.0867 (0.291) IN* Years 0.0630*** 0.0552*** (0.00920) (0.0132) FP* Years 0.0543*** 0.0120 (0.00990) (0.0141) IN_FP -0.206* (0.117) IN_OFP -0.0761 (0.140) NIN_FP -0.125 (0.199) Flood 0.216 0.308* 0.306* 0.302* (0.178) (0.179) (0.179) (0.179) IN_FP*Flood -0.471*** (0.129) IN_OFP*Flood -0.431** (0.197) NIN_FP*Flood 0.227 (0.352) Years -0.0220** -0.0309*** -0.0314*** -0.0308*** (0.00882) (0.00907) (0.00910) (0.00916) IN_FP*Years 0.0681*** (0.0105) IN_OFP*Years 0.0511*** (0.0148) NIN_FP*Years -0.00301 (0.0284) Constant 13.33*** 13.40*** 13.53*** 13.55*** (1.737) (1.724) (1.757) (1.757) Observations 3,007 3,007 3,007 3,007 R-squared 0.191 0.196 0.196 0.196
Robust standard errors in parentheses *** p<0.01, ** p<0.05, * p<0.1
References:
Anselin, L., and R. Florax. 1995. "Small sample properties of tests for spatial dependence in regression models: Some further results." New directions in spatial econometrics:21-74.
Arraiz, I., D.M. Drukker, H.H. Kelejian, and I.R. Prucha. 2010. "A SPATIAL CLIFF‐ORD‐TYPE MODEL WITH HETEROSKEDASTIC INNOVATIONS: SMALL AND LARGE SAMPLE RESULTS*." Journal of Regional Science 50(2):592-614.
Atreya, A., and S. Ferreira. 2011. "Forgetting the flood: Changes in Flood Risk Perception Over Time " Selected Paper, UNICT- EAERE- FEEM Belpasso International Summer School on
Environmental and Resource Economics, Belpasso, Sicily, Italy, Sept 4-10 September, 2011. Fingleton, B. 2008. "A generalized method of moments estimator for a spatial model with moving
average errors, with application to real estate prices." Empirical Economics 34(1):35-57.
Fingleton, B., and J. Le Gallo. 2008. "Estimating spatial models with endogenous variables, a spatial lag and spatially dependent disturbances: Finite sample properties*." Papers in Regional Science 87(3):319-339.
Freeman, A. 2003. The measurement of environmental and resource values: theory and methods: RFF press.
Kelejian, H.H., and I.R. Prucha. 2010. "Specification and estimation of spatial autoregressive models with autoregressive and heteroskedastic disturbances." Journal of Econometrics 157(1):53-67.
Kissling, W.D., and G. Carl. 2008. "Spatial autocorrelation and the selection of simultaneous autoregressive models." Global Ecology and Biogeography 17(1):59-71.
Messner, F., and V. Meyer. 2006. "Flood damage, vulnerability and risk perception–challenges for flood damage research." Flood risk management: Hazards, vulnerability and mitigation measures:149-167.
Pielke, R.A., M.W. Downton, and J.Z.B. Miller. 2002. Flood damage in the United States, 1926-2000: a reanalysis of National Weather Service estimates: University Corp. for Atmospheric Research. Rosen, S. 1974. "Hedonic prices and implicit markets: product differentiation in pure competition." The
Journal of Political Economy 82(1):34-55.
Slovic, P. 1987. "Perception of risk." Science 236(4799):280.
Stamey, T.C. 1996. "Summary of data-collection activities and effects of flooding from Tropical Storm Alberto in parts of Georgia, Alabama, and Florida, July 1994."